👁 VIGIL 1.5 IS LIVE.
The biggest update since launch.
VIGIL has evolved across almost every layer of its framework. From how it reads market cycles and identifies potential setups, to how it maps liquidity, evaluates conviction, and delivers its analysis.
Here's what's new:
01. A MUCH RICHER L2
Deeper structural analysis, pattern recognition, clearer conviction, more complete liquidity mapping, projected levels, and a self-correcting monthly read.
02. A REBUILT FRIDAY SCAN
A new weekly market overview, Inverse × L2 alignment, improved BTC/ETH analysis, and a cleaner delivery of the information that matters.
03. QUALITY GATE 0.9
An optional new filter that helps narrow hundreds of potential setups down to the strongest candidates.
04. EXPANDED MARKET INTELLIGENCE
300 cryptocurrencies and 100+ real-world assets covered every Friday. Search by company name and analyze individual tickers on demand.
05. A PUBLIC PERFORMANCE RECORD
Introducing /grader. Every qualifying 1.5 call is recorded and graded after 28 days. Publicly accessible, open to everyone, and never edited.
06. AN IMPROVED DATA FOUNDATION
Refined price data, stricter validation, more reliable liquidity tracking, and safeguards against outdated or incorrectly matched data.
07. A NEW WEBSITE AND TECHNICAL GUIDE
The website has been redesigned, the technical page updated to 1.5, and /guide now explains every term used in VIGIL's reports.
AND THERE'S MORE.
VIGIL now has a FREE weekly email version, delivering 12 setups every week, straight to your inbox.
No subscription required: https://t.co/E9fJRfIPHP
The framework evolves. The tools get better. The record stays public.
Explore VIGIL 1.5 and experience it yourself:
https://t.co/BEukxirtVs
Be early by system, not by luck.
👁 VIGIL
Just went through like 50 charts and they all look horrible.
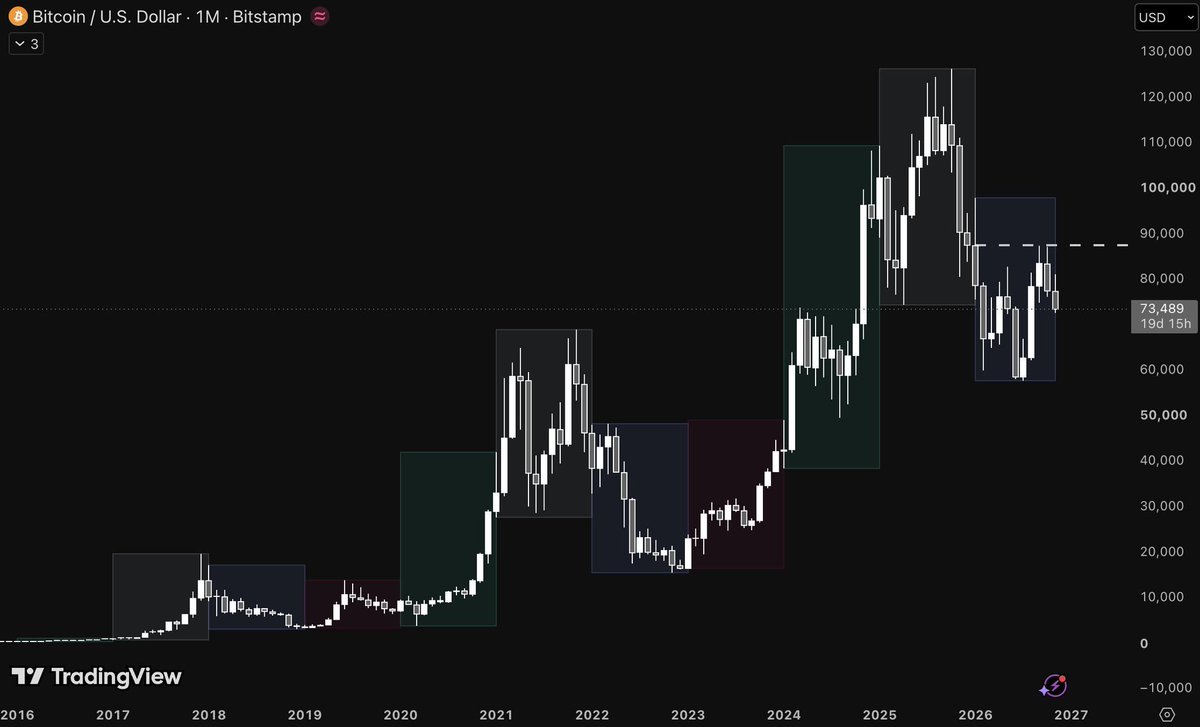
Most coins and even many stocks, are horribly exhausted here. That leads to the question: which side is more likely on a macro level?
Id say if we bleed, we bleed slower. Big moves lower at these levels just arent that possible.
Makes you question whether the market is actually preparing for a buyside run, right?
Everyone sees the move eventually.
The advantage is seeing it before it becomes obvious.
VIGIL tracks 400+ charts and surfaces the ones worth watching through structure, cycles and timing.
Get started for free: https://t.co/HjmfO8eGTq
The market didn't die last week because Jensen cheated on his wife. And this is something no one will tell you.
The real hierarchy that moves the chart is the following:
Time » Price » Liquidity
There are rules all of them have to abide by. Think about it.
Time: a bull run can't happen after a bull run. And for the obvious reason that the chart, on the horizontal scale, is plotted with time. That's our main measure of the market, and price comes second.
Once those two aspects align, then we can consider liquidity.
Why? The chart will never do something that wasn't within its hands. NEVER.
The $NVDA move was always reasonable, just like the indices move. Otherwise, I couldn't have warned you all about it.
Liquidity is emotion and motion injected into the markets to make something play out faster that was already within the chart's hands.
And that is what real market manipulation is.
As a trader, you MUST fixate on patterns.
And the next pattern you must observe will be the ANTHROPIC IPO.
Pay close attention to how the market reacts to the biggest AI IPO ever, because it will project the market's opinion on AI for the foreseeable future.
The market is smart. Learn to read its signs, and pay attention to $ANT .
THIS IS THE MOST DANGEROUS DEAL IN THE ENTIRE AI BOOM.
Anthropic needs Broadcom's AI chips to run Claude.
It does not buy them directly.
Instead, Wall Street banks and Blackstone put $63 billion into a separate company, and that company buys the chips from Broadcom.
That company then rents the chips to Anthropic.
Over the life of these leases, Anthropic owes about $161 billion in rent on Broadcom equipment.
So where does Anthropic get the money to pay that rent?
Partly from Broadcom.
Broadcom has agreed to lend Anthropic up to $42 billion, and that money can only be used to pay rent on Broadcom's equipment.
Broadcom sells the chips, then lends the customer money to pay for them.
If Anthropic cannot pay the loan back in cash, Broadcom can take Anthropic shares instead.
So why is this dangerous?
First, the sales are not as real as they look. When a company lends its customer the money to pay its bills, part of its revenue is just its own cash coming back.
Second, everything depends on one customer. Broadcom's own filing warns about its dependence on a small number of customers for AI chip demand.
Anthropic alone owes $161 billion on its equipment.
Third, Anthropic does not have the revenue yet. It made $16.96 billion last quarter but has committed $895.4 billion to compute.
Many of these contracts must be paid even if Anthropic never uses the capacity.
Fourth, the chips are the collateral. AI chips lose value fast as newer models come out. If Anthropic cannot pay, lenders are left holding equipment worth far less than the debt.
If AI demand slows, the whole chain breaks at once.
Anthropic misses payments, Broadcom loses its biggest customer and its loan, and the banks and Blackstone take losses on the debt.
This exact setup played out in 1999 and 2000.
Lucent and Nortel lent billions to their own customers to keep equipment sales growing. When those customers went bust, the loans were never repaid, and both stocks collapsed.
The current situation is getting dangerously close to the dot-com bubble.
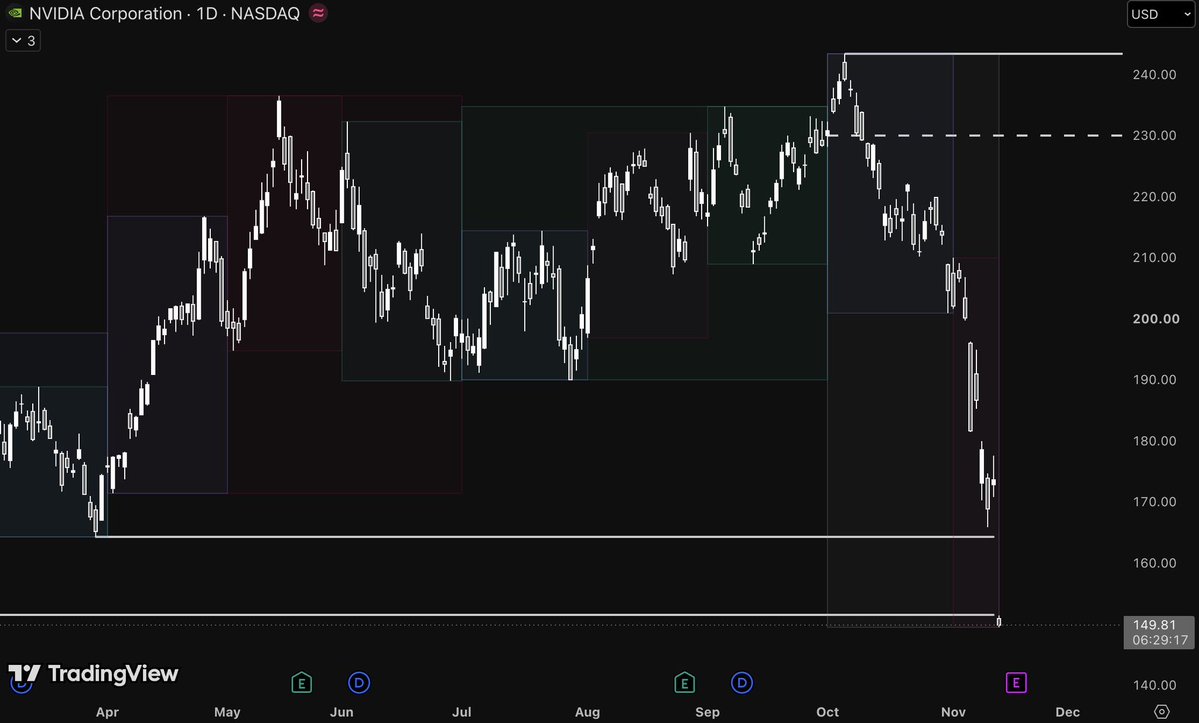
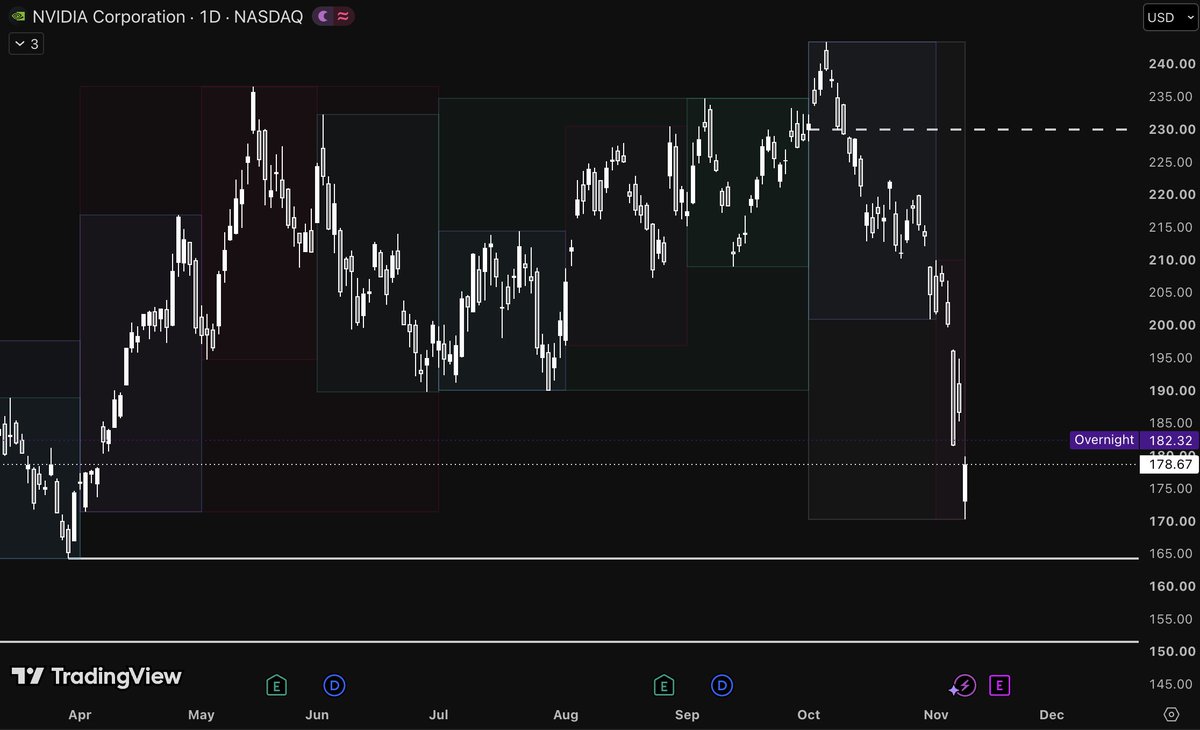
$NVDA has just swept my targeted lows during 9:30 open. Both 164 and 151.
I can now foresee some relief in the stock, but still wouldn't advise taking any quick positions here.
Tho $NVDA is really hard to read at the moment due to the "news" lmao.
Its clearly in Distribution this month and there seems to be a major draw on liquidity at 165, which the chart seems heavily interested in.
This is not a chart to catch a falling knife on. Moves are too sharp, and theres no clear sign of a reversal after the sweeps yet.
ethereum:0x58d97b57bb95320f9a05dc918aef65434969c2b2 is getting ready to bleed.
VIGIL tagged this chart as a highest conviction setup, and looking at the chart the direction is obvious.
Whats scary is how stacked the sellside liquidity is on this chart. Many times these setups dont lead to such obvious sweeps tho.
If you can keep an eye on this chart and find a proper entry, this could potentially bank you a good trade.