$BTC in double three pattern corrective waves :
W (a-b-c) in 5-3-5 structure
X to connect W and Y
Y (a-b … in progress ) where also in 5-3 structure until now.
b may terminate at 0.382 to 0.5 of a (67,000-70,000~)
Then c wave follows to terminate as Y.
Another possibility that Y could be in triangle pattern.
Currently let observe where b wave to terminate. This will be a good indicator.
You don't have a trading problem.
You have a decision problem.
"Qumo Rekt Shield™" just shipped V2.
One month in the making. It scores how a trade fails before you click. Not a signal app.
10 minute read that'll change how you trade, forever 👇
https://t.co/VuQYsEtdrf
bitcoin:native potentially in the progress of 5-3-5 corrective waves , where two channels of convergence could mark the final phase of capitulation or despair in Q3.
$BTC Bitcoin - Update
So far so good, the daily low is being set on shedule by the 6th of Februrary and we saw a bounce from the 63K-65.6k area despite an initial wick below it.
On the 9th of February the 3D chart will flash a fake death cross which needs a fresh low for validation.
So if the price makes a new low, 54K-55K should come.
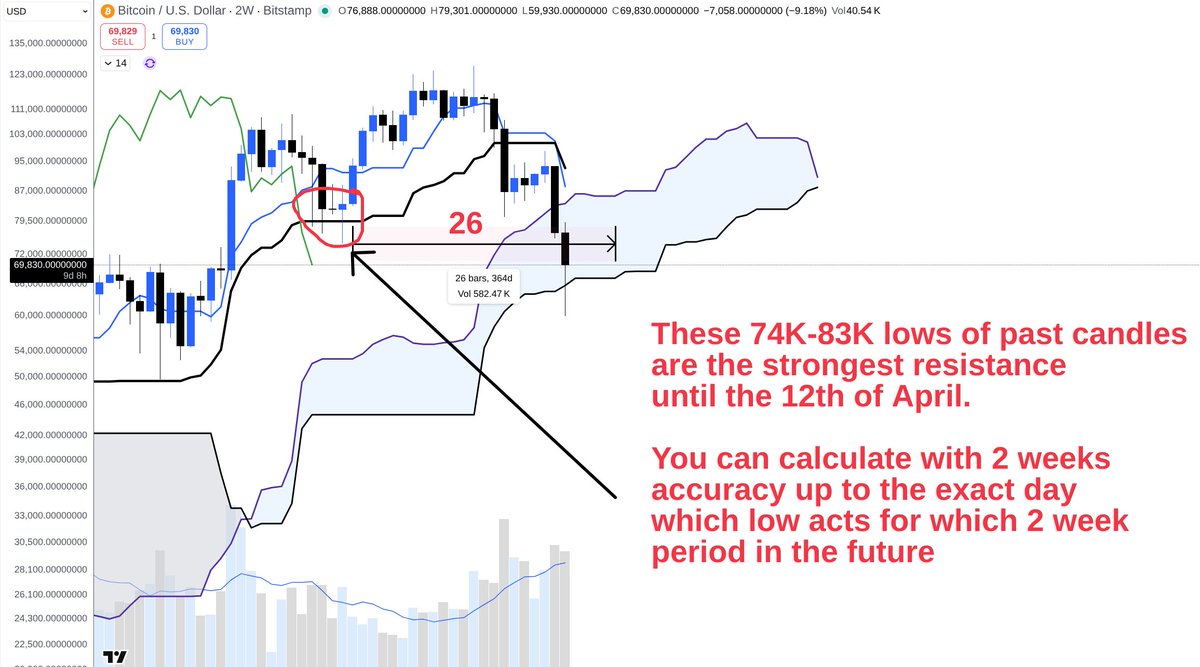
If it doesn't make a new low and instead this indeed is a short/mid term bottom for a while, then anything above 79K-82K *IF it comes by the 12th of April* should be a gift opportunity for bears on high timeframes before the next leg down, as explained here: https://t.co/6Nl7OSDEsl
If prices higher than 79-82K come after the 12th of April we need to re-evaluate.
More about fake and real TK crosses here: https://t.co/9fKXmyFG3J
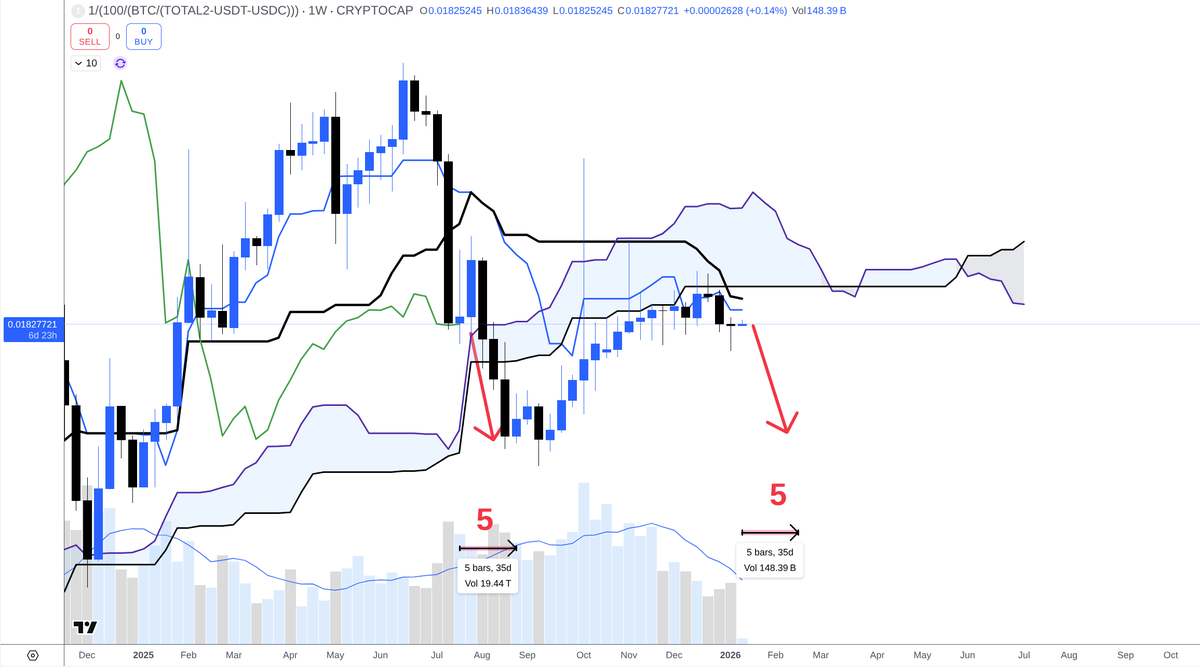
Altcoins are in a position to outperform Bitcoin for some time and manifest a (mini) altseason starting latest in the week 5th-12th of January.
A hint for this is the triple bearish bias (kumo, TK and CS) when the ratio is hitting resistance so the most logical thing is a rejection and CS hints also for its timing.
Real $BTC.D dominance I call the clear ratio chart excluding stables.
If you remember from my last post, 5th of January is also the start of the two weeks period about which I posted that Bitcoin can start moving upwards as the 89K resistance will be shifted to 96K exactly on the 5th of January.
A quick note, Bitcoin dominance dumping might not feel like a "real" altseason due to the overdilution of the market with too many tokens which require way too much capital to move their price.
Last time when dominance dumped a lot, many people kept asking when will altseason start during the months in which technically it was already happening.
Also keep in mind that I've no idea how big that reversal could be, all I see is a logical place and time for a weekly rejection. The red arrows are rather a guide for a mid-optimal scenario.
Optimal scenario for altcoins would be a lower low and CS closing below the kumo, i.e. the weekly flipping bearish.
Pessimistic scenario would be an initial rejection followed by a consolidation and bullish continuation but for me that's rather 40% chance or so provided how all high timeframes look now.
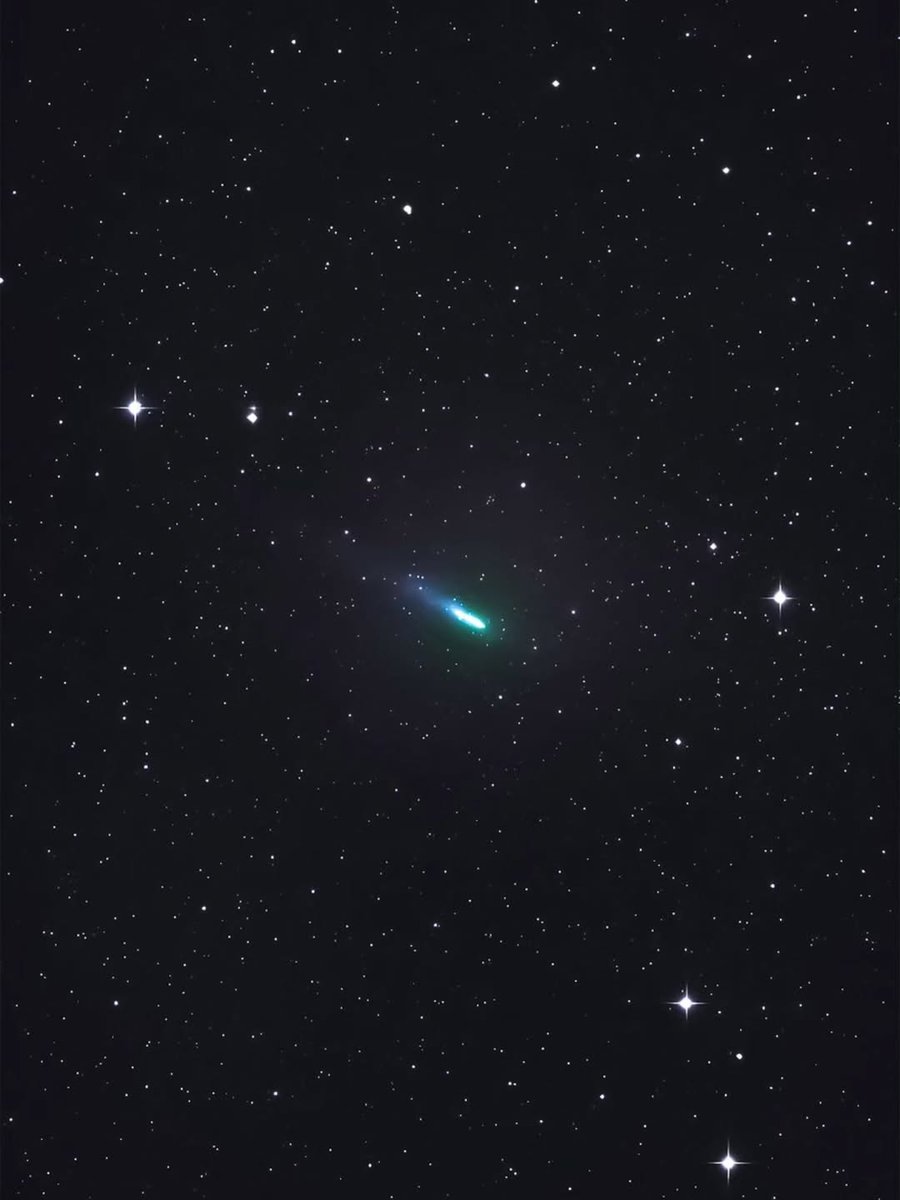
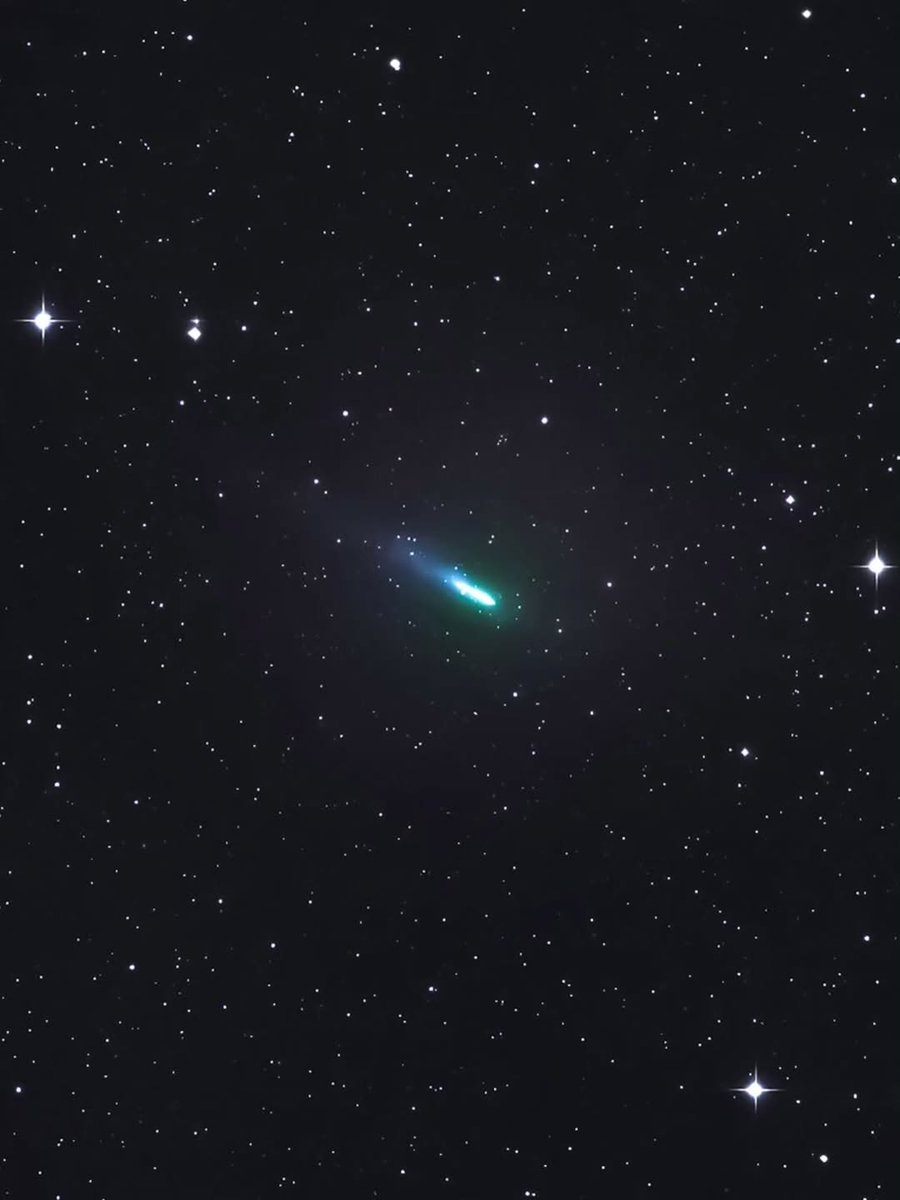
🚨: This is Comet 3I/ATLAS, captured by ig/niickjackson during its closest approach to Earth on December 19. Once it leaves our skies, it will never return.
$BTC Bitcoin
Currently the most likely scenario is to range a bit here till 2026 to kill entirely the daily downtrend and eventually to pump to 98K-103K marking a major top at these levels between the 12th and 18th of January.
The bottom should be either in or mostly swept at 80K.
This pump if happens should represent a nice opportunity to derisk and protect capital as we are already in the crypto autumn scenario and even though the bull run and the super cycle are still in play, bullish trend on HTF and ATH are extremely unlikely for the next 6-12 months now when the uptrend is not active anymore on the weekly and biweekly timeframes.
On the daily you can see how the downtrend is wearing off as CS has entred the candles.
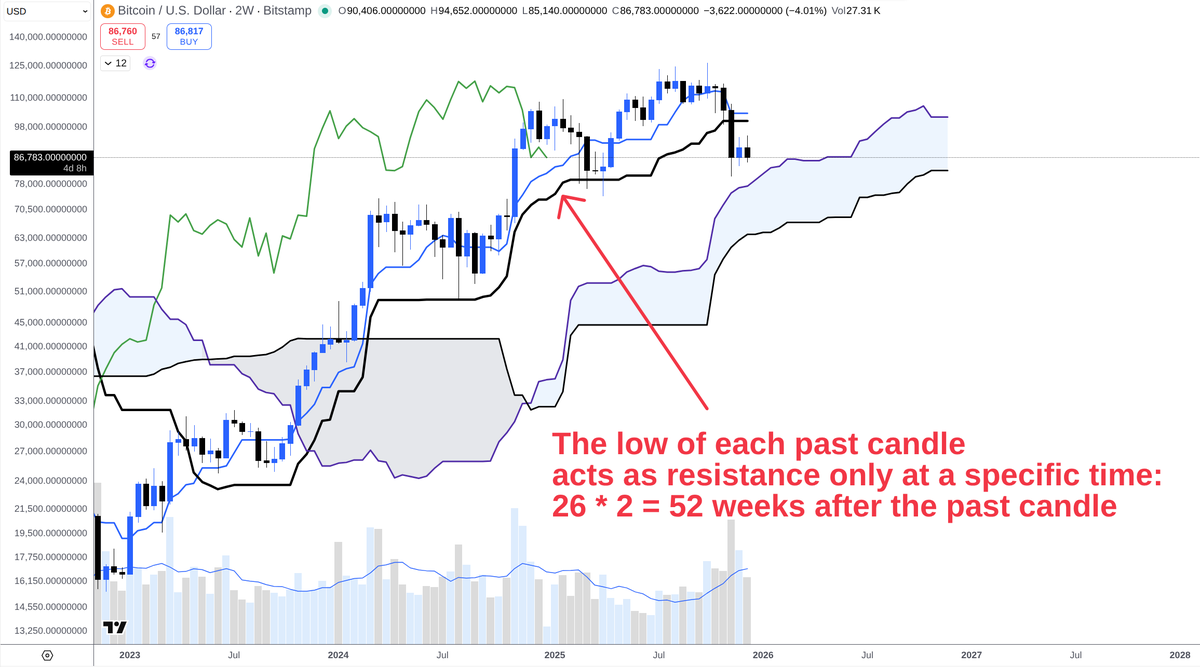
The best timing clarity comes from the biweekly timeframe where you can see how CS keeps respecting the candles with perfect accuracy on each specific date.
That's the reason why for the last two months ~92K was such a strong resistance.
Based on this timing model (past candles at CS acting as resistance):
- $91,351 is resistance till the 21st of December
- $89,164 is resistance between the 22nd of December and the 4th of January.
- the same resistance is elevated to $96,168 between the 5th and 18th of January which makes it the most likely period to attack higher prices like the obvious resistance of 98K (and probably a wick to the higher one at 103K).
As this is a 2W timeframes wicks in the resistance are not uncommon and significant in terms of price but it's very hard to close and hold above the resistance.
That's why for the next 2.5 weeks it will be very hard to start a rally above 89K.
Which gives time for the daily chart to range around and "kill" the thick bearish kumo by SSB going down and SSA going up. That's why if the bottom indeed is in the most likely scenario for the rest of the year is chop or very slight pushes to the upside which end up being rejected.
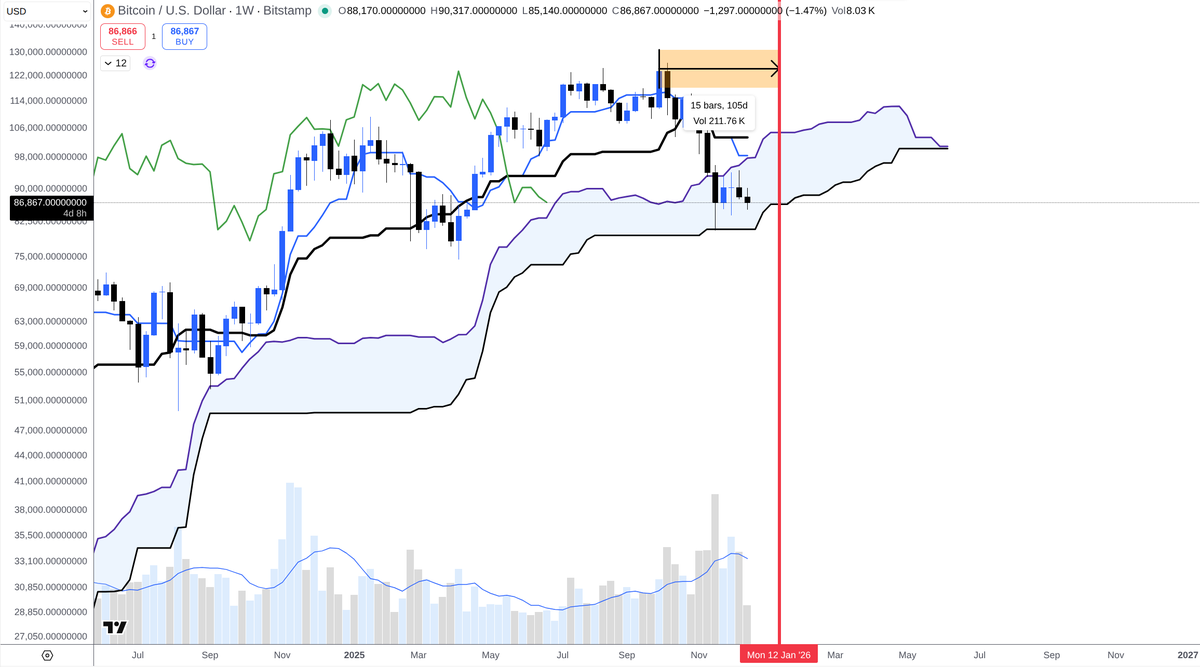
Zooming in further in this period which we take from the 2W timeframe, using the weekly cycles, you can see 15 (Kihon Suchi 17-2) weeks for a potential cycle high from ATH between the 12th and 18th of January which makes this week the perfect candidate for this major top scenario.
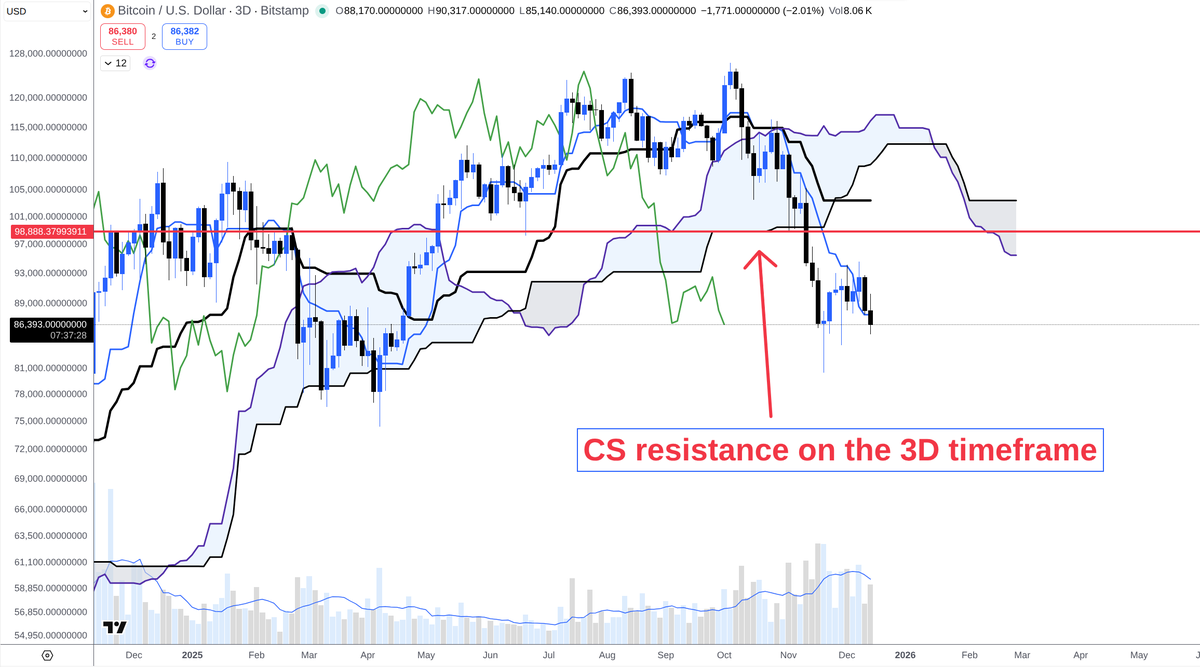
It's important to understand that while 103K and 98K are both key levels (98.4K and 103.4K to be precise), 98K is the SSB resistance at CS on the 3D which is very rarely touched during a downtrend and if it is normally it's very short-lived. So 103K should be significantly harder to come than 98K and if it comes it should be a pretty quick wick.
If the daily local bottom at 85K doesn't hold the next HTF levels are the weekly SSB at around 80K and biweekly SSA currently at around 77K and that is certainly possible.
But it seems like too many people are bearish and expecting 7 handle which makes this scenario less likely along with the daily chart losing bearish momentum.
You'll have plenty of time to bid the bottom wherever that is. Usually you get multiple shots at it too (multiple weeks, double bottom, breakout/re-test). It's much different than a top where you have to be quick and often only have a few days.
$BTC 2D candle
- Breakout mid channel resistance and moderate double bottom targeting top of the channel ~127000
- Trading range of this channel is ~16%
As $ETH previous weekly closed as bearish engulfed pattern, next mid channel support at ~4000 and full channel support at ~3500.
$ETHBTC wave IV in progress , anticipate the support range at 0.382 ~ 0.035 ish.
That’s why $BTC.D currently showing downtrend reversal. ~60% could be interim target.
In summary , $ETH will be more corrective than $BTC in the coming weeks.
At the same time , let observe
TOTAL3ES/BTC and TOTAL3ES/ETH breakout pattern to evaluate alts out performance or not.
📚Ichimoku Theory - Free Learning Material
Below is the full list of the 17 educational threads I've posted on Ichimoku Theory.
If they don't contain the entire Theory they probably contain more than 90% of it. I think that it's fair to say that it's impossible to find in written English this information for free.
The amount of characters in all threads are approximately 100,825.
One standard page is 1800 characters so this is ~56 pages of pure text.
But, in reality books are often issued with bigger line spaces so they fit less than 1800 characters per page.
If we account for that and all graphs, videos and images, I think that the page number can go up to 75-100.
This is an entire book for you - here, for free.
Enjoy it, but don't forget to share it.
You got it for free, share it for free.
If you like it but you don't feel like sharing it you can still pray for the sinful soul of Doctor Cat.
Threads index 👇
1. The Ichimoku TA system https://t.co/11VuuxKAQr
2. Tenkan Sen https://t.co/FmRcWFttGY
3. Kijun Sen https://t.co/hhcsgxz4py
4. Real and fake TK crosses https://t.co/9fKXmyGdTh
5. SSA https://t.co/IvrHdohRIJ
6. SSB https://t.co/NABpsmvjYM
7. Kumo https://t.co/x7RGztHlaj
8. Chiko Span https://t.co/89u4FXJelQ
9. Sanyaku Signals https://t.co/ZtkbzOWHbD
10. Forecast lines https://t.co/GHaKeOme3o
11. Trend and range
https://t.co/itcQI9nNJ8
12. Key levels for visit and reversal
https://t.co/DylgkLtfWX
13. Bull and bear traps
https://t.co/jy9ysL92ah
14. Time Theory
https://t.co/qjdMnfGLKj
15. Wave Theory
https://t.co/vBocuh4sx1
16. Price Theory
https://t.co/0UeZkA2Guz
17. Kyushu Ashi https://t.co/tCcOJFYaUw