Assistant prof at the Institute of Economics, Polish Academy of Sciences, expert at @napokolenia. Research interests: environmental economics, IO and airlines
Our paper on market structure and resilience to disasters is now available online at @AJAE_AAEA
https://t.co/8pWnxXxi2A
Thanks @h_gnutzmann and @O_Kowalewski for excellent cooperation and the editor Timothy Richards for a great experience.
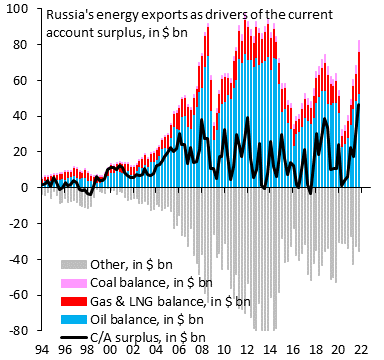
Oil exports (blue) are the main driver of Russia's c/a surplus (black). The EU is now debating an oil embargo. Key focus must be to trap Russian oil in Russia, since overflowing well heads will be a massive problem for Putin. Sanctioning oil tanker traffic is critical for that...
!!!!!! PLEASE RT WIDELY !!!!!!
1/2 Ukrainian scientists who left Ukraine due to war or plan to leave in the coming days; we will help find accommodation and jobs. Contact us here: [email protected]
Polska opowiada się za ekspresową ścieżką członkostwa Ukrainy w Unii Europejskiej. Status kandydata powinien być udzielony natychmiast, a rozmowy o członkowstwie rozpoczęte niezwłocznie po tym. Ukraina ma mieć też dostęp do środków z UE na odbudowę. To się Ukrainie należy.
🇵🇱🇺🇦🇪🇺
Wasn't sure if to write this. It is blunt and will offend surely many but I have privilege and therefore, responsibility. It is also long and personal. I am writing for Germans, but in English. It will reach more people this way and my German is not good enough. /1
Najmocniej natamiast namawiam do wspierania niezależnej inicjatywy naukowej, fundacji "Dobrobyt na Pokolenia" @napokolenia, którą miałem zaszczyt zakładać i finansować
https://t.co/ocerlH2shG
Szanowni,
grupa Dobrobyt @napokolenia działa od 3 lat, wydaliśmy ponad 200 analiz i komentarzy. Działamy bez sponsorów i bez grantów - po godzinach, własnym sumptem. Dziś zostaliśmy fundacją. Jeśli podoba Wam się to co robimy to zachęcam do wspierania:
https://t.co/ocerlH2shG
Job! Job! Job! We're looking for economists/geographers (PhD students, MA graduates) to work with us on a project measuring spatial inequality in the UK
Work at @CEP_LSE with me, @markfransham and @ndrlee.
Our research supported by the #NationalScienceCenter on Stock market response to #potash mine #disasters (a joint work with @pspiewan ) has been published in JCM and thanks to Elsevier free copies can be downloaded till Jan. 13, 2021. #IESEGResearch
https://t.co/TUM2eQN7zn
@TFr68@nworbmot You can produce ammonia wherever you want, but production costs of brown ammonia are almost fully driven by the natural gas prices. And it's definitely cheaper in Saudi Arabia.
@nworbmot At the moment, there is not enough capacity in the MENA region. But the capacity there is growing slower than one could expect in a competitive market. My gut feeling is that it is the EU trade policy/ protectionism, but perhaps someone here knows better? [2/2]
@nworbmot It's due to the Law of One Price. There is only one price for ammonia globally (+/- transportation costs). At the moment determined by high costs producers in Europe. Saudi export would have to replace the entire production in the EU for the EU (and global) price to drop. [1/2]
@nworbmot Since the US uses anhydrous ammonia for agriculture, the largest ammonia trade route was between Trinidad and Tampa and New Orleans, but the trade collapsed after the cost gap closed (after shale).
@nworbmot Nitrogen, for agricultural uses, is traded mostly in solid-state (urea or UAN). Except for the US, nitrogen is mostly applied in that form. But if you want to read more about international ammonia pricing you can have a look at my paper: https://t.co/YerkhqRBax
@paczyzak@hetmanski_m Really cool and looks really nice!! Do you have data on capacity utilisation? The utilisation rates are falling much faster than the capacity itself, especially in China. Thus, the raw capacity data does not give the full picture.
@nworbmot EU Country-level production data is indeed a challenge. For production capacity, https://t.co/y1ahshBXGx used to be a good resource, but now I can see that its full content is for members only.
Please share your progress on other chemicals.
@paczyzak@plotlygraphs@energyinstratPL@nworbmot Great visualization!!
But what we need labels on x and y axes and more info on your assumptions on capacity.
Useful extra statistics: How many GW/GWh of fossils/H2 do we need? Can we go one step further and integrate over the difference between the lines and add some storage?