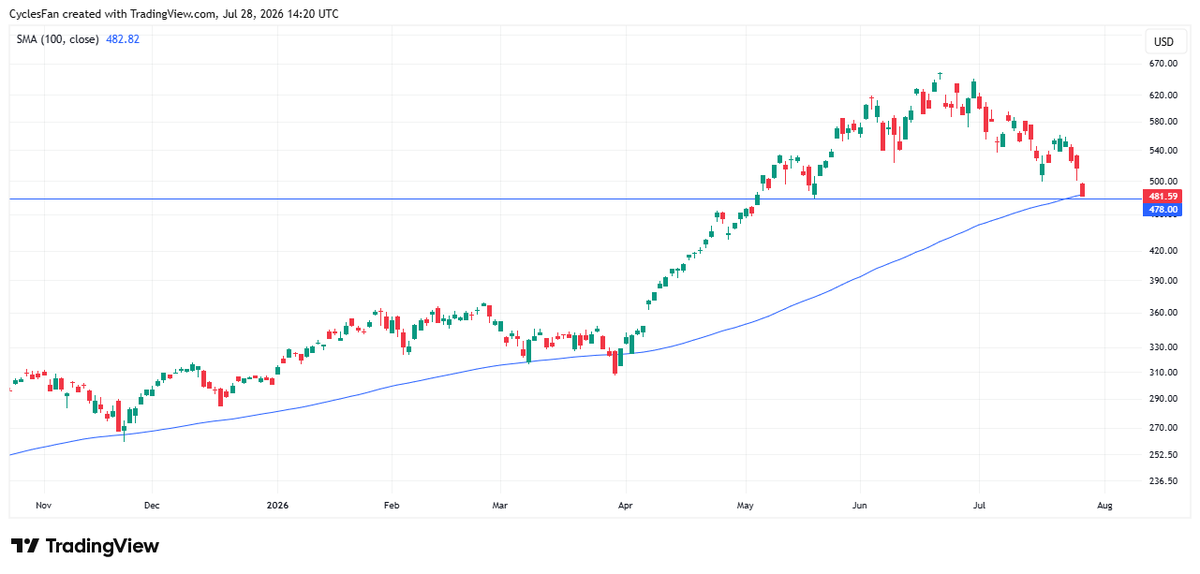
$SOXX has also hit its 100 day MA which is located just above the horizontal support of the May 19 low at 478. This is the ideal level to end the 1st down leg of this bear market and have a multi week bounce.
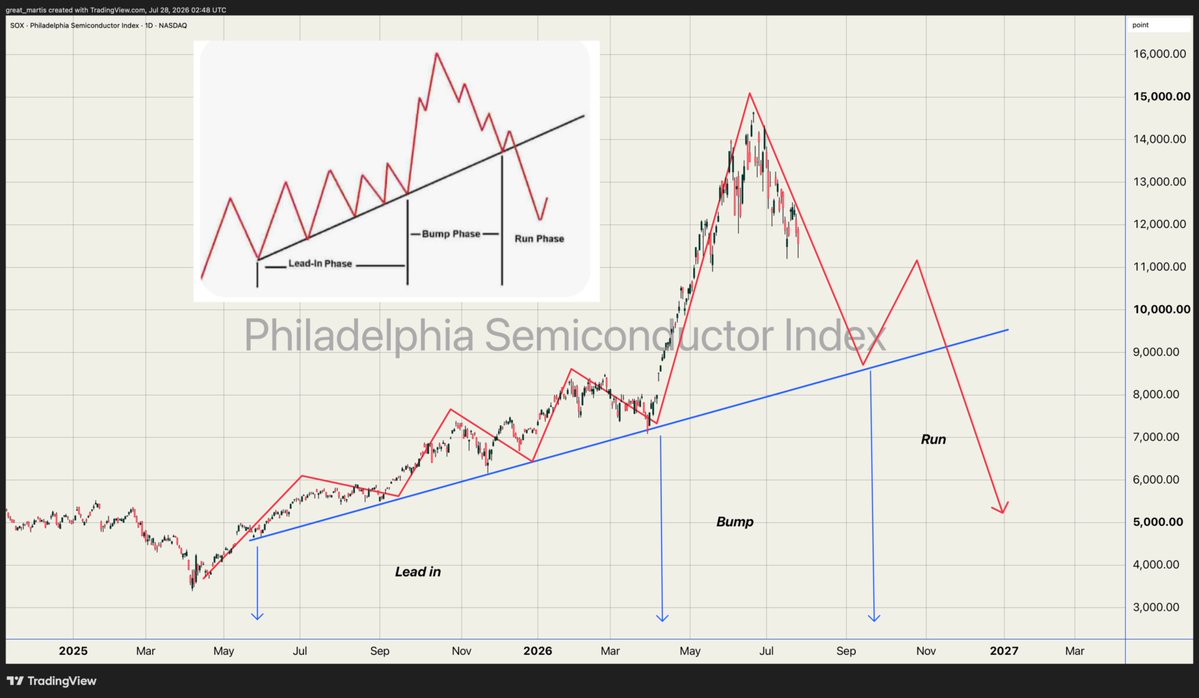
🚨The infamous yet extremely reliable bump and run pattern on the semiconductor index is screaming a drawdown warning, alerting to a drawdown, yet the Livestock remains oblivious.
The Kospi is leading the way downwards (as predicted) following the laws of the parabola.
Next to do so is the semiconductor index, followed by the Taiwan index. This synchronised collapse is likely to drag the entire market with it.
Technical analysis is like an archaeologist to hieroglyphics. It takes an astute reader of the footprints of truth to decipher, and my fellow compatriots the Great One has taken on the burden to do so with clarity, efficiency and pinpoint accuracy.
For one’s private perusal.
Enjoy,
yours truly
The Great Martis✨
She's beautiful.
🚨 THIS IS INSANE WHAT I JUST FOUND
This is the Dot-Com crash lined up with today's S&P 500.
And the match is almost PERFECT!
Every week, I check if the pattern finally breaks.
It does NOT!
The market keeps following the same structure:
→ Same final pump
→ Same rejection
→ Same first correction
→ Same weak recovery
→ Same setup before the real crash
Now look at the numbers.
Dot-Com crash:
→ S&P 500 dropped around 49%
→ Nasdaq dropped around 78%
→ The collapse lasted more than 2 years
Today:
→ AI stocks dominate the index
→ Valuations are near extreme levels
→ Retail is fully bullish
→ Everyone believes the rally continues
That's EXACTLY how the last bubble ended.
I'm not saying the S&P 500 repeats the Dot-Com crash tick for tick.
But when two market structures track this closely for this long, ignoring it becomes dangerous.
People will say this time is different.
THEY ALWAYS DO!
Follow now - you don't want to miss what's coming next!
Now add this:
The ONLY time MSFT relative to the Nasdaq 100 fell more than 40% over a 10-month period was at the exact top of the dot-com bubble.
Is this time different?
.
S&P 500 Elliott Wave Update
As I said in yesterday's video, it looks like the S&P 500 finished a 5 leg push down for wave 1 with yesterday's selloff lows. If we get a SpaceX rally, SPX and NASDAQ 100 could rally back up and even attempt to fill the gaps from last week.
I was right about a tech selloff ahead of SpaceX IPO, it will likely resume after the SpaceX IPO launch into July 6th. I'll explain why in a post later today.
$SPX $SPY #SP500 $QQQ $NDX
Explore the evolution of Mercedes-Benz: 1886-2026
140 years of defining luxury, speed, and innovation. Witness how a legacy was built from the ground up.
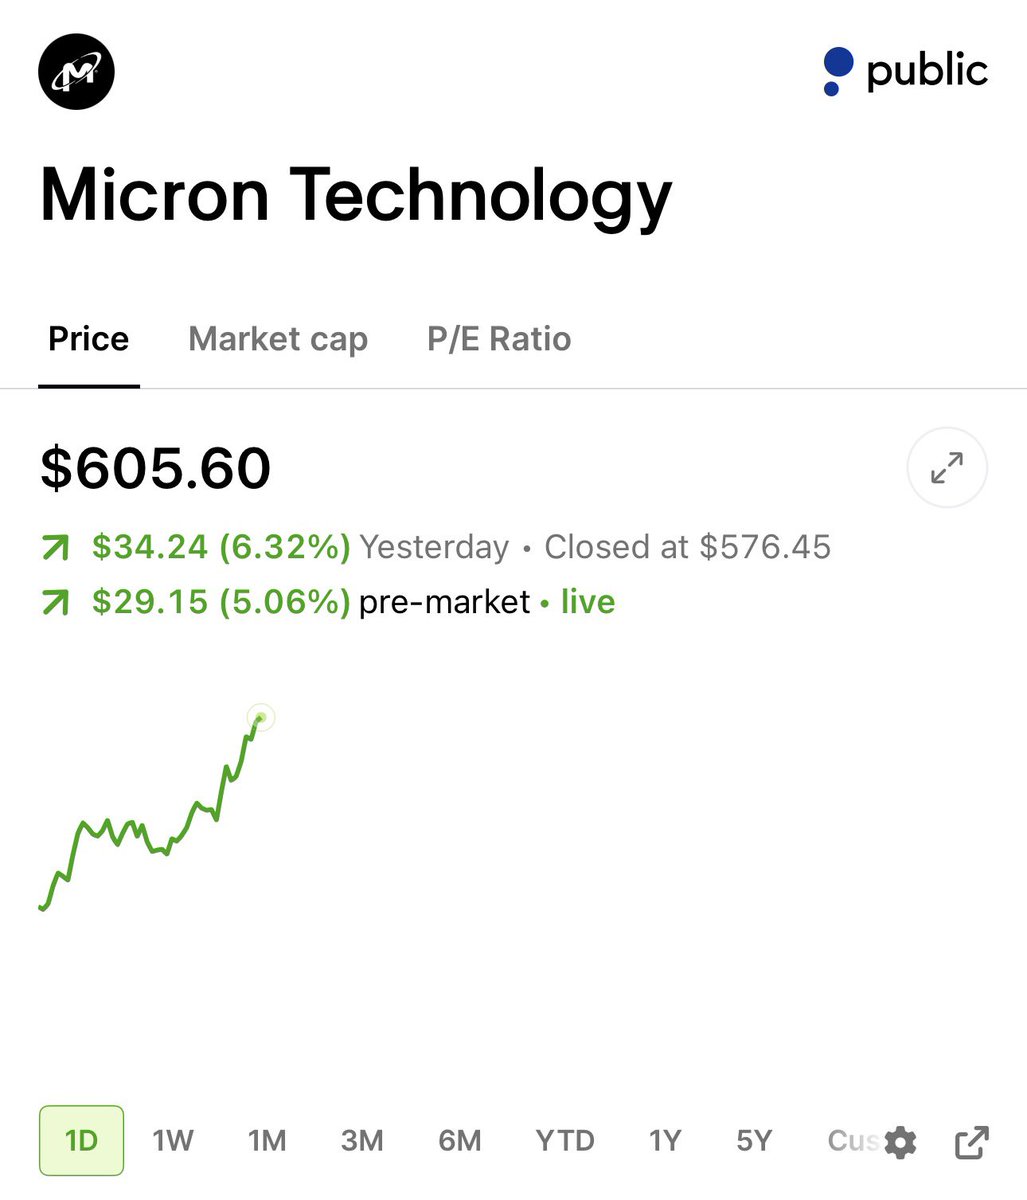
$NVDA Q1 Data Center revenue hit a record $75.2B (+92% YoY) with Vera Rubin still on track for the second half of this year.
The largest industrial buildout in human history is still running through one company.
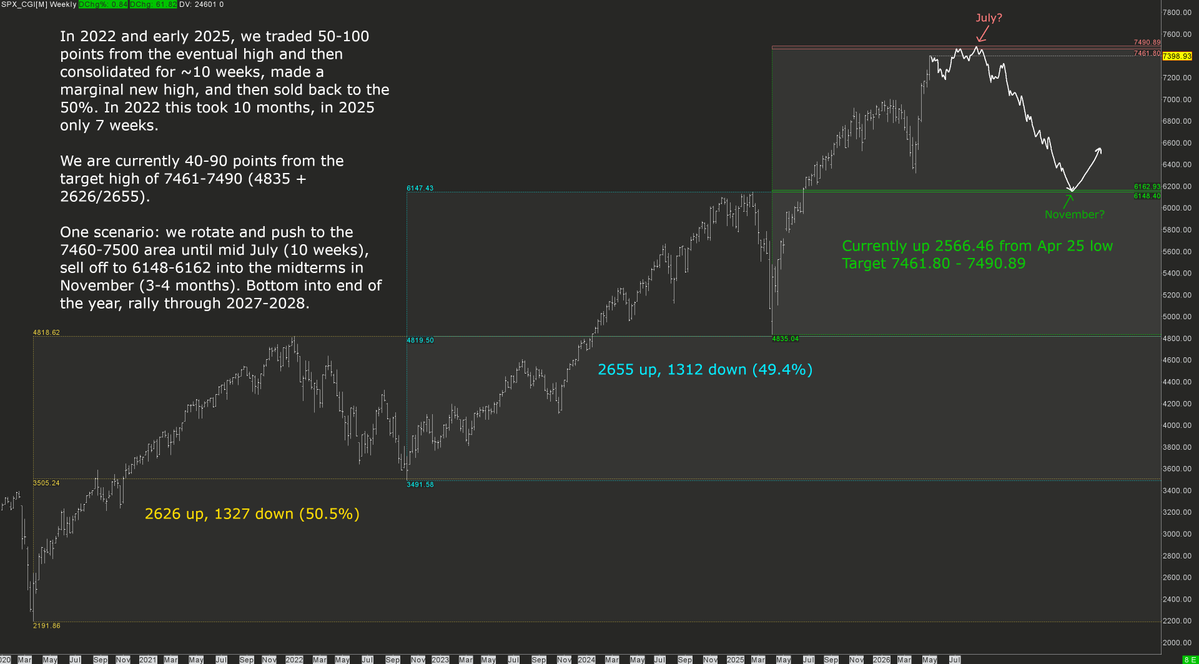
The symmetry on this chart is astounding.
Since the covid lows, the S&P has done this:
+2626 handle rally
-1327 handle (50%) retracement
+2655 handle rally
-1312 handle (50%) retracement
+2600 handle rally, so far...
What's compelling is the exactness of it all. The two rallies only differ by about 1%, and the retracements differ by less than 1%.
A rally of 2626 to 2655 handles from the Apr '25 tariff lows yields an upside target range of 7461 to 7490. Adding the 2626 handles from from the covid low to the high of that rally (4818) yields a target of 7445, also in that neighborhood.
Previous highs took about 10-16 weeks to form, with marginal new highs being made over that period, and then a 50% pullback. If this symmetry continued to play out, a goldilocks scenario would be:
1. Two-way balanced market with rotation through July, topping out between ~7450 and ~7520
2. Selloff over the summer into the midterm elections in November
3. Bottoming over the end of 2026 into early 2027
4. The *real* AI rally through 2027 into the 2028 election. Think something like: 10k S&P / 50k Nasdaq by end of 2028.
"Whoa, hold your horses there..." I know, this is not actionable and I'm not known for posts like this which lay out such long term scenarios. However, it is interesting enough that I wanted to share. We will have a good idea soon enough of whether this market can repeat this pattern for the third time.
#ES_F #NQ_F $SPY $QQQ $DIA #YM_F $SPX $NDX
S&P 500 CLEARLY FOLLOWS THE WYCKOFF DISTRIBUTION
Every key phase has already printed exactly where the model predicted:
Preliminary supply, buying climax, automatic reaction, and now Upthrust.
The next move will be a slow downtrend, leading to a Weakness phase with structural support at $4,835
If that level breaks, $4,250 opens up
Meanwhile oil is ripping, insiders are shorting size, yields are spiking, and breadth keeps dying
This is a typical inter-market distribution that has finally begun
FOLLOW + NOTIFS ON!
🚨 BREAKING: A BIG STORM IS COMING!!!
S&P hits $7,230, just as I said earlier, but…
Look closely at this chart and ask yourself one question.
All while this is happening amid BIG GEO TROUBLES:
- Oil price around $110
- The Strait of Hormuz is blockaded
- The US is preparing for possible war escalation
- No real objectives have been achieved
The escalation has only gotten worse,
and the market rallied into it.
I’ve seen this setup before.
When equities rally during an unresolved energy shock, the drop that follows isn’t slow.
It’s vertical.
Keep your eyes open because most people will notice this after it’s too late.
I was one of the only people who called the top in October, and I’ll do it again, that’s literally my job. Pay close attention.
If you still haven’t followed me, you’ll regret it.