Want to open your eyes to the reality of the market?👁️
Then read this.
People who enter financial markets for the first time think they're gonna trade against a bunch of stupid guys but in reality, they don't understand they’re gonna compete against the big banks and trust me, they're not here for charity purposes.
They’re involved in the markets to make hundreds of millions. (despite controlling the world, but this is another story)
When retail investors hear the term "manipulation," they usually think about conspiracy theories or things that have no real evidence, kind of like Bigfoot or the Loch Ness Monster, but the reality is way different.
Market manipulation is a well-documented phenomenon that can take various forms, such as pump-and-dump schemes, spoofing, front-running, wash trading, and coordinated short attacks.
There are no "natural market movements" (so no, your coin isn't the future of finance) but deliberate strategies employed by institutional players, aka SM.
"I don't believe you, show me proof"
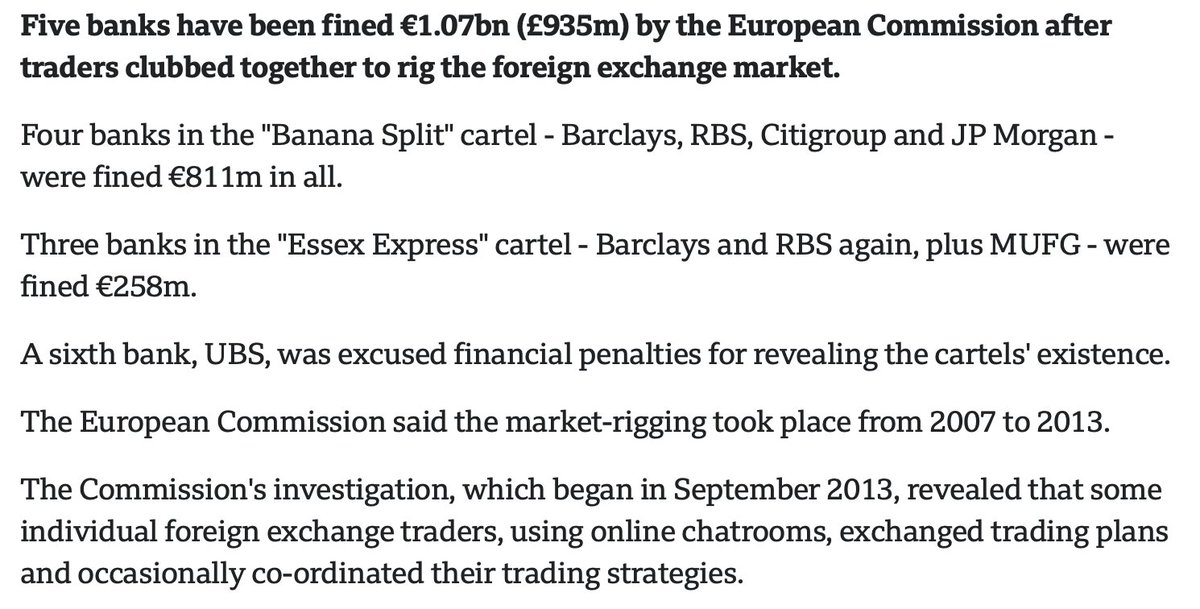
Via 2 cartels, 5 banks (Barclays, JPMorgan, Royal Bank Of Scotland, Citigroup and MUFG) between 2007 and 2013, manipulated the forex market utilizing chat rooms to share information regarding:
- orders
- prices
- trading activities
They were sharing insightful information between them regarding retail’s trading activities.
Like watching at the market with X-rays already knowing where retail traders put stop losses, market buys, selling targets and so on.
This happened in a "regulated" market such as the Forex one, what do you think happens in the crypto land where the average guy thinks he can become rich overnight with a few bucks?
Yes, you got it..it’s even worse and the roots of manipulation are dangerously solid.
Smart money operate behind the scenes, but how?
Imagine a big hunting season where these entities go to catch their prey..but who are the prey?
Retails, you might be thinking..and this is correct, but the appropriate expression for "prey" is liquidity.
So how do they do?
To understand it, we first need to cover the difference between 2 trading styles.
- Discretionary Trading:
Discretionary trading is a type of trading where the trader makes decisions on buying and selling based on their own judgment, experience, and analysis of the market.
- Algorithmic trading:
In algorithmic trading instead, computer programs or algorithms are used to execute trades based on predefined criteria such as price, timing, quantity, and mathematical models.
The last is the one used by smart money as it removes the emotional part and the one in which smart money invest the most capital.
And the majority of algorithms work on “breakout” strategies.
A breakout strategy works by executing trades when asset prices surpass predetermined support or resistance levels.
This strategy simply capitalizes on the influx of buy and sell orders from both retail traders and algorithms at these critical levels, aiming to capture liquidity concentrated within those areas.
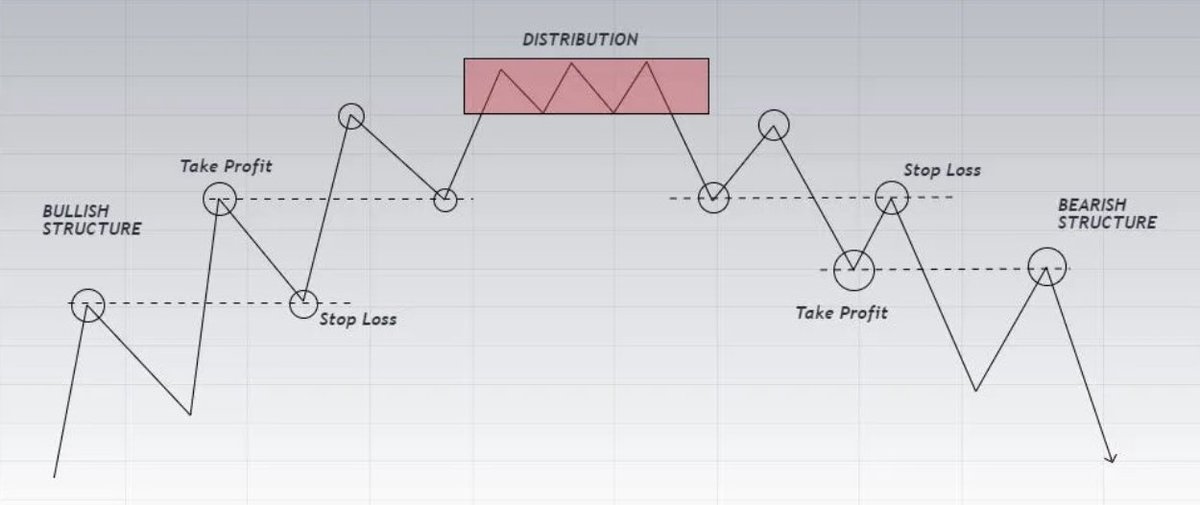
The example below will clarify the concept a little bit more:
On the left we have a clear bullish structure, followed by a distribution phase and then the classic mark-down (bearish structure).
Either traders want to ride the bullish structure (opening a long) or the bearish one (opening a short) they put orders into swing points.
Orders, concretely speaking, produce liquidity and this brings us back to the previous talks:
Smart money manipulate the market to reach important HTF points, grabbing liquidity and making retail traders poor.
The more orders ~> the more liquidity
The more liquidity ~> the more potential profits for smart money
That's why their priority is investing in trading algorithms where in most financial markets the percentage of algos trading volumes constitutes at least 60%.
Algorithms scan order books, analyze volume, and identify liquidity pools where large orders can be placed without causing excessive price movement.
Instead of chasing price action, they anticipate where liquidity will be and position themselves accordingly.
One of the many tools that find its way into these algorithms is Fibonacci retracement and not because of some mystical mathematical force, but because enough traders and institutions use it, making it a self-fulfilling mechanism.
Fibonacci levels often align with key liquidity zones where retail stop-losses accumulate.
These algorithms take advantage of that, engineering price movements to trigger these stops before reversing in the intended direction.
But Fibonacci alone isn’t enough and algorithms combine it with order flow data, MS, and statistical models to determine high-probability trade executions.
When a Fibonacci retracement level aligns with a high-volume node or a known liquidity zone, the probability of a reaction increases.
Plenty of strategies use Fibonacci extensions to project take-profit levels in trending markets, while others employ it in mean reversion models, expecting price to revert to equilibrium.
That's why you see prices reacting to Fib levels even during price discovery.
"Bro, I don't believe you.."
Ok, then look at the following 2 charts I analyzed back in the past.
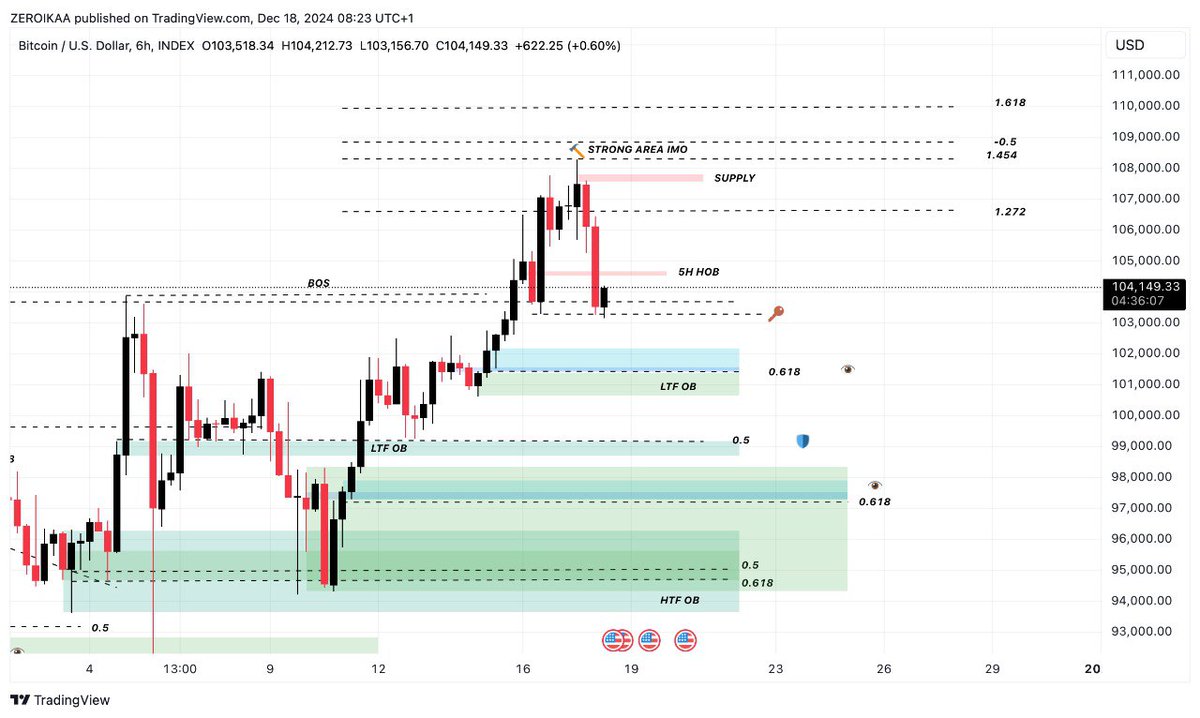
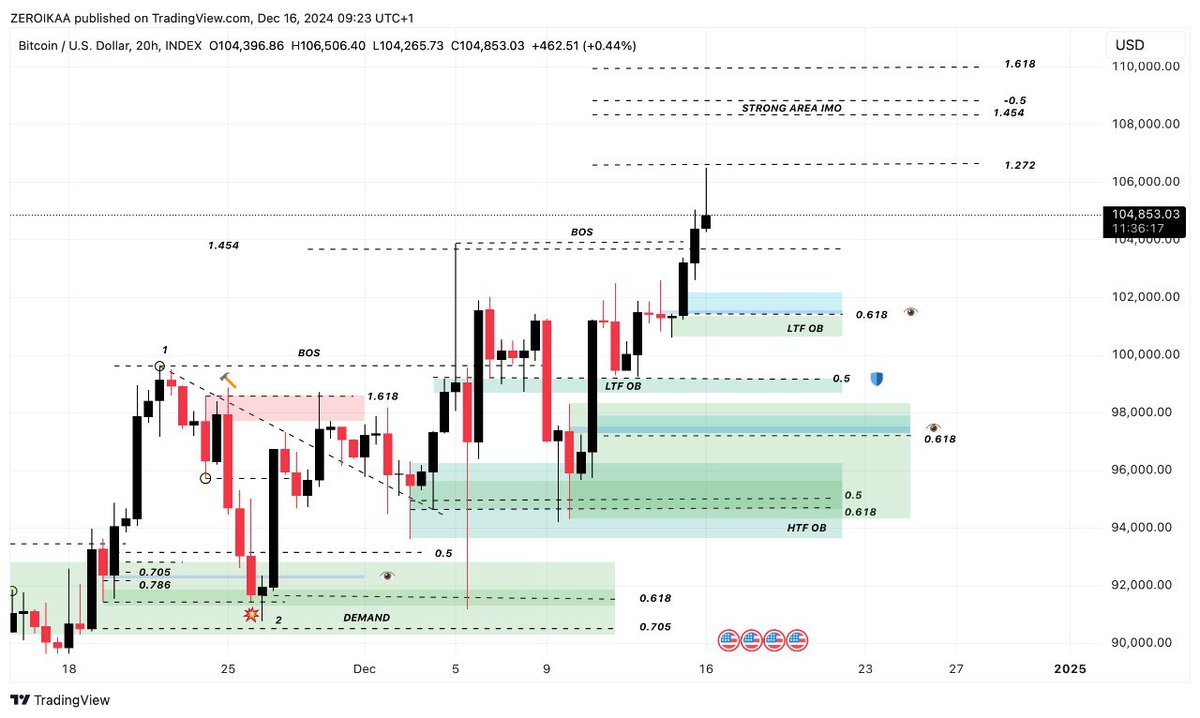
In late December we saw Bitcoin soaring to new highs and logically the common retail thinking was: "It's primed to soar till 150K, institutions buying our bags due to the ETF!"
However, on my charts I had my Fibonacci extension plotted with the 108K (108.200$ at 1.454):
And look at what happened next:
The price perfectly hit the 1.454 at 108.200$ starting to correct till 91K later. (not present in the chart)
So is this some sort of a magic?
Yes in a sense, but these numbers work because SM invest trillions every year to improve their trading algorithms in order to profit from the market and from retails' pockets.
Everything is manipulated.
Every single asset.
Maybe you weren’t perfect, but if you took profits when the warnings signs were there, entered positions at key liquidity on the way down. Maybe you had some losses after entering too soon… but if you overcame greed and took profits then overcame fear & bought lower at key levels… you should be proud of yourself.
You outperformed the majority who didn’t sell a dime and got stuck in euphoric greed. Now fully round-tripped or even worse at all time portfolio red.
I’m telling you right now, what you see on CX is completely bullshit. 99% are recovering from profit losses & didn’t even have enough liquidity to buy the “bottom” because they never took profits, at-least enough. Don’t ever compare yourself, especially those who are elite market participants & actually did act perfectly.
- Christmas Market Update (Bloody Santa Version) 🎅🩸-
Despair, fear, sadness... not exactly the typical emotions of a classic Christmas, are they?
Time for a mega "clarification" market update freshly offered, hope you'll enjoy it. (and that will calm your nerves)
The collapse we saw was nothing but something already anticipated at the beginning of August where I shared the most interesting levels to pay attention at: https://t.co/udXCulJ5aR
While the majority of people were bull-posting at the highs because of the "ETFs" or similar stories intended to make you FOMO, I was suggesting to proceed with caution because, together with the targets shared, AMT was pending as a Damocle's sword on the market's head: https://t.co/aLTmMo75sx
I also shared something extremely interesting in my channel, a fantastic short opportunity at 108.200 where I had the confluence coming from the -0.5 & the 1.454 Fib levels, in order to provide you more "sauce": https://t.co/AN1mEHlpU8
But let's now proceed with the real dish. (Covering altcoins, you know what I think about Bitcoin overall)
- TOTAL 2 -
In the last TOTAL 2 update we were seeing the capitalization hitting a multi 20H TF HOB suggesting to pay "semi-careful" because it could have provided a rejection targeting the 1.33T where we had the multi-week supply turned into a BB: https://t.co/9NNXn1FFSD
As you can see from this updated chart, the price has taken out the level dipping at 1.22T but we didn't have any HTF closure below this zone which is the crucial and essential part.
When such key levels get hit we have 2 potential outcomes:
- They provide an immediate powerful reaction
- They continue to "melt" liquidating positions just to provide a false sense so retails panic sell their positions nourishing the necessary liquidity for pushing the prices more
And is the second option that I'm taking into consideration as long as we don't close HTF below 1.22T that would likely mean ruining the whole structure and compromising further bullish impulse.
Now in my opinion the previous HOB is no longer valid (apart from the 20H that could provide a LTF rejection -> BB) so keep your eyes open on the 1.64T and on the previous ATH at 1.71T (previous highs are always "careful levels")
- BTC D-
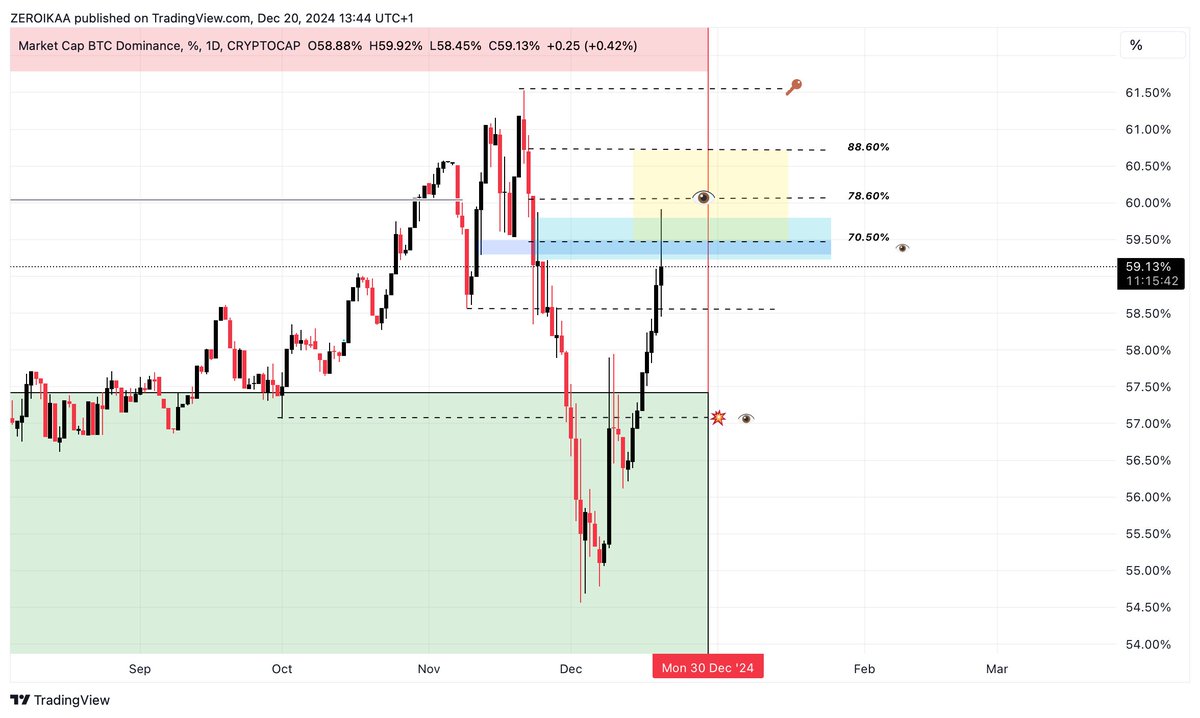
Many people have been pretty much "concerned" about the last BTC D. upside, but if I watch it from an analytical standpoint, nothing has changed.
We tapped into a 3D PHOB that matches the 70.50% Fib and wicked into my favorite "retracement box" (70.50% + 78.60% + 88.60%) so technically speaking this is a bearish retest.
I would start to be concerned exclusively if we close HTF above 61.53% but this isn't my primary case given all the considerations made in the past.
It's also absolutely interesting to notice the multiple confluences provided.
When BTC D hits this level, ETH touched both HTF liquidity areas shared here: https://t.co/mlM38seGbD and also TOTAL 2 hit the BB, very curious, isn't it?
- USDT D -
Last but not least, the USDT D.
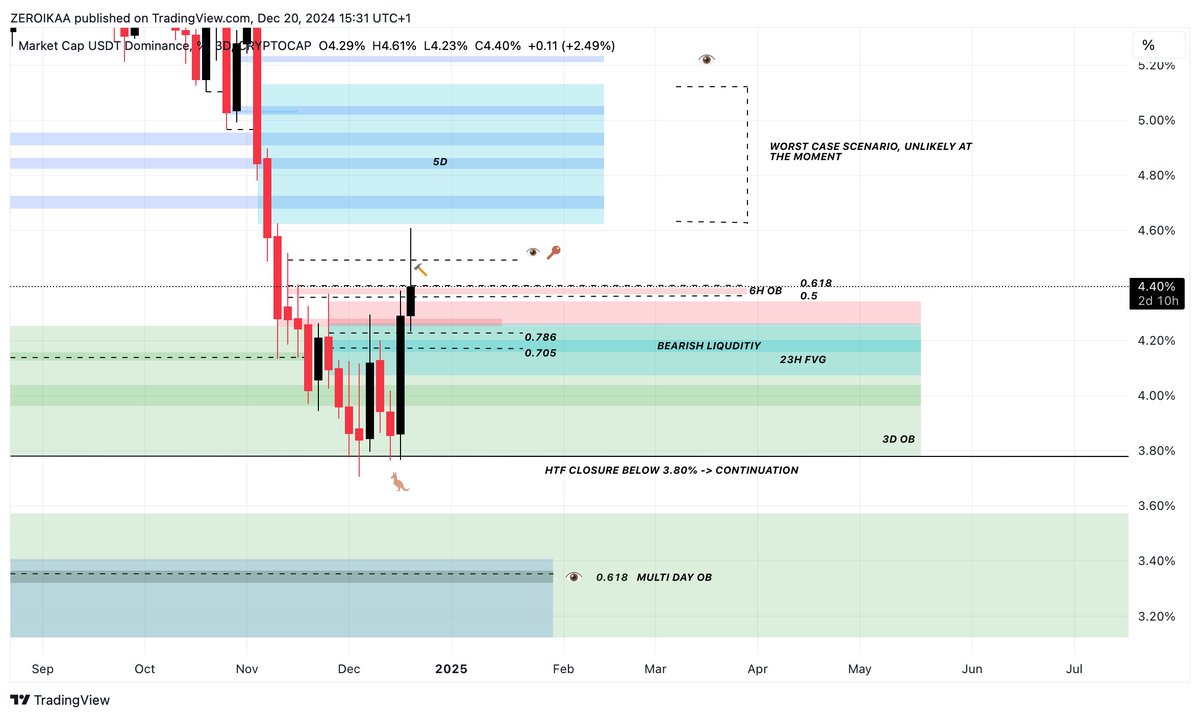
The metric has taken out the bearish liquidity at 4.20% (the one that ignited the pump till 108K) and then reversed back from 3.80%, as proof of the strength of the level.
My eyes after that touch were primarily on the 4.40% where we had that 6H OB + 0.618 & 0.5 Fib as main confluence for a potential reversal and while we have wicked above at the moment (4.61%) the important is to not close HTF above 4.52% in order to avoid a huge pick of liquidity into the 5D LB at 4.80%.
Not my main case at the moment.
Below we still have that 3.80% but we have already mitigated it multiple times contributing to make it weaker so if we will see new highs, that level will be broken, sending the USDT D at 3.30% (multi-day OB) and where we will see a powerful correction once again, likely.
- Final conclusion -
As I was bearish before, I'm trusting my plan and I'm accumulating + opening some longs on interesting altcoins that have reached their HTF liquidity levels.
To me, this is a shakeout in order to absorb the necessary liquidity before another push and I will treat it as such until proven otherwise.
Of course, I don't have the crystal ball and I will always re-adjust if something changes, but as posted yesterday, Kendrick Lamar might be right saying: "Now or Never".
Oh, and if you like my posts don't forget to press the repost and like buttons, they mean a lot for supporting my work.
Happy "Bloody Christmas" by SM.
Happy "Shopping" if you trust your plan.
My 4 Fibonacci settings: (fast recap)
👁️Complete (the setting I use the most):
1
0.236
0.382
0.5
0.618
0.705
0.786
0
1.272
1.454
1.618
👁️ Negative (the setting I use in confluence with the 1.272/1.454/1.618):
- 0.5
- 0.618
- 0.705
- 0.786
The -0.5 & -0.618 are pretty much aligned with the 1.454 & 1.618 -> extra confluence together.
👁️ OTE (Optimal trading entry, used with confluence coming from OBs/HOBs):
0
1
- 1
- 0.62
- 0.27
0.62
0.705
0.79
👁️ Percentages (the one I use for optimal retracement levels)
100%
88.60%
78.60%
70.50%
61.80%
50.00%
38.20%
23.60%
0%
Save each setting on your TV with these different names so you'll be able to quickly switch from one to another when you're charting.
Almost everything you need.
- Fibonacci levels / extra insights -
I want to spend a "few" words on this fantastic tool adding more thoughts on it.
Starting quickly with the basics, the primary function of this tool isn't so much to determine where the price might go (though that is a secondary objective), but rather to identify the most interesting zones for buying and selling.
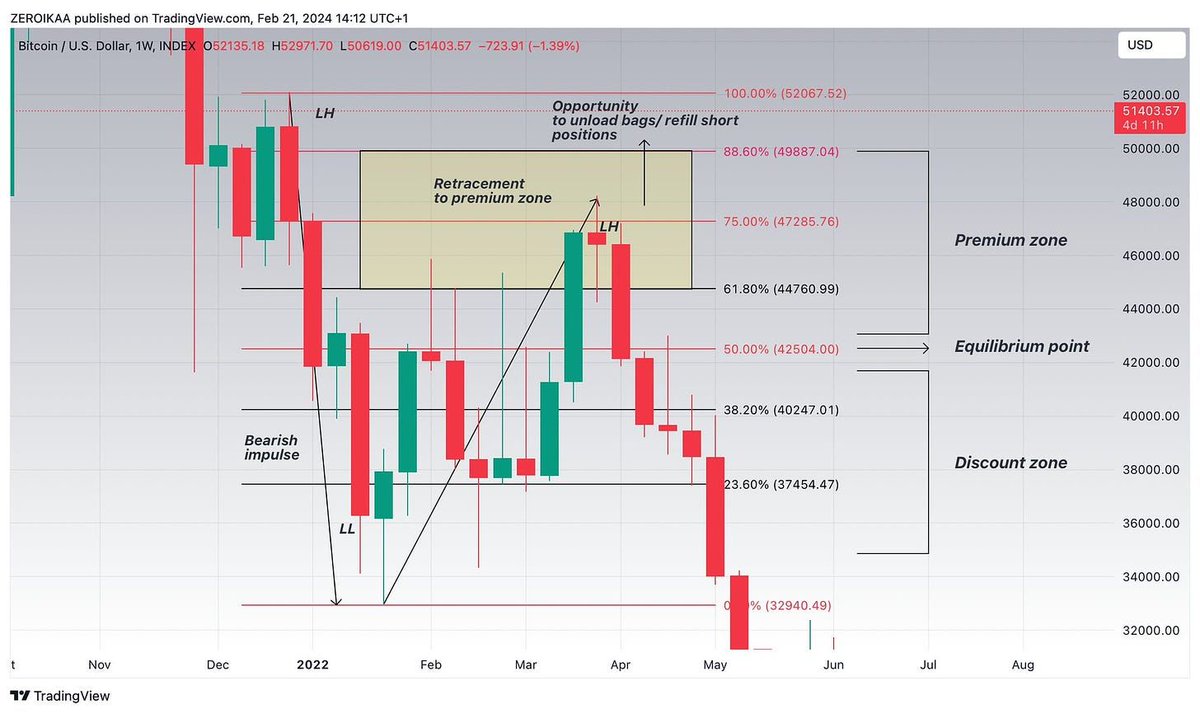
In this context, the key concept to understand is the division that emerges using Fibonacci levels: premium, equilibrium, and discount.
Essentially, for less experienced users:
- Below 0.5 Fibonacci -> Discount levels -> SM are more interested in buying.
- Above 0.5 Fibonacci -> Premium levels -> SM are more interested in selling.
- At 0.5 -> SM have less interest in buying or selling at an intermediate price.
This is an essential yet often overlooked aspect, and it's the reason why the majority of investors get caught off guard: they buy at premium levels and sell at discount levels, it's that simple.
However, I’m not here to repeat well-worn concepts, but rather to share my experience and provide an explanation of these numbers from an "operational" perspective.
Fib numbers:
- 0.236
- 0.382
- 0.5
- 0.618
- 0.786
- 0.705
The 0.236 and the 0.382 are the "weakest ones" and while they're present in the classic sequence, they usually don't offer significant pullback areas where to put your eyes on, that's why I rarely use them as confluence.
The 0.5 is the equilibrium and while many people put their attention to other levels, there's a reason why this is called "equilibrium", and is because it represents the midpoint of a price move, (50%) acting as a balance point between buying and selling forces in the market.
Do not underestimate this level, it is one of the most important numbers of the sequence, if not the most important.
The 0.618 instead is one of the most "looked" ones because of the GP but this doesn't make it less reliable and constitutes a solid fib level.
The 0.786 is the "deep retracement" based on the fact that the price has retraced 78.6% of the initial move, representing the "final chance" for the trend to hold before reversal.
Between these 2, there's the 0.705 which is pretty uncommon and, at the same time, interesting.
The 0.705 Fib level is in fact called "algorithmic fib" as most institutional traders and HFT algorithms set entries and exits based on this number often front-running those who wait for the 0.618 or the 0.786, that's why is highly sensitive to price action. (Chris Lori perfectly explains it if you're interested)
Remember that Fibonacci levels alone matter but they don't matter at the same time.
If they don't match significant liquidity areas is not very wise to long/short exclusively depending on the "raw number", otherwise everyone would be rich, don't you think?
Use Fib numbers as confluence: no confluence, no valid trade.
👁️Extra:
When I look for retracements, I have a "personal box preference" with these settings: (88.60/75/61.80).
This is an extra setup that often helps me to individuate an "ideal zone" on pullbacks as you can see from the example above.
- Targets in an uptrend -
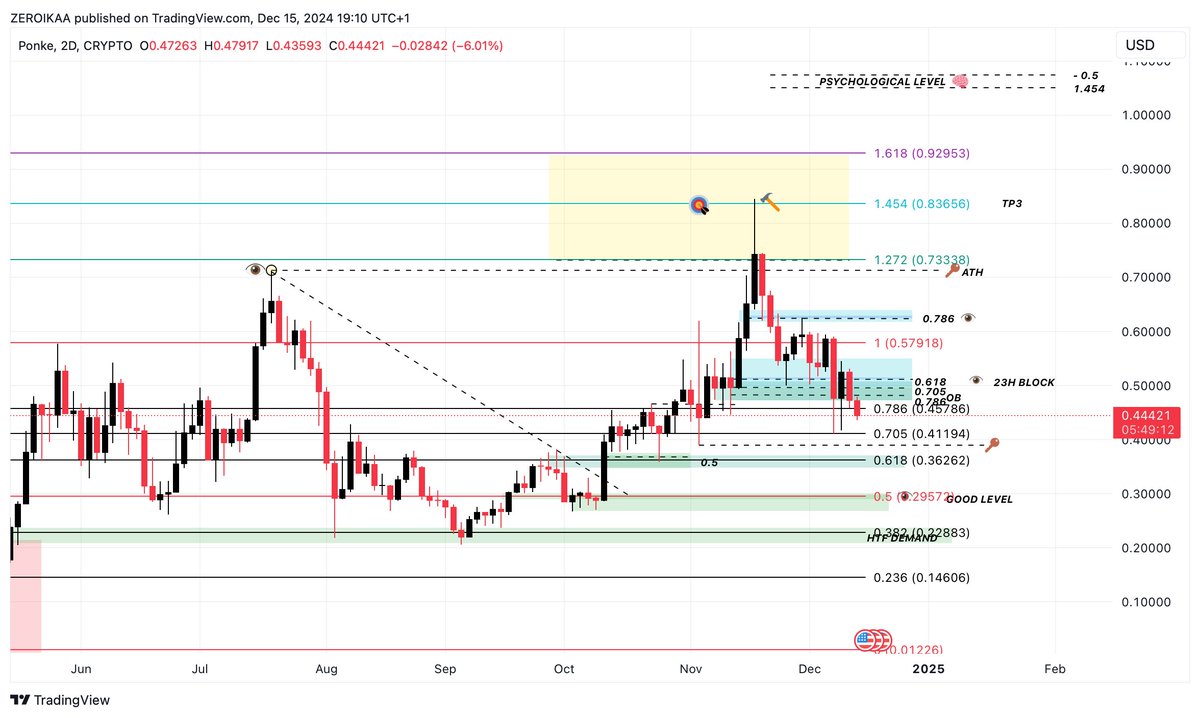
When the price goes into price discovery or when I have to calculate macro targets I utilize a blend of Fib levels that you probably already saw me sharing: 1.272 + 1.454 + 1.618.
This is a combination I studied during these years and that helped me a lot spotting local tops.
Here's an example where I used it for calculating the local top on PONKE in late November and where you can clearly see a powerful rejection and downtrend from that area:
This applies even for retracements in a downtrend and you'll notice over time and by implementing it how powerful this zone can be, especially if aligned with liquidity areas.
At the same time, by applying this method, you'll be able to see what most still don't understand: how much prices work on math and numbers as they're pushed by algorithms and not by fundamentals.
Wicks that extend toward accurate Fib numbers will truly open your eyes on this world.
To add more confluence, these settings match the negative Fibonacci sequence, therefore making it even more reliable.
The more confluences you add to the recipe, the more the dish will be tastier.
This is a compounding game and very few understand it.
It shouldn't be treated as "I need to find the next 20/50x."
The true power lies in the ability to grow wealth exponentially over time.
Compounding happens when returns are reinvested, allowing both the original capital and the gains to generate further returns.
This process transforms steady, incremental growth into significant wealth over the long term.
The beauty of compounding is in its cumulative effect.
Whether it’s reinvesting money from business or profits from trading, the continuous reinvestment allows your money to work for you.
The longer the timeline, the more impactful the growth becomes.
For instance, a modest 10% annual return might not seem amazing in one year, but over 20 or 30 years, the exponential growth can and is life-changing, and we don't have to forget that in crypto you can cut this timeline drastically as volatility is severely increased.
In trading, the concept applies similarly.
Small, consistent gains, when compounded, can lead to extraordinary results.
A trader who achieves a 1% gain per week can see a significant annual return thanks to compounding.
The key to making this work is managing risk and avoiding large losses, which is something that people in this space are unable to understand.
"It didn't reach this target yet, ain't gonna sell anytime soon"
This is one of the statements that ruins 90% of people's journeys.
Losses can disrupt the compounding process by reducing the capital base needed to generate future returns and this expands the timespan you need, boosting your frustration.
This game rewards patience and discipline.
While the allure of quick profits might tempt retails the real power lies in steady, repeatable success.
The compounding game is not about chasing the highest returns in a single trade or investment but about building a strategy that prioritizes growth and capital preservation over time.
The compounding effect amplifies small victories into transformative results, making it one of the most powerful forces in wealth creation.
Everything is manipulated.
- Media & communication: news, journalism, advertising, social media algorithms etc
- Politics & governance: public opinion and propaganda, election campaigning, policy framing etc
- Finance & economics: stock market, crypto, other legacy markets
- Education: school system (shaping young minds to align with specific ideologies)
- Healthcare & pharma: drug marketing, public health campaigns
- Technology: AI & algorithms, data privacy, cybersecurity
- Entertainment: movies, music, gaming etc
The sooner you understand we live in a full matrix, the sooner you understand how to escape from it.
There are no conspiracy theories, only truths that few want to hear.
SMC + Wyckoff schematics.
Your passe-partout for financial freedom.
No fundamental analysis required.
No need to follow “gem hunters” or “narratives”.
The most difficult and easy path at the same time.
Learn -> implement -> succeed.
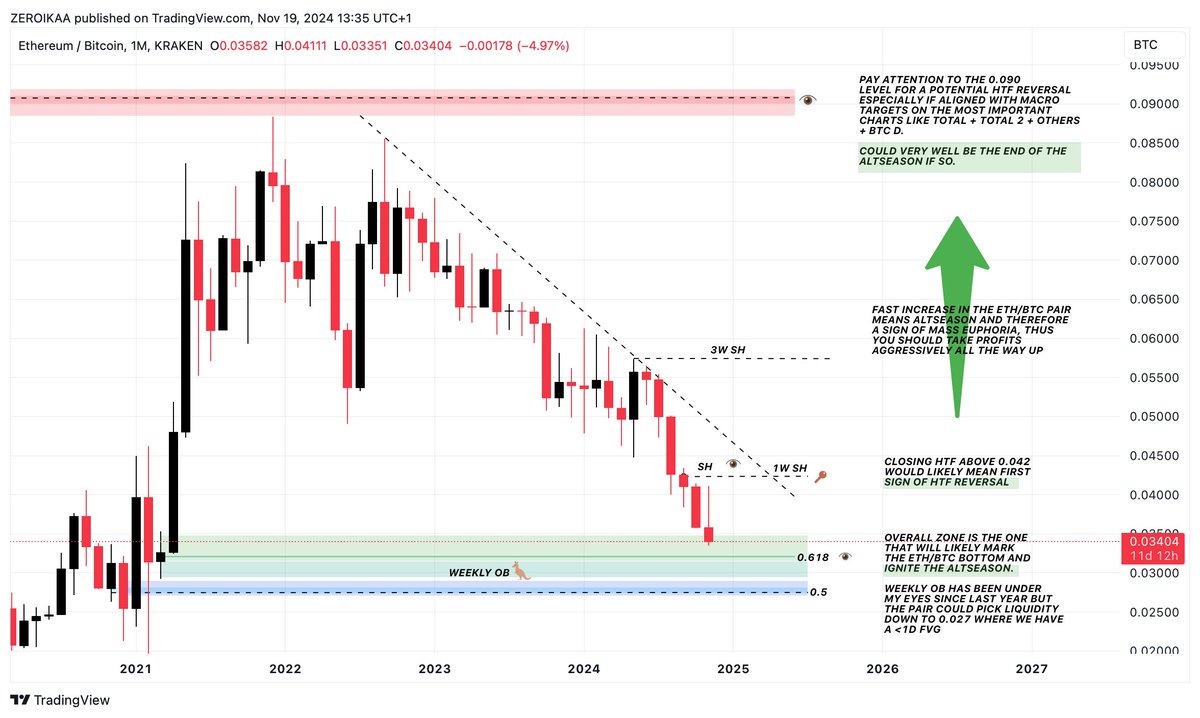
ETH/BTC considerations & target: 👁️
This is the final update on the pair, part of the plan shared on the 26th of June that you find here -> https://t.co/DgEoGEfoWC
This pair is directly tied to the altseason, so a very hot and crucial topic if you're holding altcoins.
All details in the chart.
A few considerations that might help you for the next period:
I'm seeing plenty of people trying to short every parabolic move made by different coins because it's highly tempting during this period but I think you're losing the compass.
While shorting assets especially when they reach significant HTF supply levels/OBs/untested FVGs might be very rewarding (if you have a plan/experience/solid risk management) the posture of the market is bullish.
This means that your primary strategy should be focused on waiting for pullbacks toward significant 💧areas to compound by setting limit orders (some zones get fastly eaten without giving you the time to manually buy) + holding some cash in case HTF OBs get touched and mitigated before the next impulsive move.
Some will react better, some others will not depending on their TFs and related mitigations but if you have a proper understanding of how they work in general this will turn probabilities in your favor instead of relying on hope, which of course doesn't fit with financial markets and often leads to 🩸
Some OBs might even never get touched during parabolic uptrends giving no space for consistent pullbacks that allow traders to enter positions so..what to do?
Referring back to the previous discussion of compounding, once an impulse is being created, it leaves huge imbalances behind it: look for pullbacks toward those areas helping yourself with the use of Fibonacci calculated on HTF swings.
Pullbacks above equilibrium in a bull market very often works well considering the aggressiveness of buyers, especially if there are no areas where to look for adding with limit orders.
Utilize macro Fibs as point of reference, go deeper with HTF swings to have more confirmations of your thesis.
During a price discovery on your asset, don't blindly hold "to the 🌙" or "based on fundamentals" but use the above mentioned swings to calculate potential targets with Fib levels.
Extensions? Negative?
Use both to have a stronger idea of your TP targets and wait for at least a D closure above/below those SHs/SLs to assess continuation on a side or another.
Don't fade potential bearish HTF closures waiting for the price to go up just because you hope for a Lamborghini as you're likely gonna have a Fiat Panda in the end.
Better to be happy with your a** on a Volkswagen.
These are a few tips among a sea of information but implementing them will likely boost your journey 10x rather than taking empty promises left and right here on X.
Prepare yourself to extract consistent profits and to reverse the next bear market into another bull market.
👁️
One of the main reasons most crypto investors don’t feel the need to use stop-losses is because they don’t have significant size on their positions. If they did, watching six or seven figures vanish from a single bag would be painful. They’re fine with the loss as long as they can keep their day job.
After all, what’s -$500 right? But now imagine -$500K just because you didn’t take the time to make a proper plan for the investment.
This is precisely why so many people remain in the space even after being completely wrecked by poor investment choices. They’ve reached a point where venting their frustration becomes the focus, often targeting the most successful players. It’s like the saying goes: "People want to see you do well, but never better than them"
There are entirely different leagues in this space, and while everyone has a voice, fair in terms of free speech, it’s absurd when small players feel entitled to call out or try to school those operating at much higher levels.
Every so often, I see a bigger player miss a forecast and get hit with a wave of hate from people whose entire portfolios barely match half of a single position of that bigger player - people who toss $50 into several random shi*coins.
Either be quiet, learn from those ahead, or stay trapped in narcissism, learn nothing, and remain a slave to the game.
This post is IMO one of the very most important ones if you want to improve your trading. This concept has helped me a lot to accelerate my journey:
When analyzing price action (PA), relying on a single indicator rarely provides enough insight to predict future movements or key levels of interest. Instead, you’ll want to look for multiple factors that align—a series of “confluences” coming from different analytical angles. The more confluences that support your thesis, the stronger that thesis becomes.
Here are some factors that, when combined, can build a powerful case:
**Market Structure**
Identifying the trend direction is crucial—targets are more likely to the upside in an uptrend, and vice versa. Look at key highs and lows to understand how the market structure is forming‘and consider different timeframes!
**Fibonacci Retracement Levels**
Levels like 0.5, 0.618, 0.705, and 0.786 are especially strong indicators and can serve as zones of interest.
**Fair Value Gaps (FVGs) and Imbalances**
These areas highlight where buyers or sellers held a dominant advantage, leaving liquidity behind.
**Breaker Blocks**
These represent interruptions in a trend—an initial shift in direction before resuming the original trend.
**Order Blocks**
Order blocks mark zones where significant buying or selling demand led to a notable change in market structure.
**Hidden Liquidity**
Among the most challenging to identify, hidden liquidity can often be found at levels where multiple criteria align. For instance, a historical breaker block overlapping with FVG areas and close to a 0.618 Fibonacci level may hold hidden liquidity.
**Multiple Timeframes**
If a level is significant across multiple timeframes, it can reinforce your thesis.
**Fundamental Data**
Metrics like Open Interest, Funding Rates or Cumulative Volume Delta (CVD) on perps and spot can offer additional insights for potential movement.
**News**
When news with an anticipated positive or negative impact is expected, price action often “front-runs” the outcome, potentially reversing after the news is released.
If you combine all of those you should have a very solid framework to build your decisions on.
Obviously these concepts only work for higher liquidity coins. The less volume there is on a coin the more erratic PA will be and much of those things won’t have much meaning.
Just to give some credit - I didn’t start from zero in my journey, these are some people I learned a lot from:
@IamZeroIka@Moneytaur_@i_am_jackis@venture_charts
and many others I for sure forgot right now.
- Creating a trading plan -
One of the most underrated practices in trading is the creation of a trading plan.
Since many people have told me, "I have no idea how to do it," I decided to provide you with a guideline by creating one so that you can use it as a reference to build your own.
A good trading plan is divided into 4 parts and is structured as follows:
5 tips for those who want to approach trading that have helped me over the years:
👁️Never risk more than 1/3% on a trade
The rule I've set for myself, regardless of the probability of success of any given trade, is to never invest more than 1/3% of my capital.
This allows for optimal risk management, making it easier to handle potential losses without jeopardizing years of accumulated capital.
At the same time, a smaller position size allows for exposure to higher leverage on a single trade, potentially yielding higher returns.
👁️Don’t open more than 5 trades at a time
This is a personal rule, and it may not work for everyone, but I find it much easier to manage when I have no more than 5 trades open simultaneously.
This allows me to monitor each trade closely and make adjustments if necessary.
I see many people holding 20 or more open orders, but I find this creates confusion and exposes them to unjustified risk because there’s a belief that more trades equal more potential profits, which, 90% of the time, is a misconception driven by social media.
👁️Use fewer devices and spend time more constructively
Another trap fueled by social media is the image of “day-traders” sitting in front of 15 monitors for most of the day.
This is highly counterproductive, both technically (one computer and a piece of paper for a trading journal are more than enough) and mentally.
The more time you spend staring at charts, the more your brain becomes overloaded.
👁️Find a good setup and wait, otherwise... wait
The core of the work lies in analyzing a chart, finding a setup with the highest probability of unfolding, placing the order, and simply waiting.
It can take days, weeks, or even months for a favorable setup to appear, but it’s crucial not to chase prices.
Instead, let them reach the level you’ve predetermined.
Those who lose in the market are the ones who chase, not the ones who attract.
Patience is the most powerful and most challenging skill to master.
👁️Work on yourself
It may sound trivial, but it’s impossible to become profitable in the market without working on yourself and managing your emotions.
Anger over a lost trade shouldn't be an excuse for feeling down.
Happiness over a winning trade shouldn't prompt us to immediately chase another one.
If we're angry or distracted, the likelihood of a trade going wrong increases because our minds aren’t clear.
Your mind should be free of distractions, and your heart must remain calm.
Exercising, eating well, and being at peace with yourself are factors that have helped and, in my experience, make a significant difference.
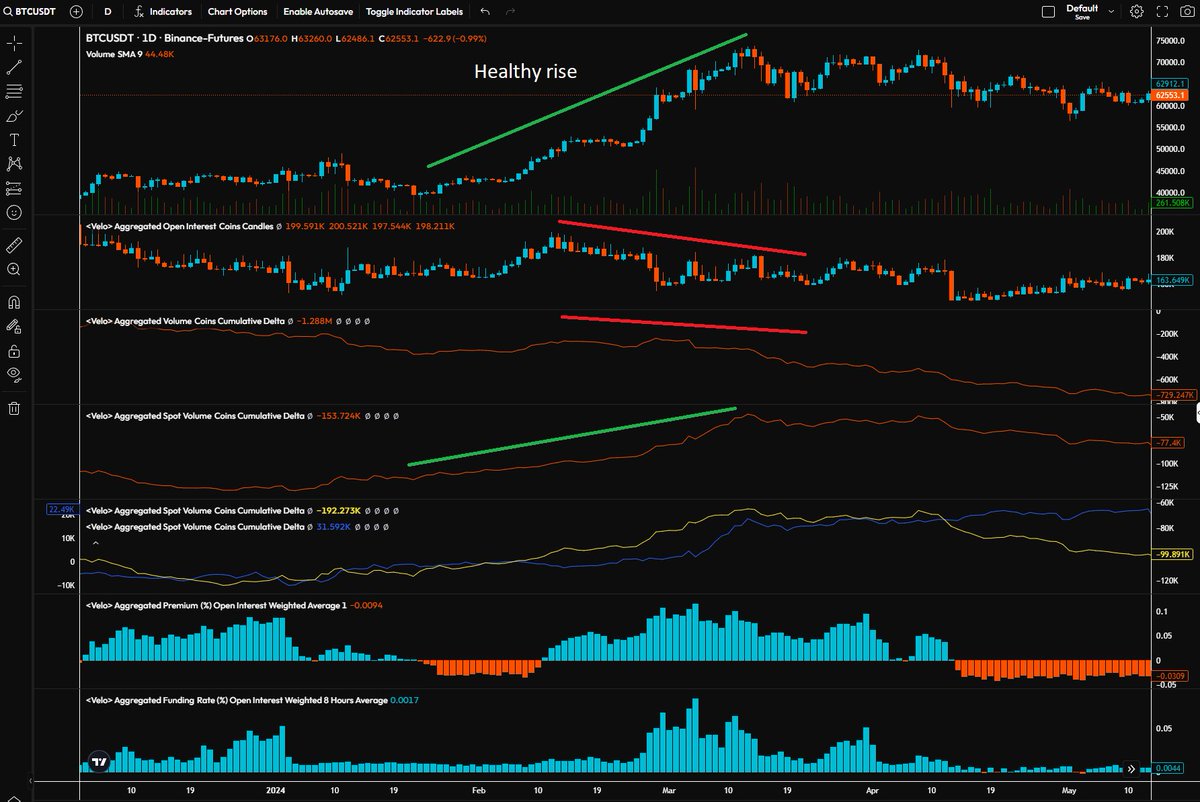
Why have I been referring to the current rise as being „unhealthy“?
1) Open Interest
Open Interest (OI) tells you the total number of outstanding or open contracts (positions) in the market, it basically refers to the number of not closed futures positions.
If this number is very high this can be a sign that soon there might be volatile moves coming in (flushes) to liquidate longs and shorts in the future market.
Right now OI is very high on $BTC, above 180k is heated area.
2) Funding Rate
The funding rate is a periodic payment made between long and short traders in the futures market.
When the funding rate is positive longs pay shorts and more longs than shorts are in the market.
If the funding rate is negative shorts pay longs and there are more shorts than longs in the market.
Right now funding rate is positive on $BTC, indicating there are more longs than shorts in the market.
Often a high funding rate compared with high OI is followed by a retrace that resets OI and makes funding rate go down.
In this retrace longs are either liquidated / forced to close positions or they run in stop losses (SLs).
3) Spot Volume vs futures volume
A high future volume and low spot volume indicates "unhealthy" market conditions. Ideally sustainable uptrends should be pushed by spot bidders.
When looking at this data since the local low at 58.9k one can clearly see that:
- Price went up
- OI went up
- Cumulative Volume Delta on perps (Perp CVD) went up
- Cumulative Volume Delta on spot (Spot CVD) went down
Translated this means:
This last move up from the lows is - once more - perp driven (by future longs mainly). while spot CVD shrinking gives a clue to spot rather selling than bidding.
This is why I related to this move as being unhealthy.
See pics - you can see what differentiates a healthy from an unhealthy rise.
One note still to this - I'm not sure yet myself why but the total numbers on this fundamental data isn't what really counts - they can be misleading.
What counts is HOW the graphs move (downtrend or uptrend) during phases of uptrending PA to make the differentiation.
Does this mean we can’t break out now?
No, we can! And I hold lots of spot to cover that scenario.
But I will also hedge short the mentioned $BTC key level around 68.5k and have stables ready in case this rally should fail again.
This kind of content (and deeper) is usually published on my DC, but I thought I‘d share now as people need to understand where I‘m coming from.
All of this has nothing to do with what I want. I want this market just to moon ;)
I’m also long since below 60k and it’s still open.
[ Trading Basics ] ( for beginners )
>If you are starting a trading journey its extremely important to understand the basics of ICT ( inner circle trader )
🟣What is ICT?
>Inner Circle Trader (ICT) is simply a trading approach that focuses on understanding the underlying 'system' of financial markets
>particularly how institutional traders or 'smart money' operates
>ICT emphasises the study of
🟣price action
🟣market structure
🟣liquidity
🟣manipulation tactics used by whales or elites
>it aims to equip traders with the knowledge to anticipate market movements by recognising patterns and behaviours that are overlooked by traditional trading strategies :-O
Origins of ICT
>Michael J. Huddleston began sharing his trading insights and methodologies through online forums, webinars, and mentorship programs
>He introduced unique concepts and terminologies that delve into the intricacies of market dynamics, challenging conventional trading wisdom.
>His teachings focus on the idea that markets are manipulated by larger entities to create liquidity, trap retail traders, and move prices to predetermined levels.
---------------
☠️
Even if you arent trading atm but want to in the future, save this for later. If you are just starting out my advice is to go through each of these ICT's and watch videos on youtube as examples
Once you are familiar you should begin to implement them into your own charting where applicable, this is a lengthy process do not give up so early
Set small goals and targets to achieve slowly over time, refer to MT charts and it will begin to unfold
Link to Original Post:
https://t.co/LAqMiCAfI6
----------------
🟣 BB: Breaker Block
Explanation:
>A Breaker Block is a price zone where the market breaks through a previous support or resistance level and then retests it before continuing in the original direction.
Usage:
>Traders use Breaker Blocks to identify potential reversal or continuation points. When the price revisits this zone, it may present an opportunity to enter a trade in the direction of the original break.
----------------
🟣 BE: Break Even
Explanation:
>Breaking even means a trade results in neither a profit nor a loss; the exit price equals the entry price.
Usage:
>Traders move their stop-loss to the entry price once the trade is in profit to eliminate risk, ensuring they don't lose money on that trade.
----------------
🟣 BOMS: Break of Market Structure
Explanation:
>A significant change in the market's trend, indicating a potential reversal.
Usage:
>Traders watch for BOMS to identify when the market shifts from bullish to bearish or vice versa, helping them adjust their strategies accordingly.
----------------
🟣 BOS: Break of Structure
Explanation:
>Occurs when the price breaks through a key support or resistance level, indicating a possible trend change.
Scenario:
>Used to confirm that a new trend may be starting, prompting traders to enter or exit positions.
----------------
🟣 BSL: Buy Side Liquidity
Explanation:
>Areas in the market where buy orders are clustered, often above recent highs.
Scenario:
>Traders anticipate that the price may move toward these areas to trigger buy orders or stop-losses placed by other traders.
----------------
🟣 EQH: Equal Highs
Explanation:
>When the market reaches the same high price level multiple times.
Scenario:
>Seen as a resistance level and a liquidity zone where traders might place stop-loss orders, attracting market moves toward this level.
----------------
🟣 EQL: Equal Lows
Explanation:
>When the market reaches the same low price level multiple times.
Usage:
>Acts as a support level and a liquidity zone for potential buy entries or stop-loss triggers.
----------------
🟣 FVG: Fair Value Gap*
Explanation:
>A gap on the price chart where little to no trading has occurred, often due to rapid price movements.
Usage:
>Traders expect the price to retrace to these gaps to "fill" them, providing trading opportunities.
----------------
🟣 HTF: High Time Frame*
Explanation:
>Refers to longer-term charts like daily, weekly, or monthly charts.
Usage:
>Used to identify the overall market trend and significant support or resistance levels.
----------------
🟣 LTF: Low Time Frame*
Explanation:
>Short-term charts such as 1-minute, 5-minute, or 15-minute charts.
Usage:
>Utilised for precise entry and exit points, especially in day trading or scalping strategies.
----------------
🟣 MS: Market Structure
Explanation:
>The pattern of highs and lows in the market that defines the current trend.
Usage:
>Traders analyse market structure to determine whether the market is trending upwards, downwards, or moving sideways.
----------------
🟣 MTF: Medium Time Frame
Explanation:
>Charts that are between high and low time frames, like 1-hour or 4-hour charts.
Usage:
>Provides a balance between the broader trend and short-term price action for informed trading decisions.
----------------
🟣MTF': Micro Time Frame
Explanation:
>Extremely short time frames, potentially seconds or tick charts.
Usage:
>Used by scalpers who aim to profit from tiny price movements.
----------------
🟣 OB: Order Block*
Explanation:
>A consolidation area where large institutional orders are placed, acting as significant support or resistance.
Usage:
>Traders look for order blocks to anticipate where big market players might influence price movements.
----------------
🟣 PA: Price Action
Explanation:
>The movement of price plotted over time.
Usage:
>Traders analyse patterns and formations in price action to make trading decisions without relying on indicators.
----------------
🟣 PSH: Previous Swing High
Explanation:
>The last significant high point before a downward move.
Usage:
>Used as potential resistance or a target for taking profits.
----------------
🟣PSL: Previous Swing Low
Explanation:
>The last significant low point before an upward move.
Usage:
>Acts as potential support or an entry point for buying.
----------------
🟣RH: Range High
Explanation:
>The highest price level within a trading range.
Usage:
>Traders may sell near the range high expecting the price to move back down within the range.
----------------
🟣RL: Range Low
Explanation:
>The lowest price level within a trading range.
Usage:
>Traders may buy near the range low expecting the price to rise within the range.
----------------
🟣RR: Risk/Reward
Explanation:
>The ratio comparing potential profit to potential loss in a trade.
Usage:
>Helps traders assess whether a trade is worth taking based on potential returns versus risk.
----------------
🟣SOW: Signs of Weakness
Explanation:
>Indications that the current upward trend may be losing momentum.
Usage:
>Traders look for SOW to prepare for possible trend reversals or to tighten stop-losses.
----------------
🟣SOS: Signs of Strength
Explanation:
>Indications that the current downward trend may be gaining upward momentum.
Usage:
>Traders look for SOS to enter long positions or hold existing ones.
----------------
🟣SL: Stop-loss
Explanation:
>An order to close a trade at a predetermined price to limit potential losses.
Usage:
>A crucial risk management tool to protect trading capital.
----------------
🟣 SLH: Stop-loss Hunting*
Explanation:
>When the price moves to trigger stop-loss orders before reversing direction.
Usage:
>Traders may place stop-losses strategically to avoid common stop-hunting zones.
----------------
🟣SSL: Sell Side Liquidity
Explanation:
>Areas where sell orders are clustered, often below recent lows.
Usage:
>Price may move toward these areas to trigger sell orders or stop-losses.
----------------
🟣TL: Trendline
Explanation:
>A line drawn over pivot highs or under pivot lows to show the prevailing direction of price.
Usage:
>Helps traders identify the trend and potential support or resistance levels.
----------------
🟣TP: Take-Profit
Explanation:
>An order to close a trade at a predetermined profit level.
Usage:
>Automatically locks in profits when the price reaches the desired level.
----------------
♨️ Bearish Reversal Pressure Expected
Explanation:
>Indicates levels where significant bearish (downward) pressure is anticipated, suggesting a potential reversal from an uptrend to a downtrend.
Usage:
>Traders watch these levels for potential sell opportunities. The larger the emoji, the higher the probability of a reversal.
----------------
🗝️ Bullish Reversal Pressure Expected
Explanation:
>Indicates levels where significant bullish (upward) pressure is anticipated, suggesting a potential reversal from a downtrend to an uptrend.
Usage:
>Traders watch these levels for potential buy opportunities. The larger the emoji, the higher the probability of a reversal.
----------------
Monitoring Bitcoin and Ethereum on Medium Time Frames (MTF)
Concept:
>Use Bitcoin and Ethereum's price behaviour on medium time frames as an additional confirmation for trading decisions.
Explanation:
>Observing how these major cryptocurrencies behave can provide insights into the overall market sentiment. If they show signs of strength or weakness, it can validate your trading ideas.
----------------
Invalidation of Levels with High Time Frame (HTF) Market Structure Changes.
Concept:
>Trading levels can become invalid if there's a change in the market structure on higher time frames.
Explanation:
>A significant shift in the long-term trend can override previous analyses. Always be aware of the overarching market direction.
----------------
Focus on High Time Frame (HTF) Opportunities
>HTF trades are generally more reliable and less risky. They provide stronger signals and are less susceptible to market noise.
----------------
Risk of Short-Term Trades
>Learn from short-term examples but prioritise long-term trades for better consistency.
----------------
Understanding Bitcoin Volatility (BVOL24H)
>High volatility in Bitcoin often occurs when the 24-hour Bitcoin Volatility Index (BVOL24H) is at support levels.
>Monitoring the BVOL24H can help anticipate periods of significant price movements, allowing for better timing of trades.
----------------
🔑 Takeaways for Beginners
>Focus on High Time Frames: They provide more reliable signals and reduce the impact of market noise.
>Understand Market Structure: Recognising shifts in trends is crucial for making informed trading decisions.
>Use Multiple Confirmations: Combine observations from Bitcoin and Ethereum with other indicators for stronger trade setups.
>Plan Ahead: Anticipate future price movements and set alerts to be prepared when opportunities arise.
>Risk Management Is Essential: Always use stop-losses and consider the risk/reward ratio before entering a trade.
>Avoid Emotional Trading: Stick to your trading plan and avoid chasing the market.
>Continuous Learning: Trading involves constant learning and adaptation. Keep studying market behaviours and refining your strategies. - dont give up just because you dont immediately understand something - put in the effort
If you arent sure where to start, this is a very very good place besides getting your head around tradingview and exchanges etc
>if you dont understand something, become resourceful
>type it in to youtube
>ask a mentore
>build a network of like minded people that can work together to learn and decode everything
its much much faster













![tombxbt's tweet photo. [ Trading Basics ] ( for beginners )
>If you are starting a trading journey its extremely important to understand the basics of ICT ( inner circle trader )
🟣What is ICT?
>Inner Circle Trader (ICT) is simply a trading approach that focuses on understanding the underlying 'system' of financial markets
>particularly how institutional traders or 'smart money' operates
>ICT emphasises the study of
🟣price action
🟣market structure
🟣liquidity
🟣manipulation tactics used by whales or elites
>it aims to equip traders with the knowledge to anticipate market movements by recognising patterns and behaviours that are overlooked by traditional trading strategies :-O
Origins of ICT
>Michael J. Huddleston began sharing his trading insights and methodologies through online forums, webinars, and mentorship programs
>He introduced unique concepts and terminologies that delve into the intricacies of market dynamics, challenging conventional trading wisdom.
>His teachings focus on the idea that markets are manipulated by larger entities to create liquidity, trap retail traders, and move prices to predetermined levels.
---------------
☠️
Even if you arent trading atm but want to in the future, save this for later. If you are just starting out my advice is to go through each of these ICT's and watch videos on youtube as examples
Once you are familiar you should begin to implement them into your own charting where applicable, this is a lengthy process do not give up so early
Set small goals and targets to achieve slowly over time, refer to MT charts and it will begin to unfold
Link to Original Post:
https://t.co/LAqMiCAfI6
----------------
🟣 BB: Breaker Block
Explanation:
>A Breaker Block is a price zone where the market breaks through a previous support or resistance level and then retests it before continuing in the original direction.
Usage:
>Traders use Breaker Blocks to identify potential reversal or continuation points. When the price revisits this zone, it may present an opportunity to enter a trade in the direction of the original break.
----------------
🟣 BE: Break Even
Explanation:
>Breaking even means a trade results in neither a profit nor a loss; the exit price equals the entry price.
Usage:
>Traders move their stop-loss to the entry price once the trade is in profit to eliminate risk, ensuring they don't lose money on that trade.
----------------
🟣 BOMS: Break of Market Structure
Explanation:
>A significant change in the market's trend, indicating a potential reversal.
Usage:
>Traders watch for BOMS to identify when the market shifts from bullish to bearish or vice versa, helping them adjust their strategies accordingly.
----------------
🟣 BOS: Break of Structure
Explanation:
>Occurs when the price breaks through a key support or resistance level, indicating a possible trend change.
Scenario:
>Used to confirm that a new trend may be starting, prompting traders to enter or exit positions.
----------------
🟣 BSL: Buy Side Liquidity
Explanation:
>Areas in the market where buy orders are clustered, often above recent highs.
Scenario:
>Traders anticipate that the price may move toward these areas to trigger buy orders or stop-losses placed by other traders.
----------------
🟣 EQH: Equal Highs
Explanation:
>When the market reaches the same high price level multiple times.
Scenario:
>Seen as a resistance level and a liquidity zone where traders might place stop-loss orders, attracting market moves toward this level.
----------------
🟣 EQL: Equal Lows
Explanation:
>When the market reaches the same low price level multiple times.
Usage:
>Acts as a support level and a liquidity zone for potential buy entries or stop-loss triggers.
----------------
🟣 FVG: Fair Value Gap*
Explanation:
>A gap on the price chart where little to no trading has occurred, often due to rapid price movements.
Usage:
>Traders expect the price to retrace to these gaps to "fill" them, providing trading opportunities.
----------------
🟣 HTF: High Time Frame*
Explanation:
>Refers to longer-term charts like daily, weekly, or monthly charts.
Usage:
>Used to identify the overall market trend and significant support or resistance levels.
----------------
🟣 LTF: Low Time Frame*
Explanation:
>Short-term charts such as 1-minute, 5-minute, or 15-minute charts.
Usage:
>Utilised for precise entry and exit points, especially in day trading or scalping strategies.
----------------
🟣 MS: Market Structure
Explanation:
>The pattern of highs and lows in the market that defines the current trend.
Usage:
>Traders analyse market structure to determine whether the market is trending upwards, downwards, or moving sideways.
----------------
🟣 MTF: Medium Time Frame
Explanation:
>Charts that are between high and low time frames, like 1-hour or 4-hour charts.
Usage:
>Provides a balance between the broader trend and short-term price action for informed trading decisions.
----------------
🟣MTF': Micro Time Frame
Explanation:
>Extremely short time frames, potentially seconds or tick charts.
Usage:
>Used by scalpers who aim to profit from tiny price movements.
----------------
🟣 OB: Order Block*
Explanation:
>A consolidation area where large institutional orders are placed, acting as significant support or resistance.
Usage:
>Traders look for order blocks to anticipate where big market players might influence price movements.
----------------
🟣 PA: Price Action
Explanation:
>The movement of price plotted over time.
Usage:
>Traders analyse patterns and formations in price action to make trading decisions without relying on indicators.
----------------
🟣 PSH: Previous Swing High
Explanation:
>The last significant high point before a downward move.
Usage:
>Used as potential resistance or a target for taking profits.
----------------
🟣PSL: Previous Swing Low
Explanation:
>The last significant low point before an upward move.
Usage:
>Acts as potential support or an entry point for buying.
----------------
🟣RH: Range High
Explanation:
>The highest price level within a trading range.
Usage:
>Traders may sell near the range high expecting the price to move back down within the range.
----------------
🟣RL: Range Low
Explanation:
>The lowest price level within a trading range.
Usage:
>Traders may buy near the range low expecting the price to rise within the range.
----------------
🟣RR: Risk/Reward
Explanation:
>The ratio comparing potential profit to potential loss in a trade.
Usage:
>Helps traders assess whether a trade is worth taking based on potential returns versus risk.
----------------
🟣SOW: Signs of Weakness
Explanation:
>Indications that the current upward trend may be losing momentum.
Usage:
>Traders look for SOW to prepare for possible trend reversals or to tighten stop-losses.
----------------
🟣SOS: Signs of Strength
Explanation:
>Indications that the current downward trend may be gaining upward momentum.
Usage:
>Traders look for SOS to enter long positions or hold existing ones.
----------------
🟣SL: Stop-loss
Explanation:
>An order to close a trade at a predetermined price to limit potential losses.
Usage:
>A crucial risk management tool to protect trading capital.
----------------
🟣 SLH: Stop-loss Hunting*
Explanation:
>When the price moves to trigger stop-loss orders before reversing direction.
Usage:
>Traders may place stop-losses strategically to avoid common stop-hunting zones.
----------------
🟣SSL: Sell Side Liquidity
Explanation:
>Areas where sell orders are clustered, often below recent lows.
Usage:
>Price may move toward these areas to trigger sell orders or stop-losses.
----------------
🟣TL: Trendline
Explanation:
>A line drawn over pivot highs or under pivot lows to show the prevailing direction of price.
Usage:
>Helps traders identify the trend and potential support or resistance levels.
----------------
🟣TP: Take-Profit
Explanation:
>An order to close a trade at a predetermined profit level.
Usage:
>Automatically locks in profits when the price reaches the desired level.
----------------
♨️ Bearish Reversal Pressure Expected
Explanation:
>Indicates levels where significant bearish (downward) pressure is anticipated, suggesting a potential reversal from an uptrend to a downtrend.
Usage:
>Traders watch these levels for potential sell opportunities. The larger the emoji, the higher the probability of a reversal.
----------------
🗝️ Bullish Reversal Pressure Expected
Explanation:
>Indicates levels where significant bullish (upward) pressure is anticipated, suggesting a potential reversal from a downtrend to an uptrend.
Usage:
>Traders watch these levels for potential buy opportunities. The larger the emoji, the higher the probability of a reversal.
----------------
Monitoring Bitcoin and Ethereum on Medium Time Frames (MTF)
Concept:
>Use Bitcoin and Ethereum's price behaviour on medium time frames as an additional confirmation for trading decisions.
Explanation:
>Observing how these major cryptocurrencies behave can provide insights into the overall market sentiment. If they show signs of strength or weakness, it can validate your trading ideas.
----------------
Invalidation of Levels with High Time Frame (HTF) Market Structure Changes.
Concept:
>Trading levels can become invalid if there's a change in the market structure on higher time frames.
Explanation:
>A significant shift in the long-term trend can override previous analyses. Always be aware of the overarching market direction.
----------------
Focus on High Time Frame (HTF) Opportunities
>HTF trades are generally more reliable and less risky. They provide stronger signals and are less susceptible to market noise.
----------------
Risk of Short-Term Trades
>Learn from short-term examples but prioritise long-term trades for better consistency.
----------------
Understanding Bitcoin Volatility (BVOL24H)
>High volatility in Bitcoin often occurs when the 24-hour Bitcoin Volatility Index (BVOL24H) is at support levels.
>Monitoring the BVOL24H can help anticipate periods of significant price movements, allowing for better timing of trades.
----------------
🔑 Takeaways for Beginners
>Focus on High Time Frames: They provide more reliable signals and reduce the impact of market noise.
>Understand Market Structure: Recognising shifts in trends is crucial for making informed trading decisions.
>Use Multiple Confirmations: Combine observations from Bitcoin and Ethereum with other indicators for stronger trade setups.
>Plan Ahead: Anticipate future price movements and set alerts to be prepared when opportunities arise.
>Risk Management Is Essential: Always use stop-losses and consider the risk/reward ratio before entering a trade.
>Avoid Emotional Trading: Stick to your trading plan and avoid chasing the market.
>Continuous Learning: Trading involves constant learning and adaptation. Keep studying market behaviours and refining your strategies. - dont give up just because you dont immediately understand something - put in the effort
If you arent sure where to start, this is a very very good place besides getting your head around tradingview and exchanges etc
>if you dont understand something, become resourceful
>type it in to youtube
>ask a mentore
>build a network of like minded people that can work together to learn and decode everything
its much much faster](https://pbs.twimg.com/media/GYffXlYbQAAL5nC.jpg)


