📚 Time & Space Complexity Cheat Sheet
One of the biggest reasons people struggle in coding interviews isn't coding.
It's choosing the wrong algorithm.
Before solving 500 LeetCode problems, master Big O.
Today's notes cover: 📌
• What is Big O Notation?
• Common Time Complexities
• Common Space Complexities
• Complexity Growth Graph
• Time Complexity of Common Operations
• Space Complexity Examples
• How to Calculate Complexity
• Complexity Summary Table
• Interview Tips & Shortcuts
After understanding this, you'll be able to analyze the efficiency of almost any algorithm.
Stop memorizing.
Start asking:
• Can this be done in O(n)?
• Can I reduce the extra space?
• Is there a better approach?
These questions separate good engineers from great ones.
Bookmark this for revision.
Look closely: the left-hand sides match exactly. Only the right-hand side differs, yet the solutions change from eternal equilibrium to irreversible smoothing to everlasting oscillation.
Laplace’s equation insists that the value of u at any point equals its average over every surrounding circle. The functions that survive are the harmonic ones, as rigid as possible.
A first-order time derivative turns the equation into pure diffusion. Gradients dissolve, information is lost forever, and the future cannot reconstruct the past.
A second-order time derivative restores reversibility. Disturbances propagate at finite speed, energy is conserved, and time looks the same in both directions.
These three operators together predict the electrostatic potential of a charged conductor, the temperature history of a cooling billet, and the resonant frequencies of a drumhead.
Which single change of derivative struck you as the most radical when you first met the solutions?
Rus bir doktorun hazırladığı sırt ve disk ağrılarını ameliyatsız olarak ortadan kaldıran özel egzersizler.
Günde 15 dakikanızı ayırmanız yeterli olacaktır..
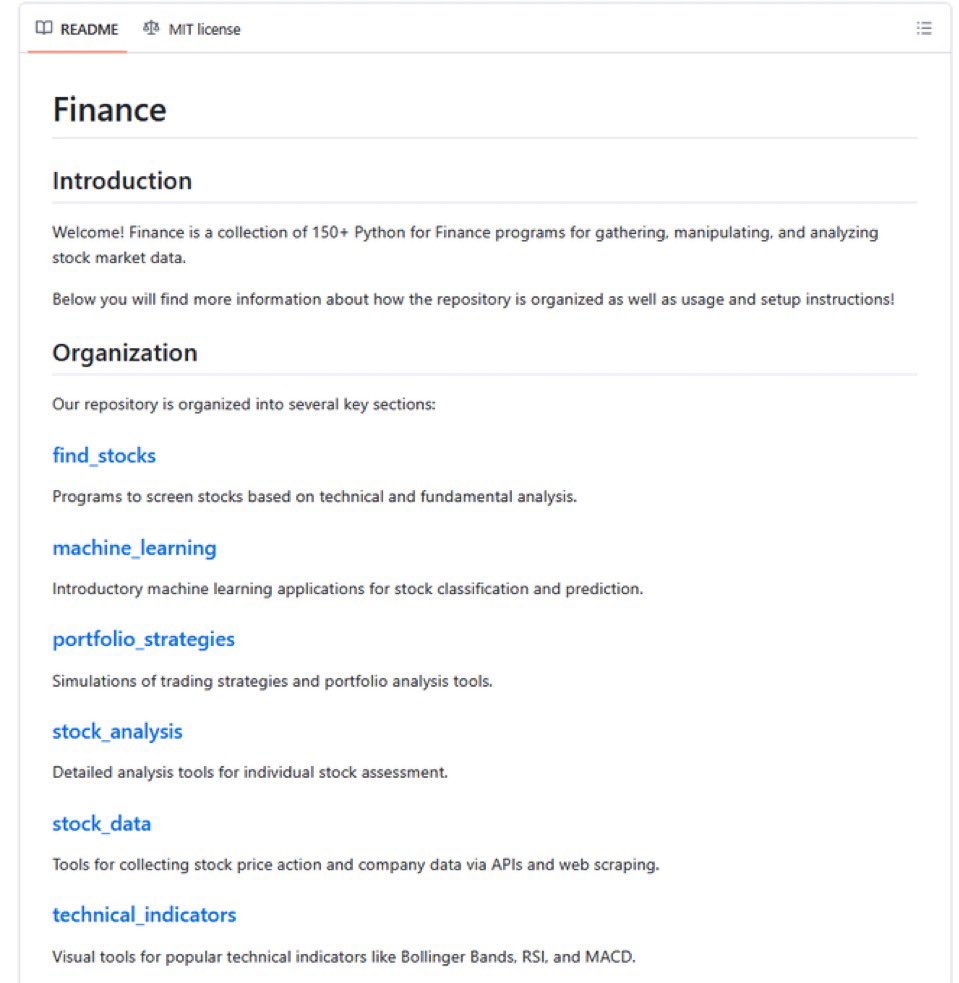
Python ile hisse senedi verisi toplamak, işlemek ve analiz etmek isteyen finans profesyonelleri için 150'den fazla hazır program içeren açık kaynak bir depo.
Teknik bilgi düzeyi ne olursa olsun, doğrudan uygulamaya geçirilebilecek bir kaynak.
Link👇
https://t.co/FXzSBKIaXo
Even though correlation and covariance are two of the most common statistical metrics, they are often misunderstood and used interchangeably. Let’s clarify the difference!
Covariance measures how two variables move together. A positive value indicates that as one variable increases, the other tends to increase as well, while a negative value suggests an inverse relationship. However, covariance is affected by the scale of the data, making it difficult to compare across different variables or data sets.
Correlation standardizes covariance by dividing it by the product of standard deviations, ensuring values always range from -1 to 1. This makes correlation easier to interpret and compare across different variables. It is widely used for feature selection, detecting multicollinearity, and assessing relationships in statistical modeling.
The image below visualizes different types of relationships between variables. The top-left shows strong positive correlation, where both variables increase together. The top-right illustrates strong negative correlation, where one decreases as the other increases. The bottom-left represents a weak correlation, with little clear relationship. The bottom-right highlights a nonlinear relationship, where correlation fails to capture the dependency structure. This demonstrates that correlation is useful for linear relationships but may not be reliable for more complex patterns.
🔹 In R, cov() computes covariance, and cor() calculates correlation. For robust estimation, cov.rob() (MASS) stabilizes covariance, while cor(method = "spearman") handles rank-based correlation.
🔹 In Python, numpy.cov() calculates covariance, while numpy.corrcoef() computes correlation. pandas.DataFrame.corr() is efficient for large data sets, and scipy.stats.spearmanr() or sklearn.feature_selection.mutual_info_regression() helps with nonlinear relationships.
Want to dive deeper? Explore my online course on Statistical Methods in R! Learn more: https://t.co/7YQCRDKSPO
#programming #Data #coding #RStats #DataAnalytics
Physics, math, chaos theory, unpredictability.
→ Strange universe. Circle attached to a stick.
Credit: Wesphysdemo (Wesleyan Physics Dept.); I didn’t upload this video to 𝕏. I’m pointing to a video in the 𝕏 stream of “pascal_bornet” (Feb 11, 2022).
→ Lego gravity pendulum. Math, chaos, motion, unpredictability, physics.
Credit: I didn’t upload this video to 𝕏. I’m pointing to a video residing in the 𝕏 stream of “alysa”, 𝕏 ID “gvreats” (Aug 5, 2026).
′′ Le vélo est la mort lente de la planète ".
Un banquier a fait réfléchir les économistes quand il a déclaré : ′′
Un cycliste est une catastrophe pour l'économie du pays :
il n'achète pas de voitures et n'emprunte pas d'argent pour l'acheter.
Il ne paie pas les polices d'assurance.
N'achète pas de carburant, ne paie pas pour la révision et les réparations nécessaires de la voiture.
N 'utilise pas de parking payant.
Il ne provoque pas d'accidents majeurs.
Ne nécessite pas d'autoroutes multiples.
Il ne devient pas obèse.
Les gens en bonne santé ne sont pas nécessaires ou utiles à l'économie.
Ils n'achètent pas de médicaments, ils ne vont pas dans les hôpitaux ou chez les médecins, ils n'ajoutent rien au PIB du pays.
Tandis que chaque nouveau magasin McDonald' s crée au moins :
30 emplois,
dont 10 cardiologues,
10 dentistes,
10 experts en régime alimentaire et nutritionnistes,
ainsi que les personnes qui travaillent dans le magasin lui-même, évidemment ".
Choisissez donc avec attention : un vélo ou un Mc Donald ?
Ça vaut la peine d'y penser...
PS : marcher c'est encore pire car les piétons n'achètent même pas de vélo !
NumPy is a core library for data science and machine learning. It enables efficient array operations, statistical analysis, reshaping, filtering, and numerical computing that power modern analytics and ML workflows.
#Python#NumPy#DataScience#MachineLearning#AI
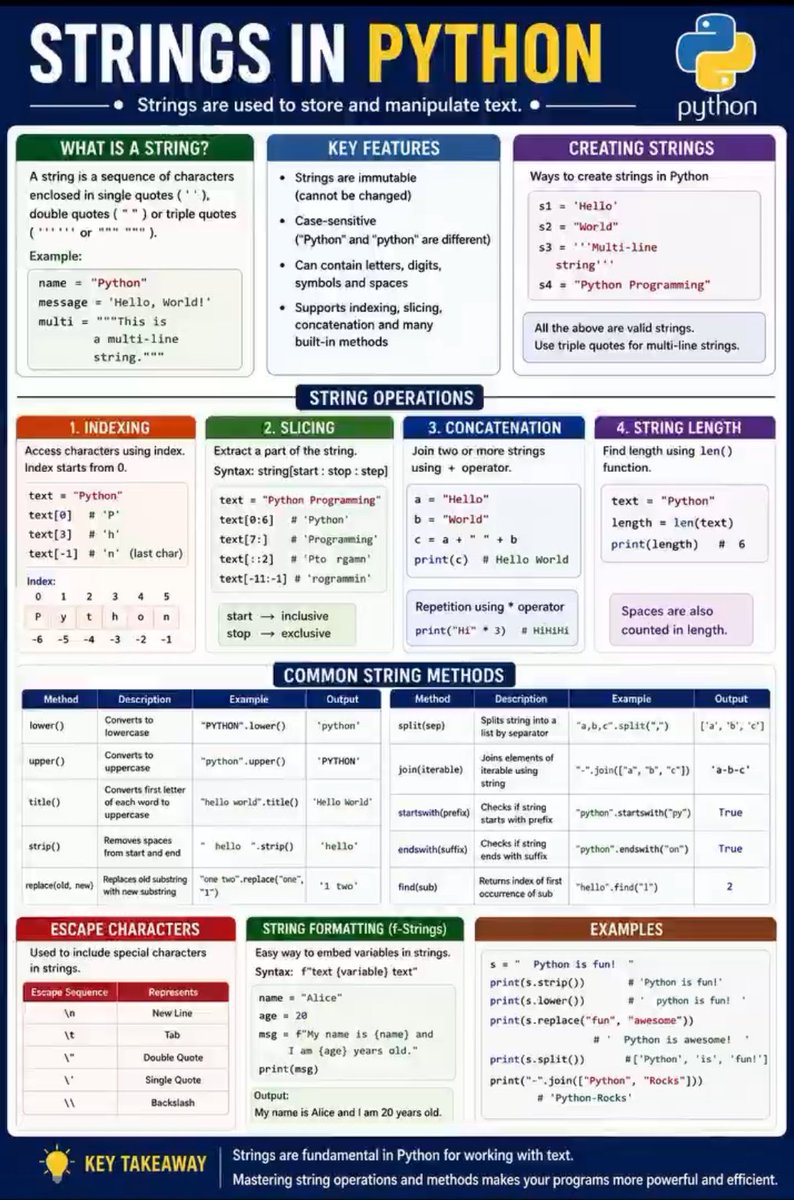
Strings are the backbone of text processing in Python.
Learn string creation, indexing, slicing, concatenation, formatting, and commonly used string methods in one easy-to-understand poster.
Save this post for your Python learning journey.
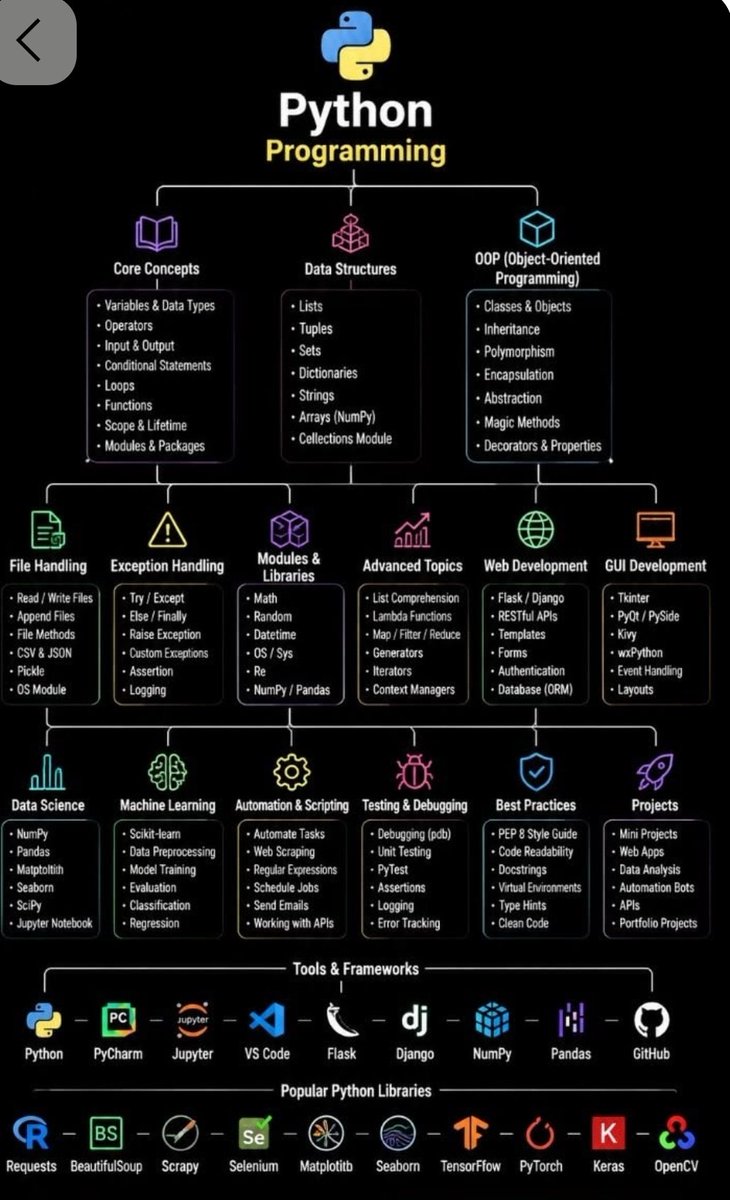
Stop trying to learn Python in 10 hours.
You don’t need a massive bootcamp or a lengthy course to master the basics.
You just need 30 minutes a day for 30 days.
Here is the exact 30-Day Python Learning Roadmap (from zero to building your first project).👇
Struggling to remember Python syntax… again? 😩
You're not alone.
Every developer has that moment; staring at a blank screen, forgetting if it’s append() or extend(), or how to read a file without closing it manually.
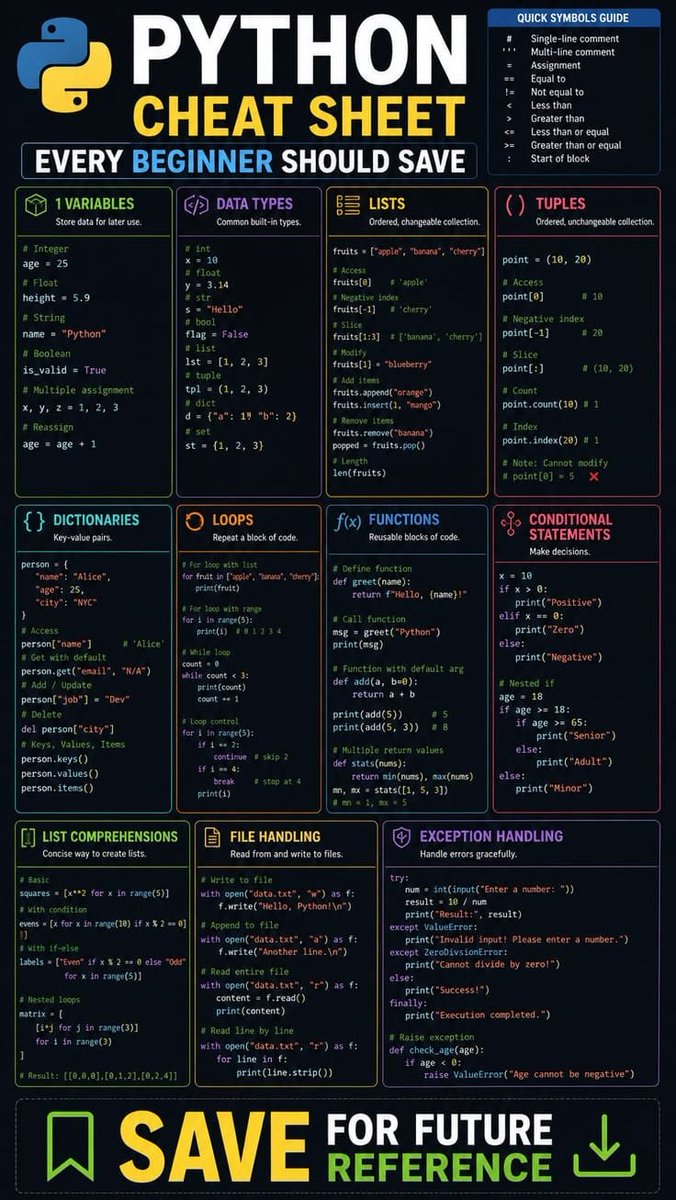
That’s why this cheat sheet 👇 is pure gold.
It covers everything you need to get started, and keep going:
· Variables & Data Types
· Lists, Tuples, Dictionaries (with real examples)
· Loops & Conditionals (even continue vs break)
· Functions, List Comprehensions
· File Handling & Exception Handling
Whether you're a complete beginner or a seasoned coder who needs a quick refresher, this one-sheet saves you hours of Google searches.
Save it. Share it. Keep it pinned.
Which Python concept still trips you up? Drop it below 👇
#Python #Programming #Coding #PythonCheatSheet #LearnToCode #CodeNewbie #Developer #SoftwareEngineering #DataScience #TechTips #100DaysOfCode #PythonLearning #CodingLife