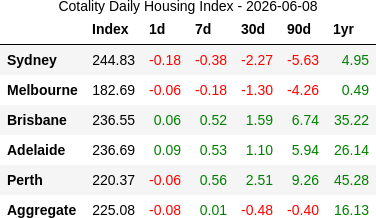
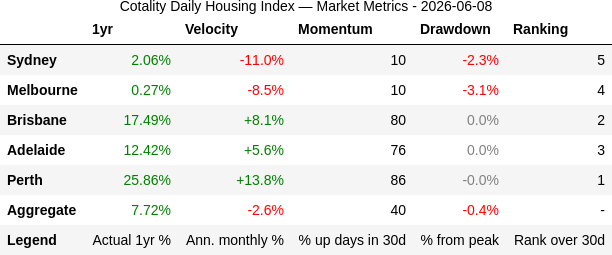
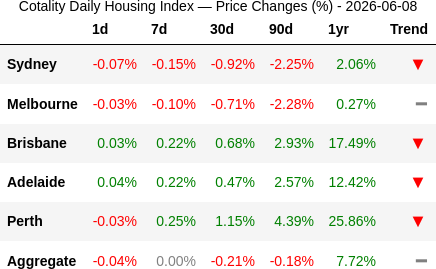
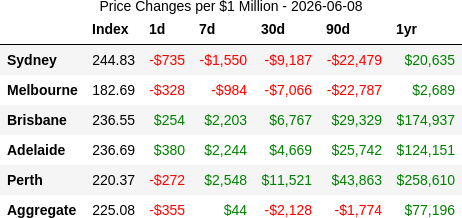
📉 2026-06-08: Perth leads at +13.8%/yr pace but cooling, while Sydney slides faster at -11%/yr. Gap between top and bottom: nearly 25pp. Brisbane/Adelaide still positive, all three easing off prior pace.
If you're going to panic, panic early - sold after only 10 months.
Aug 2025: $2.1m → Jun 2026: $2.08m
-$20k nominal, ~$160k all-in after stamp duty and agent fees.
📈 2026-06-07: Perth leads at +15%/yr but easing off +18%/yr prior pace. Brisbane +8%/yr, Adelaide +6%/yr — both cooling. Sydney -10%/yr, decline picking up speed. Melbourne -8%/yr, stabilising slightly.
20 Bundarra St, Blackheath
Agent says $1.15m
Market says $1.06m after 108 days on market
Last sold Jun 2025: $1.125m
Relists Feb 2026 at $1.15m
Sold Jun 2026: $1.06m
Vendor wears ~$134k loss in 12 months after stamp duty and agent fees. Agent clips ticket twice.
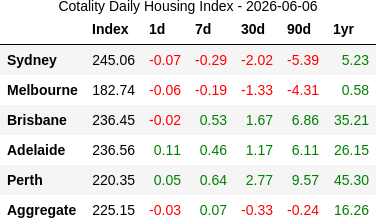
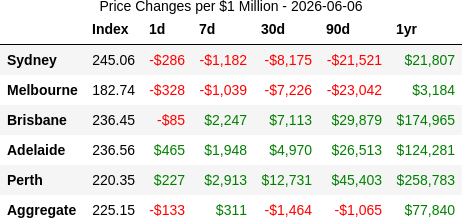
📉 2026-06-06: PER/BNE/ADL momentum 90/80/76 vs SYD/MEL at 16/6. Perth leads at +15.3%/yr but cooling, as are BNE & ADL. Sydney & Melbourne still sliding, declines steady not deepening.
📈 2026-06-05: Adelaide's growth cooling fast — 30d pace +5.9%/yr vs. +10.5% over 90d. Perth still leads at +16%/yr but also coming off the boil from +18.4%. Sydney and Melbourne drift lower, steadily.
Sydney's property fall isn't just a top-end problem.
Not a Paddington terrace, just a 4-bed brick veneer in Blacktown. Bought $1.285m (Nov 2024). Sold $1.215m (Jun 2026), below Domain's bottom end valuation range.
~$150k torched in 19 months after stamp duty and agent fees.
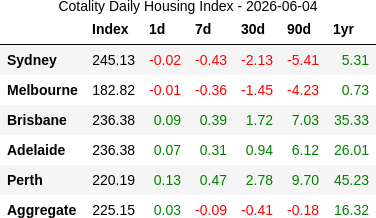
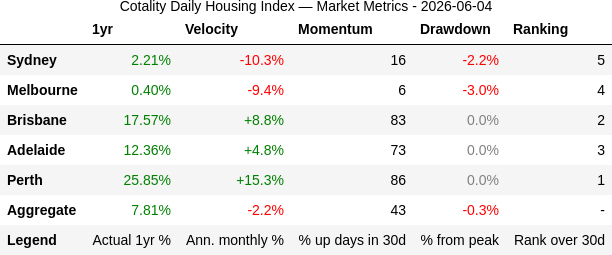
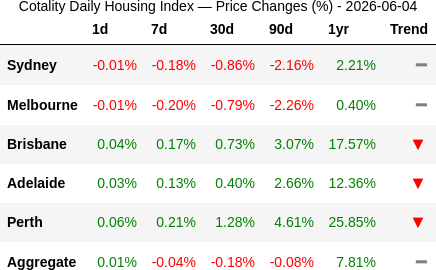
📈 2026-06-04: Perth (+15.3% yr) still leads but growth is cooling, as are Brisbane and Adelaide. Sydney and Melbourne drifting lower, Sydney's slide nudging deeper. 25pp gap between Perth and Melbourne over the past year.
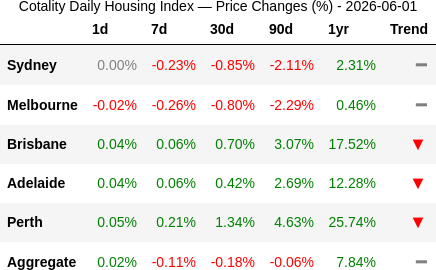
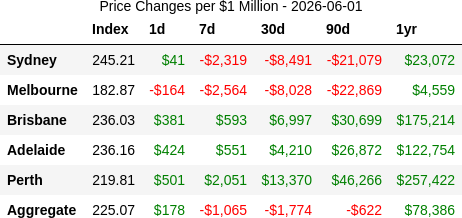
📈 2026-06-01: Perth muscling ahead at +16%/yr, Brisbane +8.4%, Adelaide +5.1% — all three decelerating vs last quarter. Sydney -10.2%/yr and Melbourne -9.6%/yr drift deeper into negative territory.
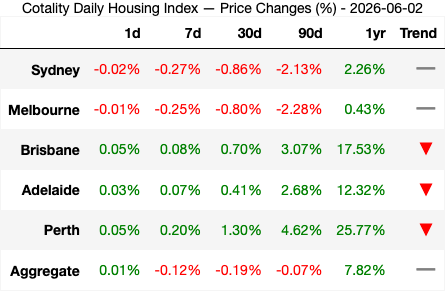
📈 2026-06-03: Perth, Brisbane & Adelaide at fresh highs — but all three are losing steam. Sydney 117d off peak (-2.2%), slide edging deeper. Melbourne 179d out (-3.0%), decline holding steady.
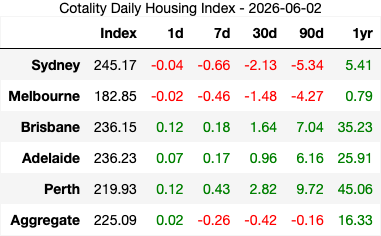
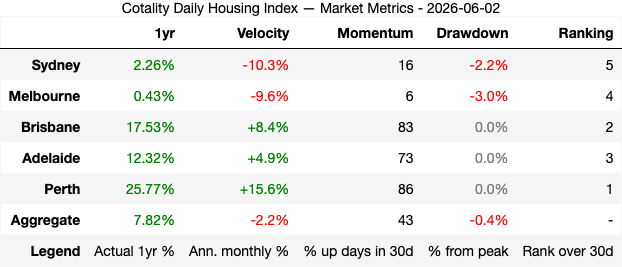
📈 2026-06-02: 30d board — 1) PER 2) BNE 3) ADL 4) MEL 5) SYD. Perth still leads but all three northern cities are losing steam, while Sydney's slide is picking up speed at -10.3%/yr.
📉 2026-05-31: Perth leads at 86 momentum, Brisbane 83 — both near peak. Adelaide 70, aggregate 43, Melbourne 6, Sydney 13. Perth still doing the heavy lifting at +16.5%/yr, but all four gainers are losing steam vs last quarter.
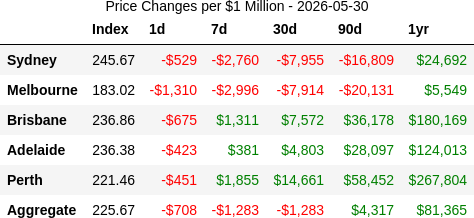
📉 2026-05-30: Perth still powering ahead at +17.6%/yr but easing hard from +23.4% over 90d. Same story in Brisbane and Adelaide — positive but losing steam fast. Sydney and Melbourne's declines holding near -9.5%/yr with no floor in sight.
"Sydney doubles every decade!"
72 Cheryl Cres, Newport:
2013: $1.025m
2022: $2.4m ✅ (doubled!)
2026: $2.3m ❌
Paper hands 🧻 — sold barely a third into the decade
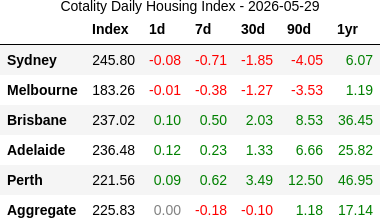
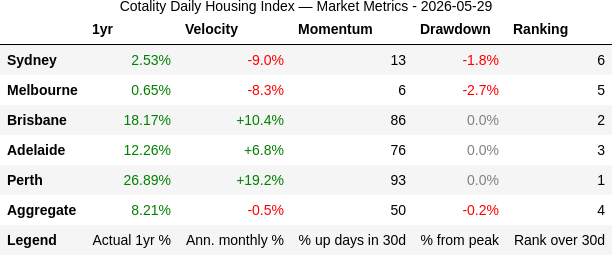
📊 2026-05-29: Perth still doing the heavy lifting at +19%/yr, though all three northern cities are losing steam vs. last quarter. Sydney sliding at -9%/yr and accelerating lower. Melbourne steady at -8%/yr.
Feb 2025: $3.675m
May 2026: $3.55m
Vendor: down $125k nominal, ~$190k stamp duty, ~$70k agent fees, 170 days unable to find a tenant.
Selling agent doing well clipping the ticket twice in 15 months.
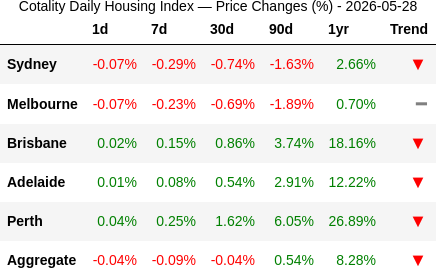
📉 2026-05-28: Perth powering at +19.4%/yr, Sydney drifting at -8.9%/yr — a 28pp spread. Both losing pace vs. last quarter, but Perth still doing the heavy lifting while Sydney's slide picks up speed.