Everything seems to be happening by itself. From atoms and cells, to stars and galaxies. Thoughts and emotions. Even consciousness.
I can't get this notion out of my head.
@MagneticNorse For all you city folks… Those AREN'T ticks. ...Guy is lying which is why he keeps moving the camera around so that you can't get a good visual
@lord_fed Thank you, sir. Really looking forward to this one. My life got much better when I stopped options and went to futures. But I always felt like it was likely because I didn't properly understand options. So again, looking forward to it.
@RambusChart The angle of the neck line is too steep. Not real head and shoulders. When the left shoulder top is almost the same level as bottom of right neck, too steep. But yes, still meaningful.
Palobar is unparalleled. He always resists sensationalism. Never concerned w making you happy/dreamy. Just raw, original, objective analysis. So refreshing. So helpful. Yes, he doesn't tell you what to do & when to buy, but he gives immensely actionable criteria. Thanks brother🙏
#gold#silver#preciousmetals
"It never was my thinking that made the big money for me. It was always my sitting. Got that? My sitting tight!"
Quick Note>
1. There is NO pattern of "higher HIGHs, higher LOWs" in silver yet. These are NOT true highs and lows; that is why these same calls in February (and in the past) have failed.
2. The $95.56 level that I noted in February kept us on the safe side. Silver failed to close > that level and declined 37%. Above $95.56, the bulls are in control. Below $75, the bears will be in control.
3. My original idea was that the decline in gold and silver would most likely conclude by April. My max decline for gold was $4150-$4200 (spot). So far, this has been accurate.
4. The short-term situation in gold can be best described imo as "a lack of interest". (in terms of positioning).
5. In late February, I drew your attention to the Feb 17 low. Notice where the recent bounce was rejected. The high came exactly on April 17 (key date).
6. Gold has been forming "Lower highs and lower lows". The big boys are surely watching this. Under $4649, it gets into a tricky position. If we break the May low, it will attract speculative short positions.
CONCLUSION
In my opinion, the consolidation/correction is not over yet. A retest of the recent lows is still possible. I could be wrong (I have been wrong many times), but I think ~$3800s (gold) and $54 (silver) are still on the table.
This is a healthy correction after the massive moves we saw.
Long-term, much higher.
@TicTocTick My guess is he'll be just as corrupt as every other president we've had the last 3 decades. The puppet masters know how to pick them, know what the people want, what sells. Nothing will change with him. Just more of the same.
Gary, I know it's brutal being in your position, but the thing to do right now is to make a post saying that you were wrong. You know in your gut & heart it's the right thing to do. Don't succumb to the temptation to be a child. Lead by example & do what men do (accountability).
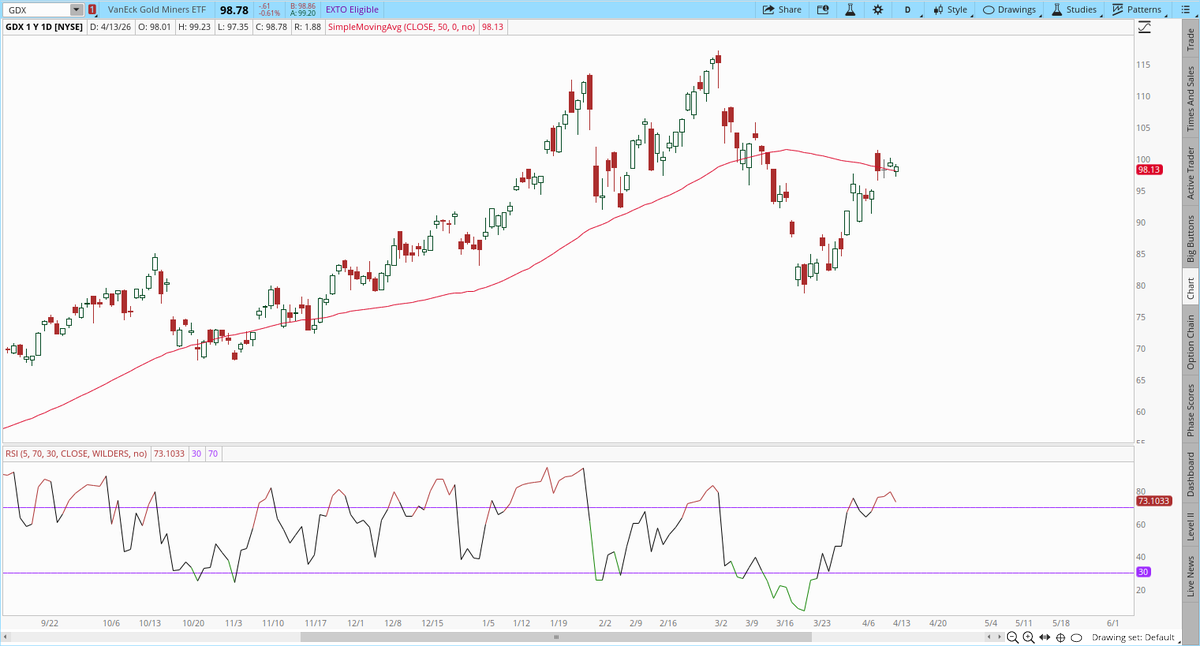
Miners are whispering the bottom is in, but it seems like no one is listening. 2nd close above the 50 DMA and forming a bull flag.
Also of note, the dollar has closed back below the 200 day moving average. Odds are good the dollar has rolled over and is now in the declining phase of its intermediate cycle. There's your driver for the next leg up in the bull market.
@TicTocTick Wheat is getting a real thrashing shakeout. I know. I been losing. No level holds. Brutal. Makes me think you're on to something. Bc I feel like being done w it. F me if we travel literally all the way back to fill the gap at ~572.
The account has made 14 trades in its entire history
That is not a typo
Every prediction targets the same market, US x Iran permanent peace deal. Every position is No. Every closed trade resolved green
974,493 collected so far. Biggest win 177,500 from a single closing
The current exposure tells the rest of the story:
-> May 31 No: 3,375,431 active
−>June15 No: 38,601 active
-> June 30 No: 43,790 active
−>July 31 No: 39,336 active
Total positions value: $3.5M. Sitting on one geopolitical read
The thesis is simple. Peace treaties do not get signed in days. The market keeps forgetting that. This account keeps reminding it
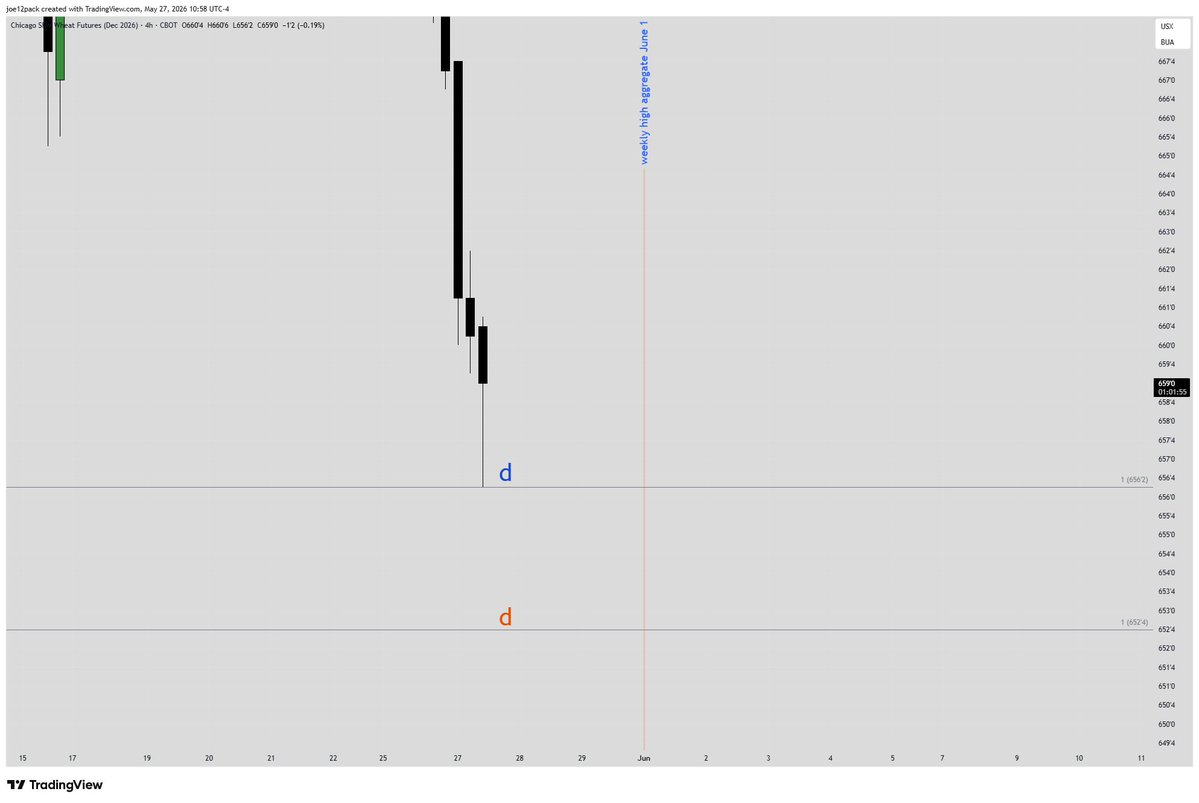
$wheat December contract. Multiple d targets here at 656'2 and 652'4. June 1 is a weekly timing target so look for a turn from either of these 2 numbers.
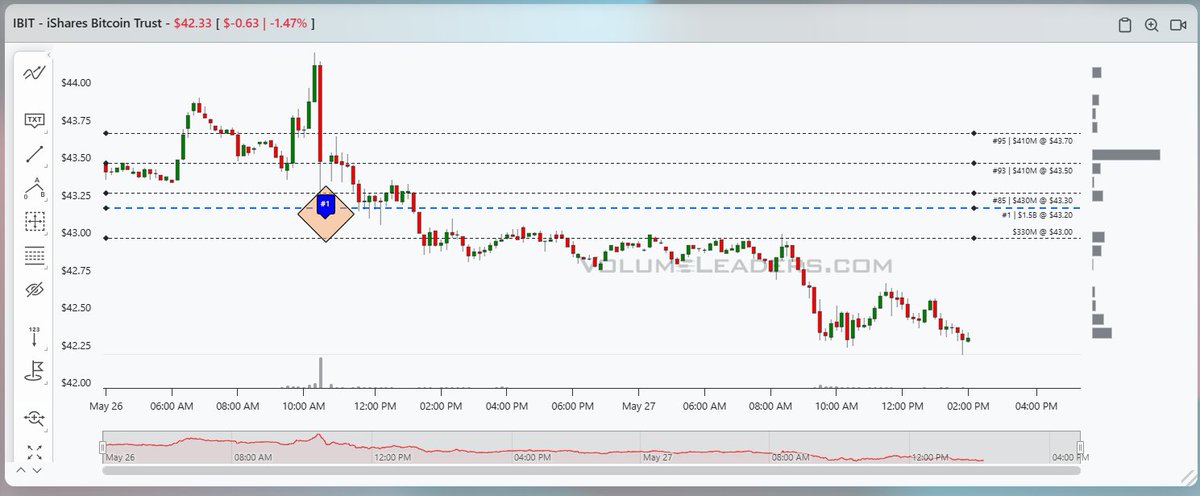
$IBIT - An interesting thing happened yesterday. The #1 trade in $IBIT arrived at the LOD as a late print, with price much higher at the time of its arrival. Almost always, that suggests institutions bought, and intend to take price much higher. Price was 2% higher by the time the trade was reported.
At the time of its arrival, the chart looked like image 1.
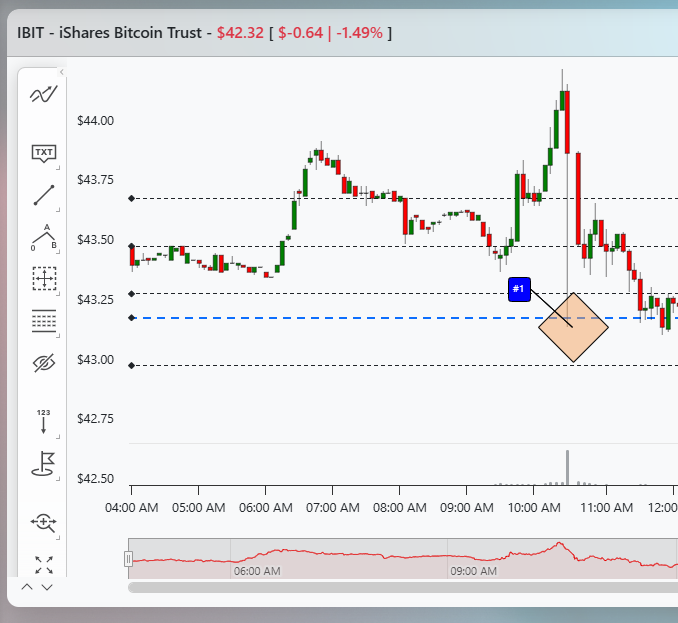
A couple hours later, the chart looked like image 2. Price had returned for a test from above. Not ideal for such a large "bullish" trade, but technically fine.
By the end of the day, price had closed below the print and midday today price has continued lower (image 3).
Best guess, this guy took a terrible fill just to exit the position. Not something you see very often.
Maybe price recovers...but so far this isn't looking good for $BTC. #1 was twice as large as the previous #1, clocking in at $1.26B ...
Additional context on the site.
https://t.co/i5V7d5F34S
@VolumeLeaders From your experience, Bruce, do institutions sometimes express a long position in the underlying by shorting a leveraged inverse ETF such as this? I realize you never exactly know for sure if prints are buys or sells, but from reading the aftermath, do institutions ever do that?
@Guv999 I have a measured move to $40. Seems unlikely but I like it bc most bulls give up below 50. Maybe during the next stock market panic H2 2026 or H1 2027.
Be v cautious in general from second half of July 2026 wrt stocks ( General , PM, AI, Resources, whatever) & all cryptos, friendly advice to all Follows
😎👍