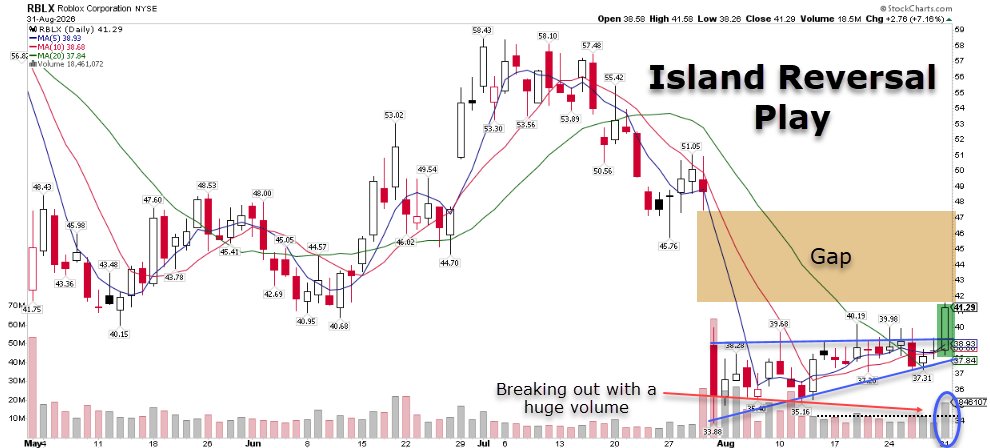
$RBLX - Strong move today with volume coming in. Price is breaking out of the recent consolidation/downtrend and pushing back toward the gap zone. Volume confirmation is encouraging. If momentum continues, the gap area could become the next target. Always manage risk with a defined stop.
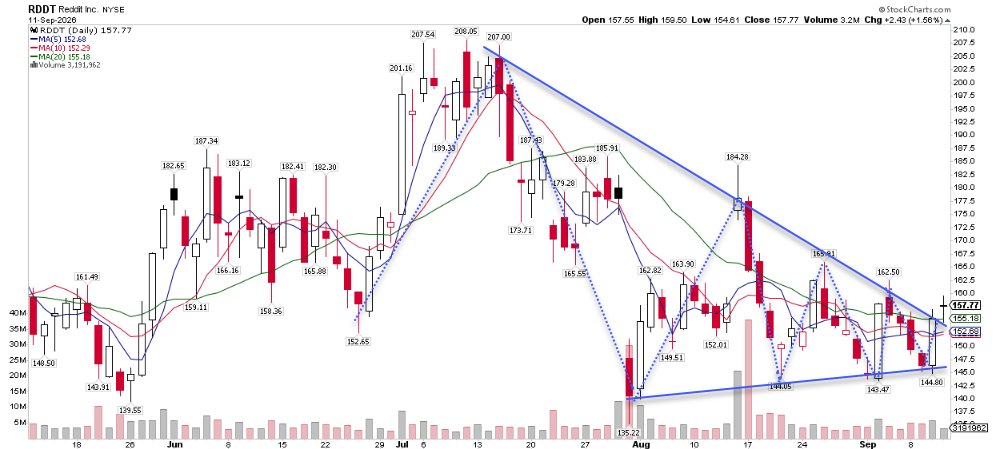
$RDDT - Just broke out of the pattern and closed above the trendline.
We need to see stronger volume to confirm the breakout, but the overall setup looks good. Momentum is improving, although there’s still heavy selling pressure showing up.
The big question is: who keeps dumping all these shares?
Let’s see if buyers can absorb the selling and push this higher.
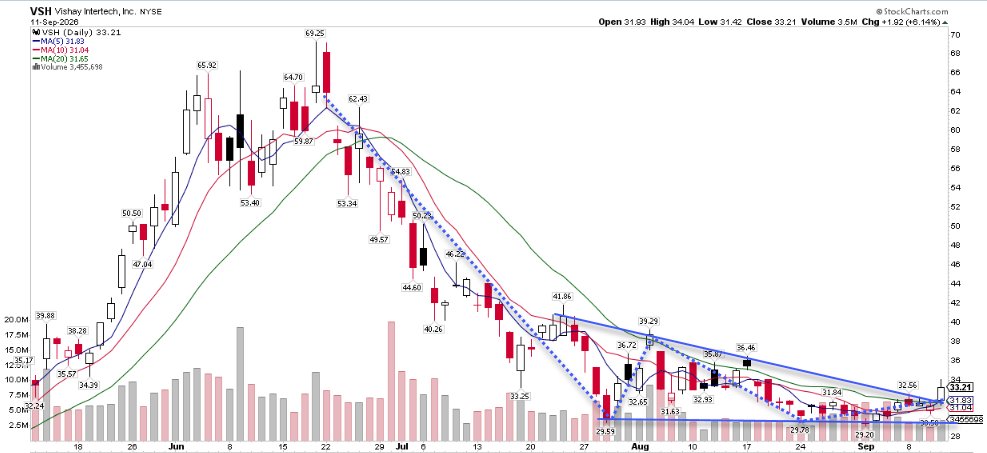
$VSH - Descending triangle failed to break down. Price reclaimed the trendline and is now pushing higher.
Momentum looks good here and the setup is saying you have to be in now. Let’s see where it takes us. 👀
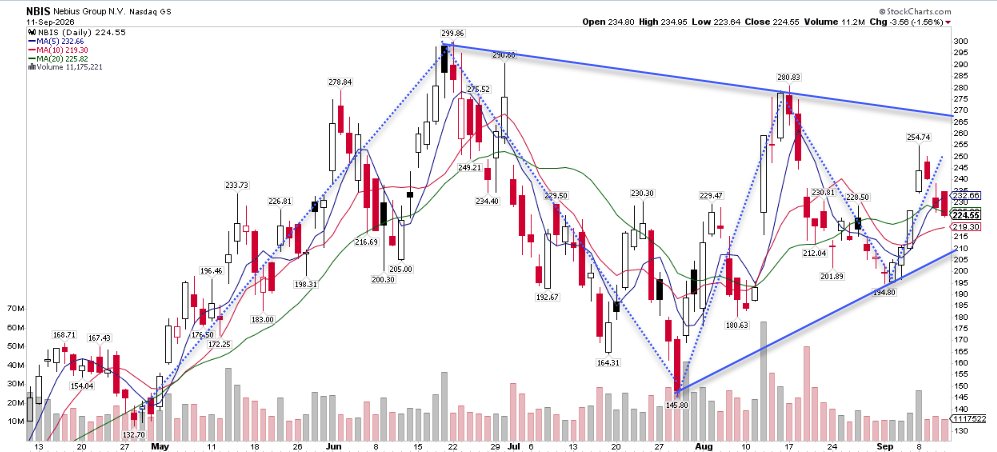
$NBIS - Just zoomed out and took a longer-term look at the chart. The setup is looking really good, but we need to see a breakout and confirmation before the next move higher.
There’s a chance we could retest the $210–$215 support trendline. If we get that pullback, I’ll be looking to add more around that level.
For now, the setup looks very constructive to me.
$NBIS gap has been filled today. Now the key question is whether buyers can push the stock higher and begin filling the gap above.
Price is currently testing an important area around the moving averages after the recent pullback. A move back above $210–$215 would improve the setup, while reclaiming the upper gap area could open the door for a larger move.
This one is worth watching closely for confirmation of strength after the gap fill.
$AXON - chart update.
Price hit the buy zone and is now sitting right at the support trendline. This is an important level to watch.
I’m expecting a bounce from here, but let’s see how price reacts and where it takes us.
$AXON - Price is pulling back toward the next possible trendline support and approaching the buy zone. A reaction from this area could set up a nice bounce. $460 is the key stop-loss zone to watch. I'm closing watching for an entry.
$DOCN - Basing near $112 after filling the April gap. Descending resistance trendline in play and a close above $125 would confirm the breakout. Stop-loss zone sits near $100.
$AXON - Price is pulling back toward the next possible trendline support and approaching the buy zone. A reaction from this area could set up a nice bounce. $460 is the key stop-loss zone to watch. I'm closing watching for an entry.
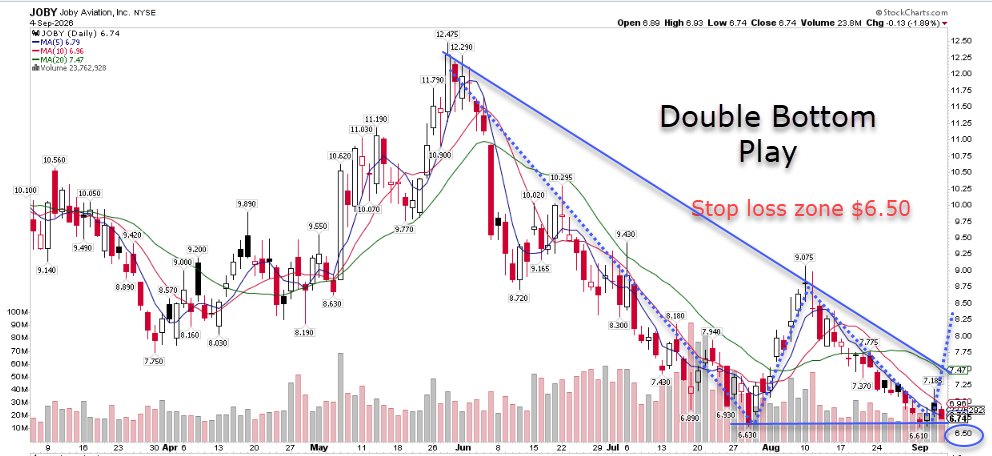
$JOBY - Double bottom setup with a tight stop around the $6.50 area. This could be an interesting setup for the buy-the-dip crowd, especially if support continues to hold. 👀
$DOCN - Basing near $112 after filling the April gap. Descending resistance trendline in play and a close above $125 would confirm the breakout. Stop-loss zone sits near $100.
$INTC - Just broke above the falling trendline after weeks of pressure. Price is also back above the short-term moving averages, which is a positive sign.
If this breakout holds, the unfilled gap around $115–$120 could become the next upside target.
$AXON - Price is pulling back toward the next possible trendline support and approaching the buy zone. A reaction from this area could set up a nice bounce. $460 is the key stop-loss zone to watch. I'm closing watching for an entry.
$JOBY - Double bottom setup with a tight stop around the $6.50 area. This could be an interesting setup for the buy-the-dip crowd, especially if support continues to hold. 👀
@mellowrk_lion Wishing you a wonderful early retirement! Your quality DD and sharp picks will be missed. You did what was right for your happiness, keep rocking!
$CBRS is testing a clear upward sloping support trendline that has held multiple times since the June -July lows. Price is currently sitting right on that line near the recent close. Watching closely to see if this holds.
$BE is tightening inside a symmetrical triangle, with price approaching the apex. The range is getting compressed between descending resistance and rising support.
A breakout above the upper trendline could trigger a strong move, with $320 as the potential target based on the pattern.
Momentum is improving, but I’d want to see a clean breakout and close above resistance with volume for confirmation.
$NBIS gap has been filled today. Now the key question is whether buyers can push the stock higher and begin filling the gap above.
Price is currently testing an important area around the moving averages after the recent pullback. A move back above $210–$215 would improve the setup, while reclaiming the upper gap area could open the door for a larger move.
This one is worth watching closely for confirmation of strength after the gap fill.