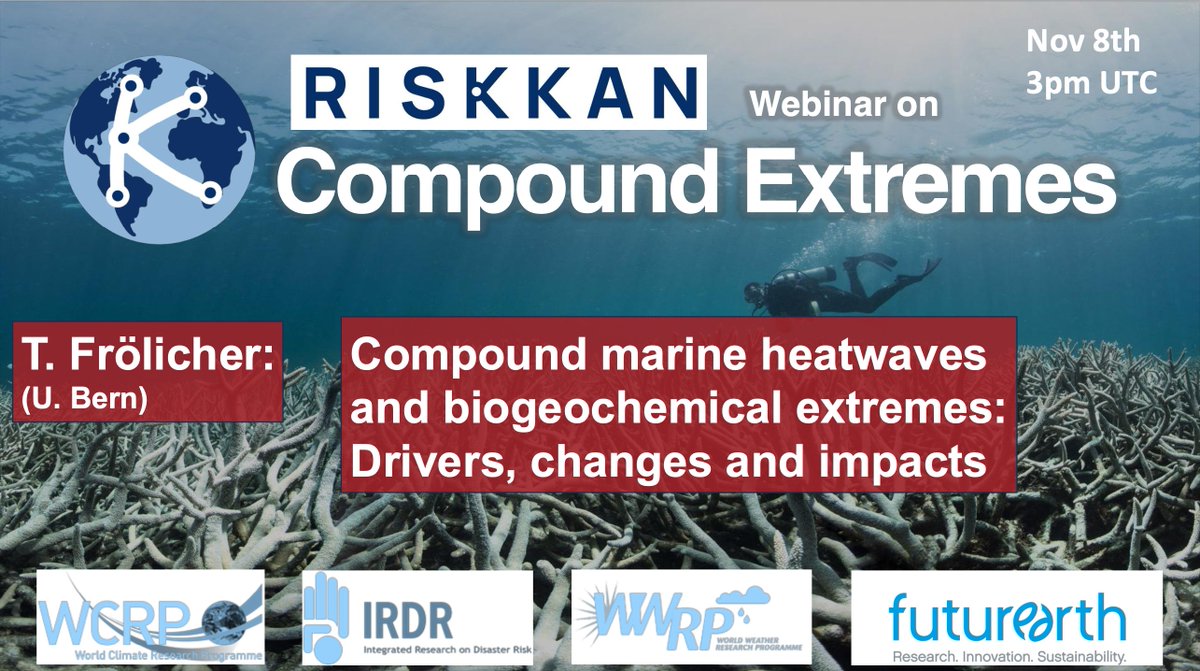
Risk KAN: Compound Events webinars are continuing! Next is Fri Nov 8 at 3pm UTC with @froeltho speaking about "Compound marine heatwaves and biogeochemical extremes: Drivers, changes and impacts". Zoom info: https://t.co/Ez8ZUBLPoM
The Gulf region sits at the very vanguard of climate-change-driven heat threats. How humid heat plays out there, in all its complexity, is essential for planning heat resilience across impacted people and sectors — particularly for risks that may have counterintuitive elements.
No matter how intense the humid heat, it might be thought that sunset and a refreshing sea breeze will always bring some relief. But close examination of the Persian/Arabian Gulf region dispels these assumptions, as explored in our new @CommsEarth paper: https://t.co/8cTDerxuIx
Metrics (WBGT, UTCI) with radiation have a typical afternoon peak. But Tw & HI, widely discussed in recent years, apply well to indoor/shaded conditions. We consider them incomplete yet valuable signposts on the way toward a full, locally relevant portrait of heat-stress risk.
In a peaks-over-threshold sense it's shaping up to be less singular, but still likely in the global all-time top 20 (~35C of cumulative record margins). Being the tail end of summer makes it a bit more bearable, but also causes more intersection with fall activities like sports.
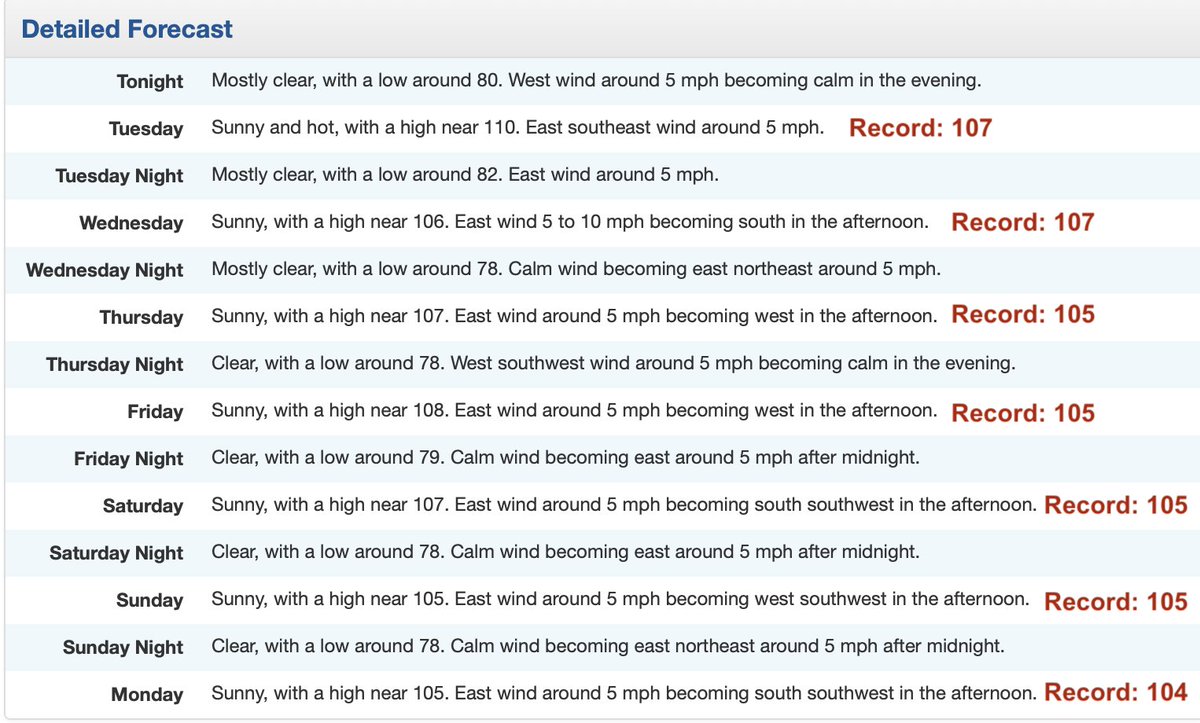
@NWSPhoenix's streak of consecutive record-setting days, already 13, would reach 20 if the current forecast holds. Among all global locations with 50+ years of data, the only comparable streaks have been on various tropical Pacific islands, plus the Russia 2010 mega heat wave.
@robsobs A few spots in TX/LA might have done it last Aug (haven't fully verified though). On a global scale, for places with long periods of record, the only remaining competitor for continuous record-setting length will be Russia 2010 if Phoenix keeps this up much longer
Helene's aftermath is rightly drawing much of the attention in the US, but the ongoing heat wave in Phoenix is truly shaping up to be one for the record books. Today was the 7th consecutive record-tying or -setting max temp, with nearly all the next 7 days expected to do the same
@DonSuth89069583 The heat in Phoenix has really been outperforming this week. A quick search suggests today at Sky Harbor might well be the latest 117F/47C ever recorded in the US.
🆕Special Webinar | In one month, XAIDA and @CLINTH2020 will be holding a webinar on compound weather and climate events.
Meet our two speakers, @Bevacqua_E (UFZ) and Niklas Luther (JLU).
🔎Abstracts & registration 👉https://t.co/EeOeaoeNaT
🗓️October 25th ⏰10:30am (CEST)
Insightful reporting by @abcnews about efforts at @HeatHealth_USYD to probe the very limits of human heat tolerance. (With a hot/dry wet-bulb temp of 35C, this trial had to be ended after 2.5 hours.) https://t.co/PbAtSW2U9N
Encouraging to now see humid heat spotlighted in the 2023 State of the Climate report https://t.co/vJMwTjhVEh, but alarming to track its inexorable rise.
Great work summarizing this hazard in our subsection led by Kate Willett
Applications for the 3rd Como Training School on Compound Events are open!
Deadline for applications: August 25th.
For further info visit: https://t.co/YiX7vBxHuH
@Compound_Event
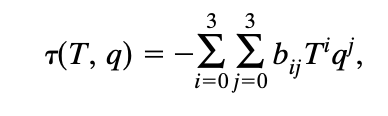
@sunil_nagaraj Yes, stickiness tau can be expressed as the following, which we then solve numerically to yield the results shown in Table 1. Stickiness is designed to vary across equal values of a given humid-heat metric, so in your table its isolines would track from lower left to upper right.
A fundamental problem in humid heat -- as a bivariate quantity, what does it mean if places or times have the same humid-heat value (choose your favorite metric) but different combinations of temperature and moisture?