new article: https://t.co/SB2NhU7ovr . We present "Why It’s Time to Analyze Your Acoustic Test Data with Machine Learning — Now!"
The reasons include:
- The maturity of ML algorithms: Advanced algorithms are now capable of processing audio data more efficiently than ever before.
- Low data requirement models: Foundation models that require minimal data to provide valuable insights.
- Accessible expertise: The technology has become more accessible, allowing a broader range of professionals to leverage ML tools.
The article outlines common challenges and how to overcome them, and additionally shows you which system architecture is suitable to get started with your own system.
As an example, Renumics Spotlight is shown with a 2D UMAP projection of audio embeddings of the EmoDB dataset loaded from Hugging Face. The process of UMAP applied on embeddings generated with an Audio Spectrogram Transformer (paper: https://t.co/H97z06m4zE, model: https://t.co/cMbjOWnznb) is shown in the animation below.
Game changer. You can now visualize your RAG Data.
See how questions, answers, and sources are related.
The animation below shows the UMAP of the embeddings of document snippets, colored by their relevance to the question "Who built the Nürburgring?"
UMAP is dimensionality reduction techniques that transforms complex, high-dimensional data into a clear and interactive 2D map.
It can also be used for debugging and improving the performance of your RAG models.
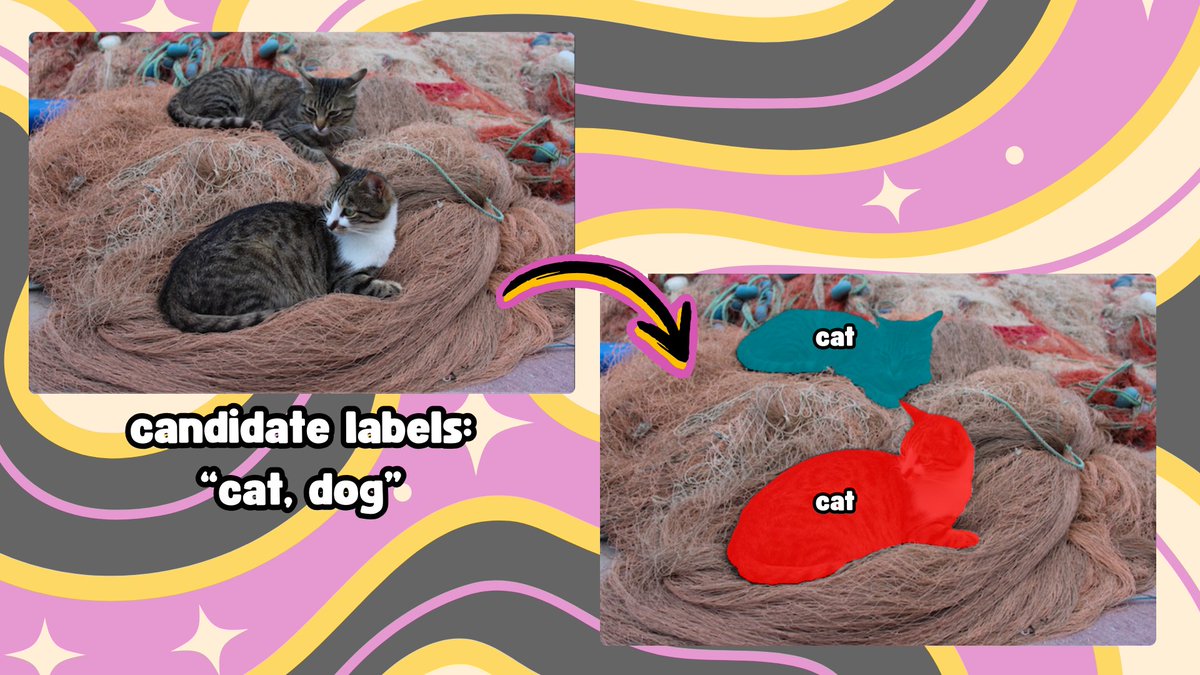
State-of-the-art open-vocabulary segmentation 🚀
I have married Segment Anything with OWLv2 to make SAM text promptable, try it here 👉 https://t.co/tfbqs9mQpK
made with 💗 using @huggingface transformers 🤗
we are happy to see the growing number of articles using our open-source Tool, Renumics Spotlight (github: https://t.co/qW49pbV0SF).
Spotlight's application for #datavisualization in #machinelearning is expanding. We have now compiled more than 15 articles in this list: https://t.co/AFguOe7vdx, which includes insightful articles on #dataexploration and #modeltraining in #computervision:
➡️ "How to Explore and Visualize ML-Data for Object Detection in Images" - Use @Ultralytics YOLOv8 detections and ViT embeddings to visualize and navigate @Voxel51 loaded data in Renumics Spotlight.
➡️ "How I Created an Animation of the Embeddings During Fine-Tuning" - Using @Cleanlab, PCA, and Procrustes to visualize ViT fine-tuning on CIFAR-10.
➡️ "Changes of Embeddings during Fine-Tuning of Transformers" - Using @huggingface Transformers API to fine-tune a ViT and visualize the results with Matplotlib
💬 Perhaps one of these can help with your ML problem. Try it out and let us know what you think, or if you have any suggestions for improvement!
New article: 🔍 How to Explore and Visualize ML-Data for Object Detection in Images.
The article offers a tutorial on how to create an interactive visualization for object detection using Renumics Spotlight (GitHub: https://t.co/qW49pbV0SF). You build a visualization for a @ultralytics YOLOv8 detector for people in images loaded from COCO dataset using @Voxel51 .
Checkout the full article at @ITNEXT_io : https://t.co/MvtiY3qSvc
Hey all, we have published a tutorial on How to build an interactive Hugging Face 🤗 Space for image datasets:
https://t.co/dcxxiwYn1v on the @huggingface Community Blog.
Spotlight, Spotlight Pro, and Spotlight API Docs 1.5.5 have been released at https://t.co/qW49pbV0SF
Features:
- Transmit errors via websockets and display them
- Disable caching of frontend files.
- Rouge score lens.
- Toggle between continuous and discrete coloring
- Rebuild old-style H5 datasets using dataset.rebuild().
- Apply filters on the confusion matrix widget.
- Utilize Mel scale for spectrogram visualization.
Bug Fixes:
-Ensure browser always opens on localhost.
-Adjust color scaling for spectrogram decibel levels.
-Prevent failure when no simple converter is available
-Explicitly fail when data source is not supported.
-Improve appearance of ns-datetimes.
-Avoid reusing the viewer when a new port is assigned.
As #Hacktoberfest 2023 🎃 wraps up, we are grateful for all the contributions from developers and data scientists. 🙏 A big thank you to everyone who contributed and earned their #Renumics T-Shirt. Spotlight now supports showing the BLEU Score and the Levenshtein distance, enhancing the analysis and comparison of text data within your #MachineLearning datasets. 🚀 Good news! Some Renumics T-shirts are still up for grabs! Solve the remaining Hacktoberfest labeled issues (https://t.co/iNqZ2xo68j) and earn yours.
🚀 Spotlight 1.5.4 was released: https://t.co/qW49pbV0SF
New Features
- Show optional windows in sequence lens in inspector widget
- Mark renumics.spotlight.dataset.descriptors as deprecated
Some Bugfixes
- Sequence lens settings icon placement
- F1 metric in metrics widget
- Place by scalar column in similarity map widget
- Serialize PCA result properly
🙌 Big Thank you to the Hacktoberferst Contributors
Excited to release Zephyr-7b-beta 🪁 !
It pushes our recipe to new heights & tops 10x larger models 💪
📝 Technical report: https://t.co/3R4czrpbu5
🤗Model: https://t.co/8uUkvg4E7j
⚔️Evaluate it against 10+ LLMs in the @lmsysorg arena: https://t.co/2cMZRUvhOc
Details in the 🧵
You can now interactively explore your @huggingface dataset with just one line of code with Renumics Spotlight!
This article on the 🤗 blog gives you an introduction: https://t.co/OkBOivzltP
🎉 We’re thrilled to announce that Renumics Spotlight is joining the #Hacktoberfest 2023. Every accepted PR on #GitHub not only elevates your skills and contributions to the #opensource community but also earns you a limited-edition Renumics T-Shirt! https://t.co/nidid57WVd