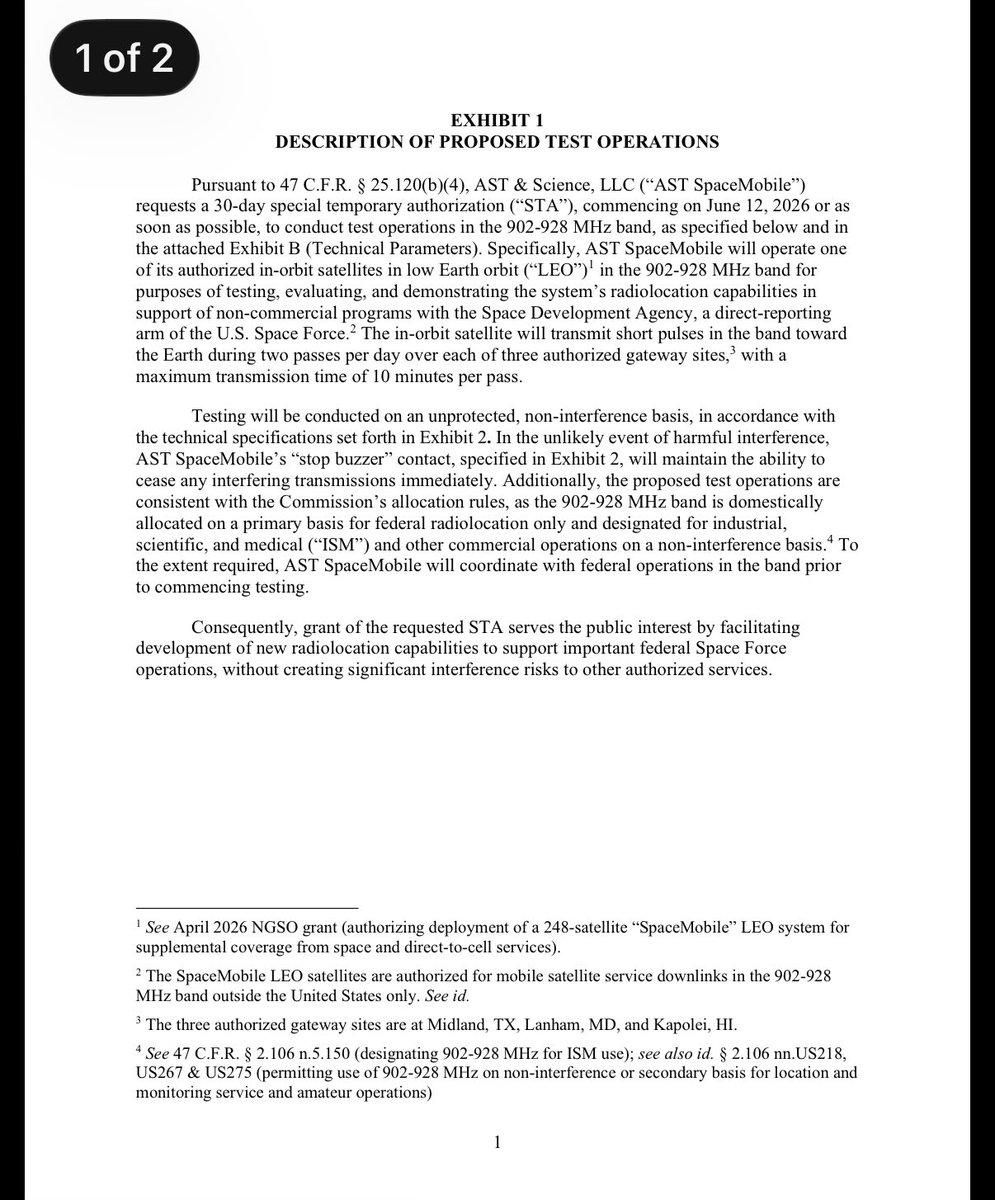
$ASTS: AST SPACEMOBILE REQUESTS STA TO TEST IN THE 902-928 MHZ BAND IN SUPPORT OF NON COMMERCIAL PROGRAMS FOR THE SPACE DEVELOPMENT AGENCY
https://t.co/YgUnY0s1Rn
$ASTS by the close the CMF pulled back from the highs but still closed higher than yesterday. I've marked out some examples in the recent past where CMF often followed price down. This is the only example I've found where a stock has pulled back 30% and the CMF has flatlined near cycle highs.
Ask AI what it means. Generally nothing bearish, but this is very odd behavior to say the least.
I don't think it's explained away by pointing to Space ETFs or Russell recalibration. No other space stock has its CMF at or even near cycle highs, and other stocks that are having Russell recalibration also do not have this current dynamic, not to mention we went through Russell recalibration last year and this did not happen then either.
I also do not believe this is from short covering. Back in 2024 we had enormous short interest and the CMF still would pullback with price. Also when GME was going through its historic short squeeze, the CMF would pullback with price.
If anyone comes across an example of the CMF rising/flat lining while a stock pulls back considerably, please let me know as I'm very interested in finding a precedent for this.
In the meantime, the 100sma and 50sma are two very important levels I will be monitoring next week.
*NFA
$ASTS at the channel support again and 100sma. Also worth noting that if this spot fails we have the 50sma that aligns with the flag breakout retest.
*NFA
$ASTS: Short sellers steadily covering and have probably another 20M shares to go to get back to Feb/Mar levels.
6/4: 61.9M
6/3: 63.5M
6/2: 63.6M
6/1: 64.8M
5/29: 63.6M
Peak 5/15: 69.3M
🚨🚨 $ASTS WEEK IN REVIEW🚨🚨
Blue Origin picks up the shovel and gets to work while $ASTS continues to solidify its moats. That, and more, on this week's Weekly…
Scott waits for a glitch in the matrix when I send out the Weekly on Thursday. This is when he likes to PR things on Friday to f- with me. $ASTS
I'll respect the player if he's been waiting to drop an MLA with SpaceX or a Golden Dome contract the second I show my cards that I'm going to be out of pocket.
I mentioned last month there are catalysts lined up in June that are still brewing and yet to play out. The whole month is going to be exciting. In addition to what I shared before - I think something big is brewing on the defense side of $ASTS . This week, SDA publicly resurfaced the HALO contract. ASTS's Exec VP of Government Ops amplified it. Their VP of Government Ops liked it. Their SVP of Regulatory Affairs is engaging with NTIA's spectrum chief ahead of MILSATCOM next week in Arlington. That's four senior defense and regulatory people all moving at once. Companies don't coordinate visibility like this for no reason.
The only public defense contract we know is for $30M. Why would anyone build a full defense division with an Exec VP, a VP, and a dedicated USG space expert for a $30M contract? Abel burns $400M a quarter. He wouldn't assemble a department unless the pipeline justifies it.
And the satellites are dual-use - same satellites serving @ATT and @VodafoneGroup serve the warfighter. Confirmed by ASTS execs themselves this week. One constellation. Two revenue streams.
Speculative - but I think a major defense announcement is being staged. Timing lines up with SpaceX IPO, BB8-10 launch, and MILSATCOM June 8-10.
NSSL (Not selling a single share - Leo)
NFA.
$ASTS 🛰️
One week later, incredible progress. It’s a 24/7 operation with a solid path forward to launch this year, helped by a lot of luck. @NASA and @USSpaceForce have both been extremely helpful.
This team. Never tell them the odds.
It’s rare to get the opportunity to invest so early as with $ASTS but it’s no longer in pre-revenue or start-up phase.
We will se increasing institutional investment going forward and as the company moves to the next self funding phase a new class of investors will join.
@Reformed_Trader Oh my goodness. What an amazing breakdown of the stock price potential. Thanks a ton for sharing this and explaining it in great detail. “I’ll take UP for $1,000, Alex”
$ASTS I posted on this last week, but I think it's significant enough to revisit.
Since the 2024 low, every local top materialized with bearish divergence on the RSI (5). This means after the initial impulsive move up in price, the RSI also had a large spike to 90, give or take. Then after a pullback in price and RSI it would eventually see higher highs in price but lower highs in RSI indicating weaker strength on the final move higher, which ultimately put in a local top.
This same dynamic of bearish divergence is shown in CADO and CMF, both indicators are related, analyzing money flows/accumulation and distribution and the momentum of accumulation. When ASTS would peak it was under bearish divergence (higher high in price, but lower high in the indicators in view).
Since the recent peak on last Thursday, all three of these indicators were at cycle highs, confirming the impulsive move up. No bearish divergence. There is no prior pattern over the last two years of a top without bearish divergence, meaning very unlikely we have seen the ultimate top.
Additionally, CADO had the largest spike ever on 5/29/26 with a 47.8M print, slightly exceeding its prior record spike of 46.6M, a day off of exactly 2 years ago on 5/30/24. Kind of poetic. This was a record for maximum accumulation momentum.
Accumulation, more often than not, precedes price, meaning the odds of a top being in are very low. The momentum of accumulation matching/slightly exceeding May 30, 2024 is the wild card, as the last time it had similar momentum, it would go on to run another 360% over the next 56 trading days.
To be clear, I do not expect the same exact outcome as that is not how indicators should be interpreted. But it does give me a lot of confidence that a much higher high will come before a top is in.
*NFA
$ASTS orders for 10k or more for 5/29 and 6/2 shows overwhelming accumulation with orders going off at or above the ask. Unfortunately, there's an algo that appears to be very manipulative holding and pushing down the price despite the explosive demand.