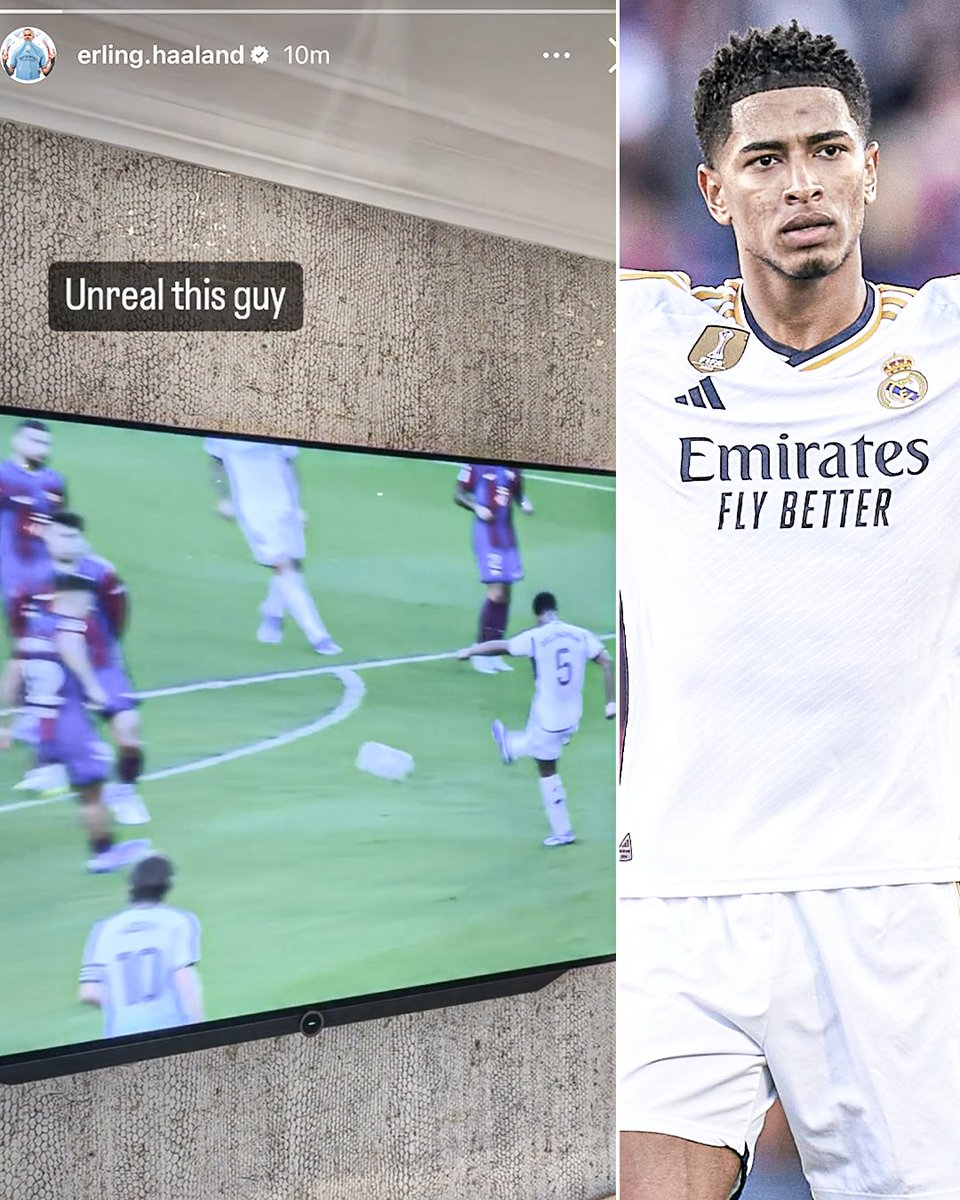
Commentator last night after this Leo Messi wonder assist in the 97th minute :
🗣 "When the Impossible becomes the Easy, and the Magical becomes the Predictable :
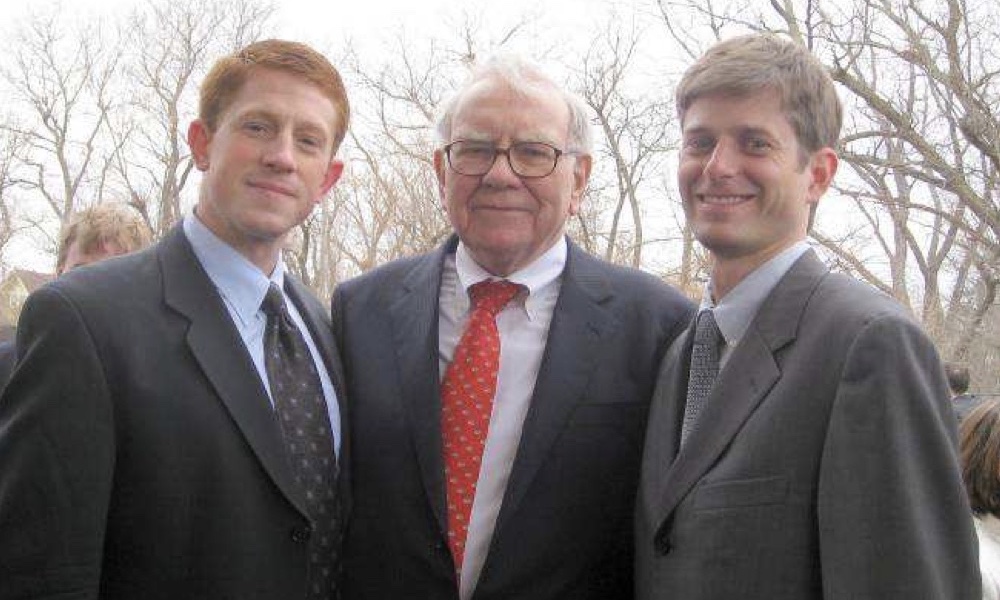
In 2000, a ten year old schoolboy asked Warren Buffett if he was worried about the internet hurting his portfolio companies. The following year, after the internet bubble had begun to pop, he asked Warren if his views on the internet had changed.
15+ years later, in 2017, the schoolboy, now 27 years old and a professional internet investor at his ~20th consecutive Berkshire Hathaway annual meeting, updated his question and asked Warren about the implications of AI on his portfolio.
After hearing Warren's response and reflecting on it, as well as thinking about where his competitive advantages lay and the future he foresaw, he decided to focus on climate and sustainability. And today, he leads sustainability research for Counterpoint Global (home of the great teacher @mjmauboussin), and the subject of this weekend's letter:
Letter #102: Tom Kamei (2023)
This weekend's letter was an essay by written by Tom Kamei, adapted from a talk he gave at Notre Dame. In this letter, Tom discusses the shift from tangible to intangible investments, compares the sustainability wave to the digital wave, sustainability going mainstream, millennials as catalysts, sustainability through a prism, the convergence of profits and purpose, flaws in existing frameworks, measuring externalities, and much more.
Tom is an investor for Counterpoint Global and leads the Sustainability Research integration strategy for the US based funds managed by the team. He was a Fellow at The Aspen Institute in 2015 where he developed a proprietary process to quantify executive compensation alignment. Prior to his current role, Thomas worked with Counterpoint Global for two years as an intern. Previously, he was a research intern at Kleiner Perkins Caufield & Byers where he analyzed late stage private technology businesses for the Green Technology Growth Fund. Thomas received a B.S. in architectural studies from the University of Southern California.
Tom is also one of the most interesting investors out there—he’s an architect by training, a value investor by principle, a tech analyst by practice, and a sustainability researcher by purpose. If you’re wondering how that’s possible, so did I.
The answer is quite simple: He’s been going to the Berkshire Hathaway Annual Meeting every year since 1997, had the pleasure of asking Warren and Charlie several questions (pasted below), and taken their answers seriously.
TK Berkshire Questions:
2000: My name is Thomas Kamei. I am 10 years old and I go to Bacich School in Kentfield, California. I have been a shareholder for two years. This is my third annual meeting. Here’s my question: I know you won’t invest in technology companies, but are you afraid that the internet will hurt some of the companies that you do invest in, such as The Washington Post or Wells Fargo? Thank you. (Morning Session, Question 5.)
2001: Good morning. My name is Thomas Kamei. I am 11 years old and from Kentfield, California. This is my fourth annual meeting. Last year, I asked how the internet might affect some of your holdings. Since a lot of the internet companies have gone out of business, how are — has your view of internet changed? (Morning Session, Question 15.)
2002: Mr. Buffett and Mr. Munger, my name is Thomas Kamei. I am 12 years old. I live in Kentfield, California. This is my fifth annual meeting. I know you lost a lot of money as a result of 9/11. But I would like to know how 9/11 changed your life and your investment strategy? (Morning Session, Question 18.)
2007: Good morning. I’m Thomas Kamei from San Francisco. I’m 17-years-old and this is my tenth consecutive annual meeting. Mr. Buffett and Mr. Munger, I’m curious about what you think is the best way to become a better investor. Should I get an MBA? Get more work experience? Read more Charlie Munger Almanacs or merely is it genetic and out of my hands? (Morning Session, Question 14.)
2017: Hi, Warren. This one’s a fun one. Thomas Kamei is here. He’s a 27-year-old shareholder from Kentfield, California. And I should preface this question by saying that he was here 17 years ago at 10 years old, asked you a question from the audience asking you if the internet might hurt some of Berkshire’s investments. At the time, you said you wanted to see how things would play out. He’s now updated the question. “What do you think about the implications of artificial intelligence on Berkshire’s businesses, beyond autonomous driving and GEICO, which you’ve talked about already? In your conversations with Bill Gates, have you thought through which other businesses will be most impacted? “And do you think Berkshire’s current businesses will have a significantly — will have significantly more or less employees a decade from now as a function of artificial intelligence?”(Afternoon Session, Question 13.)
Two decades after asking Warren and Charlie about the internet, and after one decade as an internet analyst, Tom is now focused on sustainability research and investing. He has total conviction that the for-profit mechanism is a powerful lever to unleash humanity’s ingenuity and can help solve society’s most intractable issues while creating trillions of equity value along the way.
I hope you enjoy this essay as much as I did!
[Full Essay in Bio]
Students at NYU asked the creators of South Park the million-dollar question:
“What makes a good story?”
They gave one of the best explanations of story I’ve heard:
“If we can take the beats of your outline, and the words ‘and then’ belong between those beats… you got something pretty boring.
What should happen between every beat you’ve written down is the words ‘therefore’ or ‘but.’”
They go on to say, “That gives you the causation between each beat, and that makes a story.”
Point 1:
There’s an idea in storytelling called ‘Promise, Progress, Payoff.’
Essentially, a story is a neverending cycle of promises that are paid off over the span of the story.
It’s a cycle of expectation and resolution. Cause and effect. Conflict and progress.
Point 2:
A story isn’t a bunch of random events thrown together.
A story is a series of but / because / therefore moments.
A famous example:
• Harry discovers he's a wizard. Because of this, he goes to learn magic at Hogwarts.
• But then he learns Voldemort wants to kill him and rule the world.
• Therefore, he must find a way to defeat him.
Point 3:
‘And’ implies a simple continuation.
‘But / Therefore’ give prior events meaning through causation.
‘But’ implies conflict. ‘Therefore’ implies progress.
I’m reminded of a Hemingway quote:
“Prose is architecture, not interior decoration.”
Great writing is intentional. It doesn’t wander. It builds upon itself.
***
I hope you enjoyed that! If so, follow @nathanbaugh27. I study the best storytellers ever and share what I learn.
The strongest predictor of heart health is not your LDL or total cholesterol
But the ratio between your triglycerides & your HDL
It's an excellent predictor of overall metabolic health too!
Both can typically be found in routine lab work
Here's where you want to be
THREAD
THIS WEEK’S HIGHLIGHTS ⚠️
1. The Federal Reserve's total balance sheet DECREASED by $21.15 billion and now stands at $8.34 trillion. The increase in balance sheet seen as a result of recent stress in the banking sector has almost been entirely erased by the Fed’s ongoing QT.
2. US financial institution emergency borrowing INCREASED by $347 million, now standing at $106.3billion. Discount window (DW) borrowing INCREASED by literally $1 million, now at $3.209 billion. Borrowing via the Bank Term Funding Program (BTFP) INCREASED by $346 million, now at $103 billion.
• The DW and the BTFP are both means by which financial institutions can borrow emergency liquidity from the Fed. The DW has been around since 1914 while the BTFP was created in response to the banking crisis that started in March. The DW offers shorter term lending (up to 90 days) than the BTFP (up to 1 year); on top of this, the BTFP is more generous in than the DW, banks can post collateral (usually in the form of US treasury bonds, agency MBS, etc) at the Fed at par value, essentially meaning price fluctuations in banks' assets are ignored by the Fed when being used as collateral. This was designed so that banks are not forced to sell underwater portfolios and realise massive losses. To top it off, lending through the BTFP is done at Fed Funds + 0.1%.
3. US GDP final estimate for Q1 were released, coming in higher than expected at an annualized 2% (Exp. 1.4%, Prev. 2.6%, Revised from 1.3%). Consumer spending increased +4.2% QoQ, revised upwards in the latest figures.
4. US CB Consumer Confidence for June came in hotter than expected and increased to 109.7 (Exp. 103.85, Prev. 102.3) suggesting a more optimistic consumer and providing the highest reading since Jan 22. The expectations index, despite also improving, has remained below a reading of 80 since Dec 22; the is the level that is supposed to indicate recession within the next 12 months.
• Consumer confidence is monitored to predict future consumer spending patterns. This index, based off collated responses of appox. 5000 US households, tracks consumer current and future buying intentions, vacation plans, as well as consumer expectations for inflation, stock prices, and interest rates. Consumer spending accounts for around 70% of US GDP generation.
5. PCE price index fell in line with expectations to 3.8% (Exp. 3.8%, Prev. 4.4%, revised to 4.3%) in May and increased 0.1% MoM. Core PCE Price Index declined to 4.6% (Exp.4.7%, Prev. 4.7%) YoY.
• Core PCE (excluding food and energy) is widely known to be the Federal Reserve’s preferred measure of inflation. Although core PCE came in lower than the prior month, it is still running at YoY levels that remain VERY sticky, essentially since late 2022. However, a notable metric that Powell is known to follow closely, core services inflation ex-housing, increased only 0.2% MoM. This is the softest increase for 10 months and could indicate that the Fed are starting to see some early signs of progress in areas they have been hoping for.
6. The Federal Reserve published the results of the annual bank stress test, this year testing 23 of the largest US banks. The test essentially simulates hypothetical adverse economic scenarios to evaluate how banks would fare under severe economic conditions and evaluate systemic risk should those scenarios play out.
Overview of the published findings:
• All 23 banks tested remained above their minimum capital requirements during the hypothetical recession, despite total projected losses of $541 billion- $424 billion in loan losses, $18 billion in additional items such as loans booked under fair value, $94 billion in trading and counterparty losses, $5 billion in securities losses
• Under the most severe stress test scenario aggregate CET1 capital ratio falls to 10.1% from 12.4% (Q4 22). The minimum regulatory capital ratio is 4.5%
• Lowest minimum CET1 ratio in severe scenario - Citizens at 6.4% (regulatory minimum 4.5%)
• Highest minimum CET1 ratio in severe scenario - Charles Schwab Corp 22.8%
• Banks with concentrations in mortgages, credit cards, and commercial real estate generally had larger declines in capital ratios in the stress test this year
Why do they focus on CET1?
CET1 is considered the most loss absorbing form of capital a bank has. It is the first form of capital to bear losses in the event of a bank's failure/severe distress and for large banks there are minimum regulatory requirements for the amount of CET1 they must have relative to risk weighted assets.
Risk-weighted assets are bank assets, including loans, mortgages, securities, and other risk exposed investments.
7. US home prices fell YoY for the first time since 2012 in April according to the S&P/Case-Shiller national index, coming in at -0.2%. However, prices increased 1.3% MoM (seasonally adjusted 0.5%) and are up 2.3% since the start of the year.
• The index provides not nationwide insight but is also flagging up some significant discrepancies in performance between cities and regions.
Some of the best performing cities YoY include Miami +5.2%, Chicago 4.1%, Atlanta 3.5% vs worst performing Seattle -12.4%, San Francisco -11.1%. The Southeast remains the best performing region at +3.6% YoY while the West remains the worst performing at -6.9%.
• Worth pointing out that due to data being from the three months leading to April, this is an index that operates with a significant lag and doesn’t necessarily reflect current conditions or changes in prices since.
8. Unsurprisingly given recent hot housing starts data and construction data, new home sales came in red hot at +12.2% MoM (Exp. -1.2%, Prev. 3.5%). There is a current lack of existing home inventory. This is caused by people (understandably) resisting swapping a low rate mortgage for a rate ~7%. The shift to new homes is compounded by the fact that new home builders are providing financial incentives like buydowns during a time when mortgage payments are through the roof.
9. Pending home sales fell -22.2% YoY in May (Prev. 20.6%) and -2.7% MoM, suggesting a continued slowdown in housing activity for existing homes when compared to the year prior.
• This measures the number sales of existing homes that have been agreed (contract signed) but have not yet been finalised in the US. It is a leading indicator for the US housing market. While new home sales are showing strength, existing home sales account for 90% of the US housing market and are far from it.
10. US Durable Goods came in hotter than expected at 1.7% (Exp. -1%, Prev. 1.2%) MoM, suggesting demand in the US is proving to be more resilient than anticipated. This makes the third month in a row of positive MoM readings. Non-Defence goods excluding aircraft (seen as a better indicator of business spending) also came in hotter than expected at 0.7% (Exp. 0%, Prev. 0.6%).
• May saw +3.9% in transport (mainly driven by non-defence aircraft and parts +32.5%), motor vehicles +2.2%. New orders increased 0.6% MoM and capital goods +2.8% (capital goods are generally bought by businesses in order to generate more revenue e.g., machinery for production).
• Durable goods provide data on the value of orders, shipments, and inventories of products designed to last at least three years. It gives insight into business investment. Durable goods are often expensive and businesses that think near term economic outlook is poor may hold off on making large investments in order to be more conservative and protect their balance sheet.
11. Dallas Fed Manufacturing Index showed ongoing contraction in June, but an improvement from the prior month coming in at -23.2 (Expected -26.5, Previous -29.1). Texas produces approximately 10% of manufacturing output in the US so is a key indicator of manufacturing activity in the US.
12. Eurozone consumer inflation data demonstrated continued declines in headline, associated with drops in energy prices. However, core inflation unexpectedly increased in Germany and came in hotter than expected in Spain:
• Eurozone 5.5% (Exp. 5.6%, Prev. 6.1%)
Core 5.4% (Prev. 5.3%)
• Spain 1.9% (Exp. 1.7%, Prev. 3.2%)
Core 5.9% (Prev. 6.1%)
• German 6.4% (Exp. 6.3%, Prev.6.1%)
Core 5.8% (Prev. 5.4%)
Eurozone core inflation re-accelerating makes the ECB more likely to proceed with their forecast rate hike at their next meeting at minimum, not that there is much doubt as Christine Lagarde has all but promised it.
Despite this, producer inflation figures for some countries like Spain and Italy are now printing in full deflation while Germany is printing at 1% YoY (pushed mainly by energy price declines). This could signal that consumer inflation in the economic area will fall in the coming months.
13. The German IFO business climate declined to the lowest reading in 6 months, suggesting further troubled waters ahead. The reading for June came in at 88.5 (Exp. 90.7, Prev. 91.5). Notably services, which have been very resilient despite manufacturing contraction, showed signs of weakening and worsening expectations.
• IFO Business Climate measures business sentiment in Germany through monthly surveys of around 9000 businesses across manufacturing, construction, wholesaling, and retailing sectors. Respondents are asked to assess their current situation as well as their forecast for the next 6 months. Readings below 100 indicate an overriding pessimistic outlook.
14. German Gfk Consumer Confidence also decreased for the first time in 9 months for July at -25.4 (Exp. -23 ,Prev.24.4). The decline was predominantly due to expectations of economic performance and income.
• A reading of 0 represents that historical average consumer sentiment in the country.
15. Unemployment rate in Germany also increased to 5.7% (Exp. 5.6%, Prev. 5.6%)
16. Eurozone Economic Sentiment Index (ESI) for June came in at the lowest reading since November 2022 at 95.3 (Exp. 96, Prev. 96.4).
• The ESI surveys businesses from multiple sectors to gauge economic sentiment in the area. A reading of 100 signifies average economic sentiment.
-
The US economy has proven to be significantly more resilient than most people anticipated during the fastest hiking cycle in history.
The bank stress test this week showed acceptable performance of the largest banks in the US. However, only banks >$250 billion in assets are tested every year. Many of the recent issues in the banking sector came from regional banks, small enough to not be tested every year e.g. SVB, Signature. If recent regional collapses were enough to cause systemic risk then it begs the question of how useful the stress tests actually are for assessing systemic risk potential.
A mixed picture can be seen in the housing market. New homes are seeing a surge in activity as home builders provide financial incentives and existing home owners remain reluctant to sell into the highest rate environment for decades. Whilst unemployment remains low, this is likely to persist, as few are forced to sell their home.
As far as the Eurozone is concerned, data coming out of Germany continues to disappoint and core inflation came in hotter than anticipated. The ECB are very likely going to hike at their next meeting, despite the largest constituent economic member continuing to struggle.
US inflation remains very elevated and the Fed have forecast up to two further rate hikes in 2023, as the economy remains resilient.
Going into next week markets are currently pricing in an 84.3% chance of a rate hike at the Federal Reserve's next meeting.
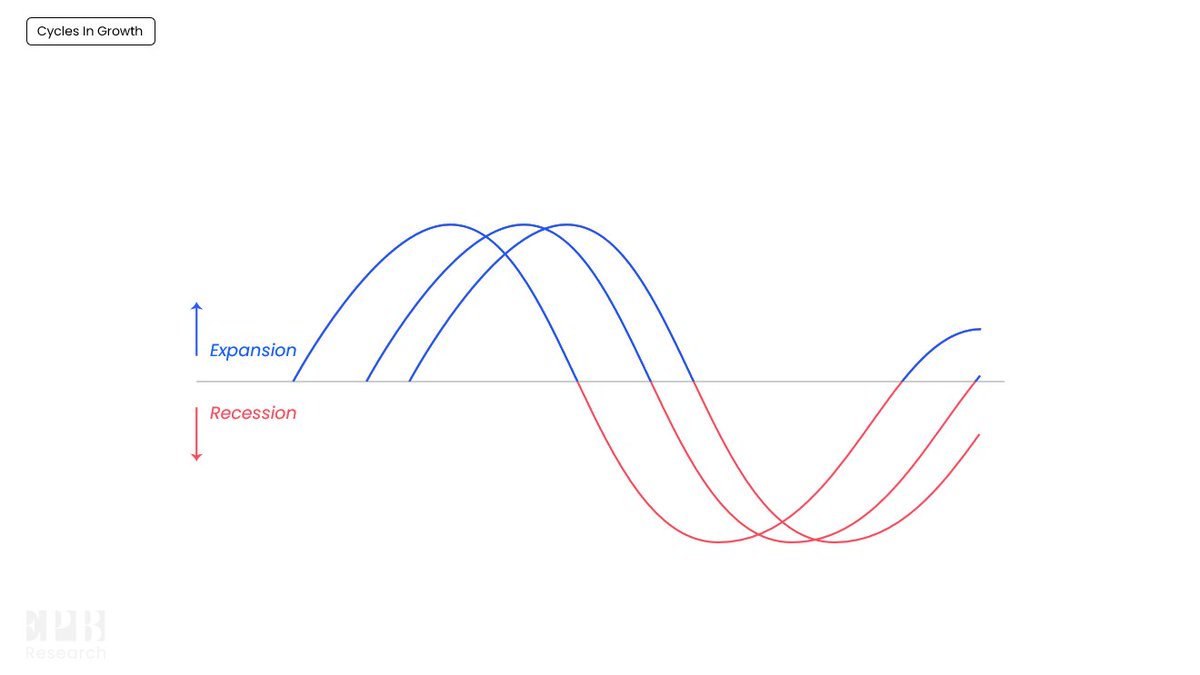
The reason I focus so much on the "sequence" of the cycle is because it's the one thing that remains the same across time.
It's what gives the cycle its rhythm.
1/
Thank you, Supreme Court.
Canceling Student Loans without compensation for those who paid their way/reimbursed is immoral & exacerbates moral hazard.
NVIDIA ($NVDA) is now trading at 37 times its revenue (P/S) and 202 times its earnings (P/E)!
Now's the right time to remember what Scott McNealy, CEO of Sun Microsystems told Bloomberg just after the dot-com collapse 👇
I rarely pay attention to macro forecasts. I’d rather spend time looking for great businesses selling cheap.
However, one person I listen to on macro is Stan Druckenmiller. Just finished listening to his presentation at the USC 🧵👇
1/15
“I am worried there are more “dead bodies” ahead, I just don’t know where they are. I knew them in ‘07-08. I don’t think SVB was the last one.”
/END
https://t.co/2kdTSZUrNC
In 2008, a group of Columbia Business School students made the pilgrimage to Omaha to meet with Warren Buffett. $BRK.A $BRK.B
As luck would have it, this occurred one week after the collapse of Bear Stearns in the early stages of the GFC.
Here's what the Oracle had to say...
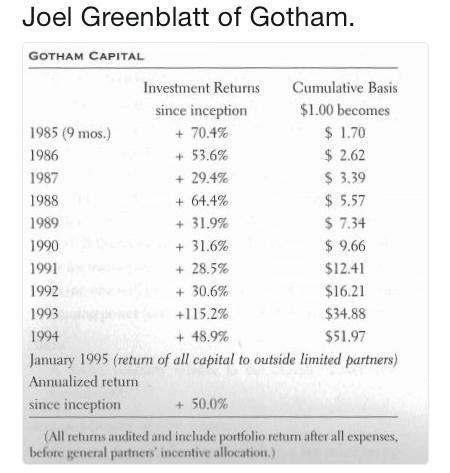
1/ Joel Greenblatt returned +5.097% from 1985 to 1994.
For anyone who want's to become a serious investor, studying him was the best thing I ever did.
Below are his interviews, classes and anything related to him that I've been studying. ⬇️


![kevg1412's tweet photo. In 2000, a ten year old schoolboy asked Warren Buffett if he was worried about the internet hurting his portfolio companies. The following year, after the internet bubble had begun to pop, he asked Warren if his views on the internet had changed.
15+ years later, in 2017, the schoolboy, now 27 years old and a professional internet investor at his ~20th consecutive Berkshire Hathaway annual meeting, updated his question and asked Warren about the implications of AI on his portfolio.
After hearing Warren's response and reflecting on it, as well as thinking about where his competitive advantages lay and the future he foresaw, he decided to focus on climate and sustainability. And today, he leads sustainability research for Counterpoint Global (home of the great teacher @mjmauboussin), and the subject of this weekend's letter:
Letter #102: Tom Kamei (2023)
This weekend's letter was an essay by written by Tom Kamei, adapted from a talk he gave at Notre Dame. In this letter, Tom discusses the shift from tangible to intangible investments, compares the sustainability wave to the digital wave, sustainability going mainstream, millennials as catalysts, sustainability through a prism, the convergence of profits and purpose, flaws in existing frameworks, measuring externalities, and much more.
Tom is an investor for Counterpoint Global and leads the Sustainability Research integration strategy for the US based funds managed by the team. He was a Fellow at The Aspen Institute in 2015 where he developed a proprietary process to quantify executive compensation alignment. Prior to his current role, Thomas worked with Counterpoint Global for two years as an intern. Previously, he was a research intern at Kleiner Perkins Caufield & Byers where he analyzed late stage private technology businesses for the Green Technology Growth Fund. Thomas received a B.S. in architectural studies from the University of Southern California.
Tom is also one of the most interesting investors out there—he’s an architect by training, a value investor by principle, a tech analyst by practice, and a sustainability researcher by purpose. If you’re wondering how that’s possible, so did I.
The answer is quite simple: He’s been going to the Berkshire Hathaway Annual Meeting every year since 1997, had the pleasure of asking Warren and Charlie several questions (pasted below), and taken their answers seriously.
TK Berkshire Questions:
2000: My name is Thomas Kamei. I am 10 years old and I go to Bacich School in Kentfield, California. I have been a shareholder for two years. This is my third annual meeting. Here’s my question: I know you won’t invest in technology companies, but are you afraid that the internet will hurt some of the companies that you do invest in, such as The Washington Post or Wells Fargo? Thank you. (Morning Session, Question 5.)
2001: Good morning. My name is Thomas Kamei. I am 11 years old and from Kentfield, California. This is my fourth annual meeting. Last year, I asked how the internet might affect some of your holdings. Since a lot of the internet companies have gone out of business, how are — has your view of internet changed? (Morning Session, Question 15.)
2002: Mr. Buffett and Mr. Munger, my name is Thomas Kamei. I am 12 years old. I live in Kentfield, California. This is my fifth annual meeting. I know you lost a lot of money as a result of 9/11. But I would like to know how 9/11 changed your life and your investment strategy? (Morning Session, Question 18.)
2007: Good morning. I’m Thomas Kamei from San Francisco. I’m 17-years-old and this is my tenth consecutive annual meeting. Mr. Buffett and Mr. Munger, I’m curious about what you think is the best way to become a better investor. Should I get an MBA? Get more work experience? Read more Charlie Munger Almanacs or merely is it genetic and out of my hands? (Morning Session, Question 14.)
2017: Hi, Warren. This one’s a fun one. Thomas Kamei is here. He’s a 27-year-old shareholder from Kentfield, California. And I should preface this question by saying that he was here 17 years ago at 10 years old, asked you a question from the audience asking you if the internet might hurt some of Berkshire’s investments. At the time, you said you wanted to see how things would play out. He’s now updated the question. “What do you think about the implications of artificial intelligence on Berkshire’s businesses, beyond autonomous driving and GEICO, which you’ve talked about already? In your conversations with Bill Gates, have you thought through which other businesses will be most impacted? “And do you think Berkshire’s current businesses will have a significantly — will have significantly more or less employees a decade from now as a function of artificial intelligence?”(Afternoon Session, Question 13.)
Two decades after asking Warren and Charlie about the internet, and after one decade as an internet analyst, Tom is now focused on sustainability research and investing. He has total conviction that the for-profit mechanism is a powerful lever to unleash humanity’s ingenuity and can help solve society’s most intractable issues while creating trillions of equity value along the way.
I hope you enjoy this essay as much as I did!
[Full Essay in Bio]](https://pbs.twimg.com/media/F10WadhaUAAz63w.jpg)





![kevg1412's tweet photo. In 2000, a ten year old schoolboy asked Warren Buffett if he was worried about the internet hurting his portfolio companies. The following year, after the internet bubble had begun to pop, he asked Warren if his views on the internet had changed.
15+ years later, in 2017, the schoolboy, now 27 years old and a professional internet investor at his ~20th consecutive Berkshire Hathaway annual meeting, updated his question and asked Warren about the implications of AI on his portfolio.
After hearing Warren's response and reflecting on it, as well as thinking about where his competitive advantages lay and the future he foresaw, he decided to focus on climate and sustainability. And today, he leads sustainability research for Counterpoint Global (home of the great teacher @mjmauboussin), and the subject of this weekend's letter:
Letter #102: Tom Kamei (2023)
This weekend's letter was an essay by written by Tom Kamei, adapted from a talk he gave at Notre Dame. In this letter, Tom discusses the shift from tangible to intangible investments, compares the sustainability wave to the digital wave, sustainability going mainstream, millennials as catalysts, sustainability through a prism, the convergence of profits and purpose, flaws in existing frameworks, measuring externalities, and much more.
Tom is an investor for Counterpoint Global and leads the Sustainability Research integration strategy for the US based funds managed by the team. He was a Fellow at The Aspen Institute in 2015 where he developed a proprietary process to quantify executive compensation alignment. Prior to his current role, Thomas worked with Counterpoint Global for two years as an intern. Previously, he was a research intern at Kleiner Perkins Caufield & Byers where he analyzed late stage private technology businesses for the Green Technology Growth Fund. Thomas received a B.S. in architectural studies from the University of Southern California.
Tom is also one of the most interesting investors out there—he’s an architect by training, a value investor by principle, a tech analyst by practice, and a sustainability researcher by purpose. If you’re wondering how that’s possible, so did I.
The answer is quite simple: He’s been going to the Berkshire Hathaway Annual Meeting every year since 1997, had the pleasure of asking Warren and Charlie several questions (pasted below), and taken their answers seriously.
TK Berkshire Questions:
2000: My name is Thomas Kamei. I am 10 years old and I go to Bacich School in Kentfield, California. I have been a shareholder for two years. This is my third annual meeting. Here’s my question: I know you won’t invest in technology companies, but are you afraid that the internet will hurt some of the companies that you do invest in, such as The Washington Post or Wells Fargo? Thank you. (Morning Session, Question 5.)
2001: Good morning. My name is Thomas Kamei. I am 11 years old and from Kentfield, California. This is my fourth annual meeting. Last year, I asked how the internet might affect some of your holdings. Since a lot of the internet companies have gone out of business, how are — has your view of internet changed? (Morning Session, Question 15.)
2002: Mr. Buffett and Mr. Munger, my name is Thomas Kamei. I am 12 years old. I live in Kentfield, California. This is my fifth annual meeting. I know you lost a lot of money as a result of 9/11. But I would like to know how 9/11 changed your life and your investment strategy? (Morning Session, Question 18.)
2007: Good morning. I’m Thomas Kamei from San Francisco. I’m 17-years-old and this is my tenth consecutive annual meeting. Mr. Buffett and Mr. Munger, I’m curious about what you think is the best way to become a better investor. Should I get an MBA? Get more work experience? Read more Charlie Munger Almanacs or merely is it genetic and out of my hands? (Morning Session, Question 14.)
2017: Hi, Warren. This one’s a fun one. Thomas Kamei is here. He’s a 27-year-old shareholder from Kentfield, California. And I should preface this question by saying that he was here 17 years ago at 10 years old, asked you a question from the audience asking you if the internet might hurt some of Berkshire’s investments. At the time, you said you wanted to see how things would play out. He’s now updated the question. “What do you think about the implications of artificial intelligence on Berkshire’s businesses, beyond autonomous driving and GEICO, which you’ve talked about already? In your conversations with Bill Gates, have you thought through which other businesses will be most impacted? “And do you think Berkshire’s current businesses will have a significantly — will have significantly more or less employees a decade from now as a function of artificial intelligence?”(Afternoon Session, Question 13.)
Two decades after asking Warren and Charlie about the internet, and after one decade as an internet analyst, Tom is now focused on sustainability research and investing. He has total conviction that the for-profit mechanism is a powerful lever to unleash humanity’s ingenuity and can help solve society’s most intractable issues while creating trillions of equity value along the way.
I hope you enjoy this essay as much as I did!
[Full Essay in Bio]](https://pbs.twimg.com/media/F10W-f-aQAE5sgA.jpg)