@badlogicgames I'll play good cop to the bad cops; hey Anthropic, I'm not allowed to use Pi on my work subscription, but I will get a 5x Max if you specifically allow Pi to use subs!
Me:
"No worries, I'll just create an ifelse(weekNumber == 1, 52, lastWeekNumber)"
some years have 53 weeks has entered the chat together with Meriam-Webster:
"hubris: exaggerated pride or self-confidence"
I regret my life choices..
2/2
Me, writing a function to handle calculations on a weekly basis for this and last week:
"Hm, this works well. Haha, I am done! "
weekNumber == 1 has entered the chat:
"Lol what about your precious lastWeekNumber == 0 now, eh? "
1/2
#rstats
@BAT_AUS95@rmarkdown Ah, yes. "Not worth my time" == "don't have a sub and haven't read it". The point the article was trying to make, is that there are better alternatives. But you do you, I'm done with this discussion 👋
@BAT_AUS95@rmarkdown The p-value was one example, the point was that getting the coefficients from a model object using summary() is not very efficient. And "I would need" is a way of writing. But I get it, you want to criticise and not offer a bette way. Take care 🙃
@BAT_AUS95@rmarkdown I am saying that you should NOT do that, but that people are doing it (and that they should stop), but ok - show us how you do it? Build a model, and then access the coeffeficients in a way that allows you to plot them along with the regression line.
@BAT_AUS95@rmarkdown The premise for using alternatives to summmary() is not that you should be using that method, it is (among others) that accessing model information is easier using other functions.
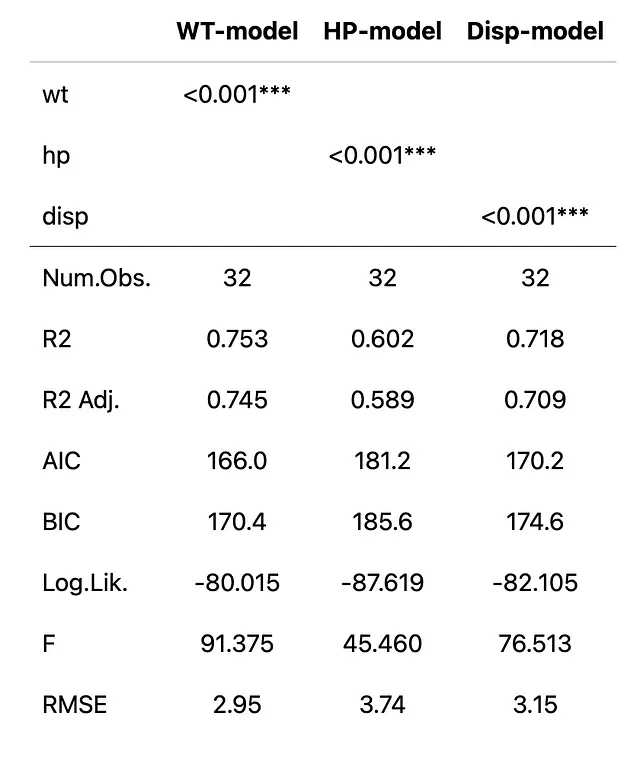
@TamsGeorge1 @engkohnometrics @rmarkdown Mostly it's down to personal preference, but I find the syntax of modelsummary easier. Compare this:
https://t.co/HErHRpVwub
which creates three models and compares them to the same in stargazer, where you need to define the modles first etc.
@TamsGeorge1 @engkohnometrics @rmarkdown I think I prefer modelsummary to stargazer. Modelsummary can also group models, and supports html, docx, tex, md, txt, latex and png as output. You can also extend the functionality using packages like gt, kableExtra, flecxtable and huxtable.
@jim_bouldin @TamsGeorge1@rmarkdown If your definition of not a problem is “can I still do it?” then no, it’s not, depending on what you are trying to do. If you want to compare different models, check something more than R-squared etc, then summary() will not be very efficient
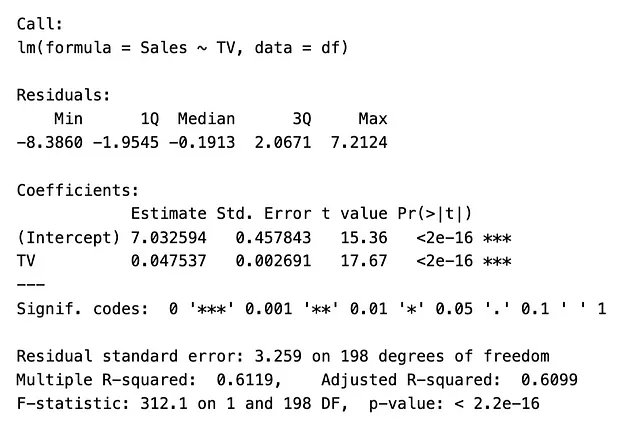
@TamsGeorge1@rmarkdown The first image is from summary(), the second from tidy() and the third from modelsummary(). The broom package creates a nice tibble, and the modelsummary package works very well with packages such as gt, dt etc. to create nice looking and customizable tables.
@TamsGeorge1@rmarkdown Certainly. In the article, I mention how the output of summary() calls is quite messy vs. the output of packages such as broom and modelsummary. Additonally, accessing elements in the summary() output is quite counter-intuitive, vs. the output from tidy() or modelsummary().
Are you still using summary() to view information about your model in R? If so, I have some tips for you. Using broom and tidy()? It's relevant for you too!
https://t.co/ZbdJHxFK9l
#rstats
Seven years of making mistakes and trying to learn from them has made me a slightly better coder that still makes a lot of stupid mistakes 😂
https://t.co/WQgqn41A01
#rstats#codinglife
@ZahierNasrudin@rmarkdown If you register you get one free article, but the main reasons were copilot (which RStudio didn’t have when I switched), extensions and customization.