To start with Machine Learning, take these 2 free courses:
• Introduction to Python Programming (Udacity) • Machine Learning Crash Course (Google)
If you need a bit more time before diving deeper, finish the following Kaggle tutorials:
• Intro to Machine Learning • Intermediate Machine Learning
At this point, you are ready to finish your first project: The Titanic Challenge on Kaggle.
It's a simple project but a small step to get you going.
If math is not your strong suit, don't worry. I recommend not spending too much time learning math before writing code.
Instead, learn anything you need as you stumble upon new concepts.
From here, take the Machine Learning specialization in Coursera. This course is more advanced, and it will stretch you out a bit.
The top universities worldwide have published their Machine Learning and Deep Learning classes online. Here are some of them:
• MIT 6.S191 Introduction to Deep Learning • DS-GA 1008 Deep Learning • UC Berkeley Full Stack Deep Learning • UC Berkeley CS 182 Deep Learning • Cornell Tech CS 5787 Applied Machine Learning
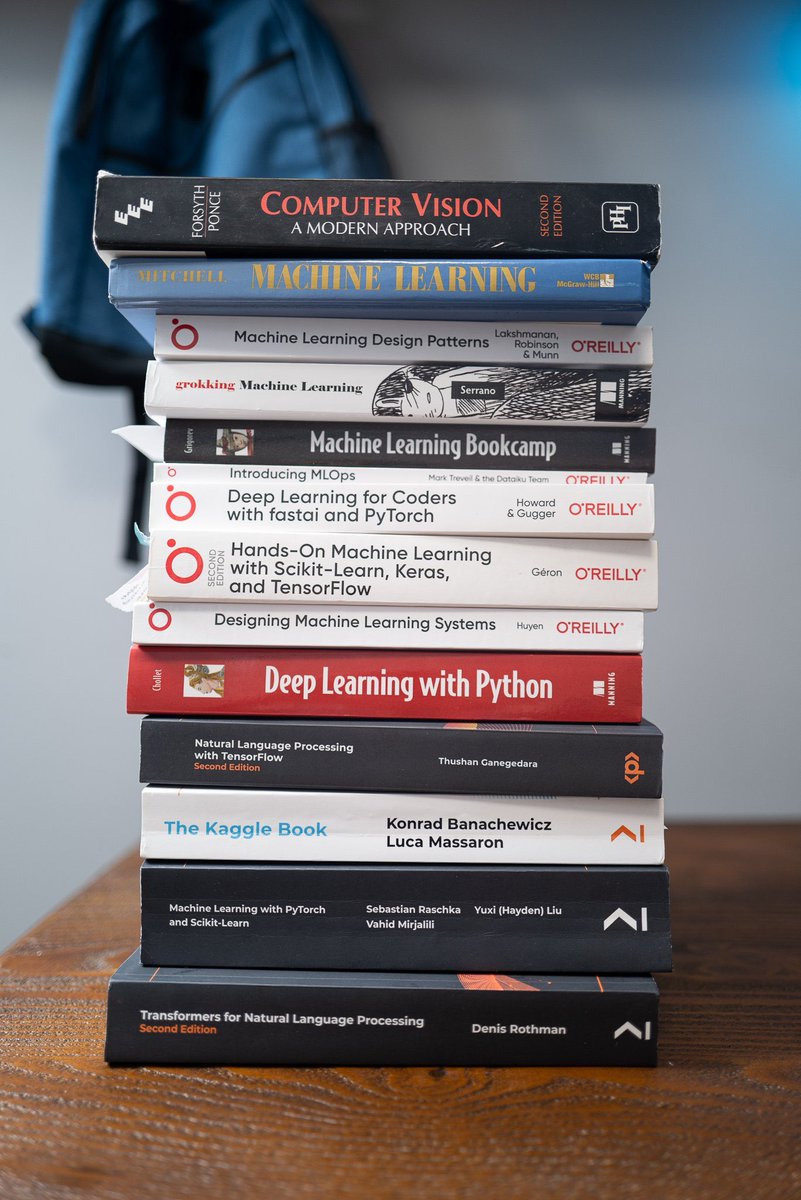
Many different books will help you. The attached image will give you an idea of some of my favorite ones.
Finally, keep these three ideas in mind:
1. Start by working on popular problems that another 100,000 people have solved before. This will ensure that you can find help whenever you get stuck.
2. Find opportunities to share what you learn. Whenever you try, you'll realize how little you know.
3. You'll never be done. There's no finish line. Learning is a lifelong pursuit. I started when I was 14, and I'm now 43 and still know very little. The good news is that you only need a tiny bit to build a fantastic career in this field.
Focus on making progress one day at a time and WRITE. MORE. CODE.
That's how you win.
Boxplots are one of the most useful tools in my Data Science arsenal. In 6 minutes, I'll teach you 6 years of using box plots for EDA and problem-solving. Let's dive in.
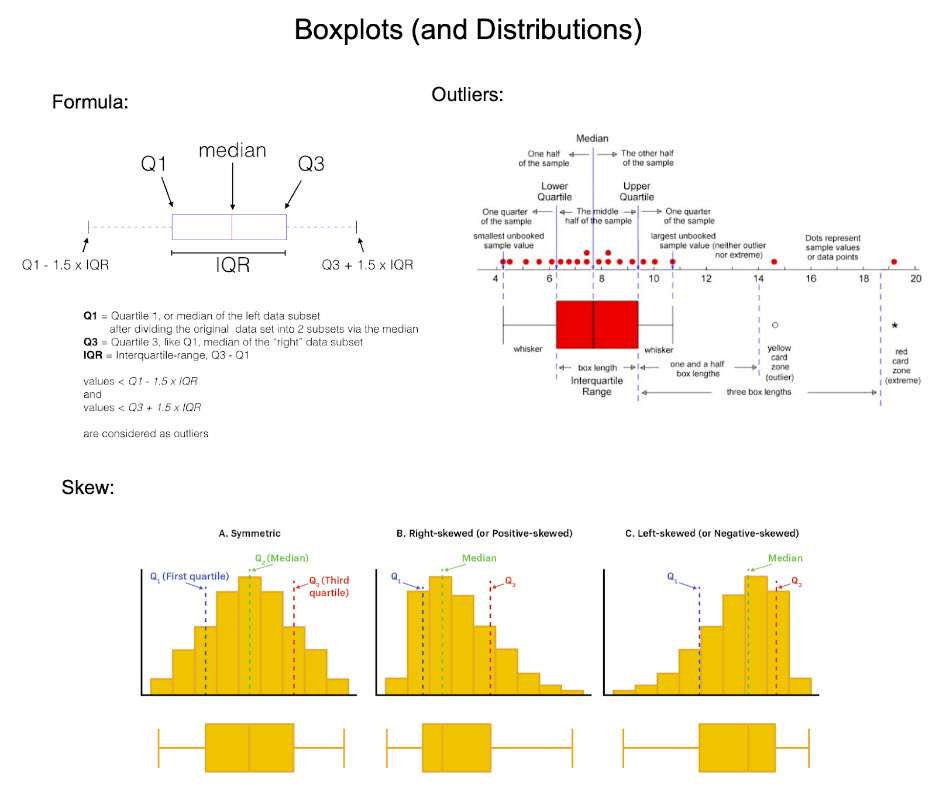
1. What is a boxplot? A boxplot is a standardized way of displaying the distribution of data based on a five-number summary: minimum, first quartile (Q1), median, third quartile (Q3), and maximum.
2. Invention: The boxplot was invented in 1969 by John Tukey, as part of his pioneering work in data visualization. Tukey's EDA emphasized the importance of using simple graphical and numerical methods to start understanding the data before making any assumptions about its underlying distribution or applying complex statistical models. The boxplot emerged from this philosophy. Tukey's boxplot was designed to be a quick and easy way to visualize the distribution of data.
3. Usage: I use boxplots during the exploratory phase. First, I assess correlations to an outcome I am interested in. Then I explore the top features during Exploratory Data Analysis (EDA). Boxplots are heavily used in my EDA.
4. Key Features of Boxplots: In one quick visualization, boxplots display distribution summary, outliers, skewness, and it facilitates comparisons between multiple groups or categories.
5. The Box: The box spans from the first quartile (Q1) to the third quartile (Q3). This range, known as the interquartile range (IQR), contains the middle 50% of the data. The line inside the box represents the median (the second quartile, Q2), which divides the dataset into two equal halves.
6. The Whiskers: The whiskers extend from the box to show the range of the data. A common approach is to extend them to the smallest and largest values within 1.5 times the IQR from the first and third quartiles, respectively. Data points outside this range are considered outliers and are sometimes plotted as individual points.
7. Outliers: These are data points that lie beyond the end of the whiskers. They are not part of the bulk of the data and may indicate variability in the data, experimental errors, or novel findings. Explore these!
8. Skewness: If the median is not equidistant from Q1 and Q3, or if the whiskers are of unequal lengths, it suggests that the data is skewed.
9. Key Issues: One issue I run into commonly is multimodal distributions (these are distributions with multiple "humps" like a camel's back). These usually indicate a group-wise pattern, which needs to be explored by group.
===
There’s a lot more to learning Data Science for Business than understanding distributions, boxplots, and outliers.
I’d like to help.
I put together a free on-demand workshop that covers the 10 skills that helped me make the transition to Data Scientist: https://t.co/LR39RJ5XKB
And if you'd like to speed it up, I have a live workshop where I'll share how to use ChatGPT for Data Science: https://t.co/EaMpKrJiqX
If you like this post, please reshare ♻️ it so others can get value.
Massive day in the world of AI today.
Huge developments from Amazon, Rabbit R1, CES 2024, Microsoft, Luma, Meta, Cognosys, Mcafee, Google, and 11 new AI tools.
Here's EVERYTHING you need to know:
How To LLM Over Structured Data vs. Unstructured Data
Enterprises have their data in multiple places - e.g Snowflake, GDrive or Salesforce. The data is typically a combination of both structured and unstructured data and typically exists in different formats - CSV, PDF, Word etc
PDF docs with complex tables can get quite gnarly and often times the structured and unstructured data is mixed in together.
So how exactly do you go about using all this data to build a LLM app for your enterprise? Over at Abacus AI we have already build thousands of these applied AI systems and LLM apps.
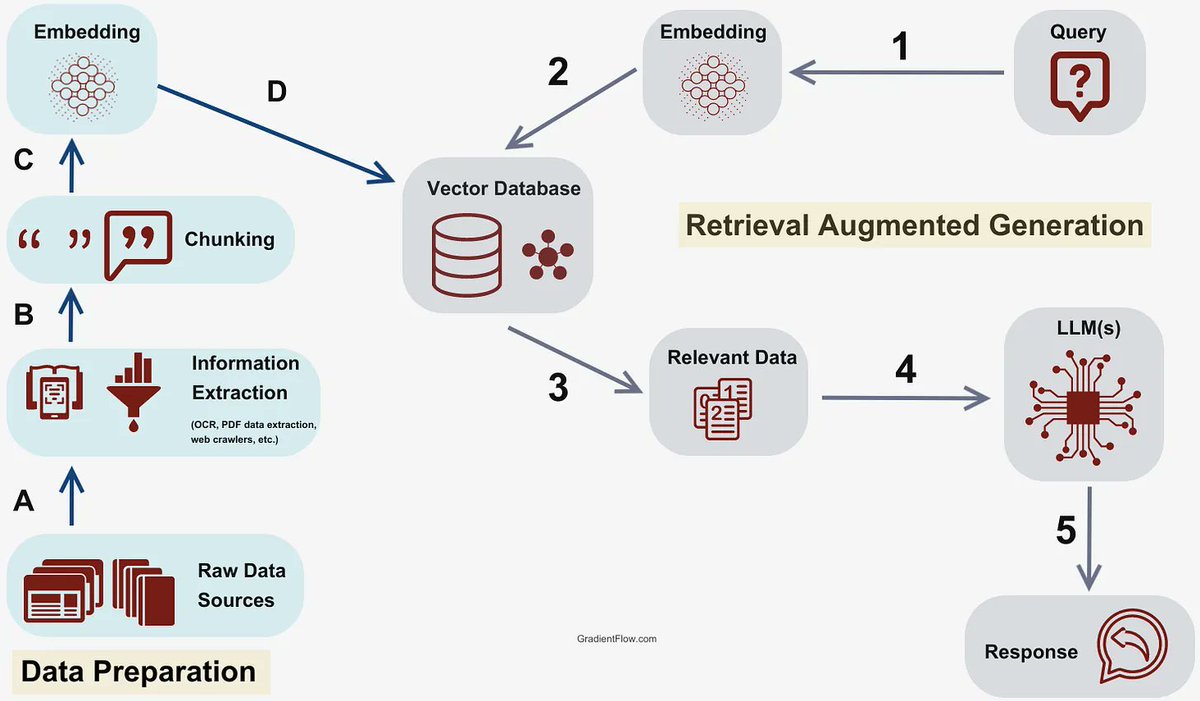
You need to orchestrate a bunch of steps to build the app. You start with data connectors to grab the data.
The next piece is the data processing.
PDF extraction - This can be tricky as different OCR models perform differently, so experimentation with different OCR services is recommended If the PDFs have tables, care must be taken to extract the rows correctly
Chunking - You typically want to chunk your documents into smaller pieces. For structured data, we recommend leaving it in your data lake or data warehouse.
Embedding - This is key, you will need to try different embedding strategies based on different use-cases and your data.
For example, embedding a bunch of python APIs will be different form embedding a bunch of word documents. So you have to choose your embedding strategy very carefully.
Doc Retrievers and Vector Stores - In most enterprise use-cases, there is retrieval step before the LLM step. This is the process of getting the content that has the relevant response and passing that content as part of the LLM context. Now when you have both structured and un-structured data, you have a couple of different choices.
If you have mostly unstructured data and some structured data from PDF tables, we commend option 1, otherwise we recommend option 2.
Option 1 - Meta-data filters- When you have a large amount of un-structured data and some structured data, you can use mata-data filters on you doc retrievers and/or vector stores
Metadata filters in document retrieval systems aid in narrowing down the search to relevant documents by utilizing auxiliary information like author, date, or tags. In contrast, vector stores house vectors representing documents or words in a multi-dimensional space, facilitating similarity-based retrieval through proximity measures with a query vector.
Integrating metadata filters with vector stores can enhance retrieval precision by ensuring that the documents retrieved are not only semantically relevant but also meet specific auxiliary criteria outlined by the metadata.
Option 2 - We suggest this option if you have a lot of structured data in a database. In this case, you want to use the "text-to-sql" capability of LLMs, the LLM will generate the SQL that you would execute on your data-source
Ideally, there is an orchestrator that based on whichever option you decide to use, will either generate the SQL query or the request to your vector store with the appropriate meta-data filters.
The end user inside the enterprise or the consumer doesn't need to worry about the data source, they simply can use their interface to the chat bot - a custom chatGPT like interface or a bot on Teams/Slack.
End to end LLMOps platforms like Abacus AI can automate each of these steps. As a data scientist you can experiment with different embedding, chunking, LLM and vector store strategies in a matter of hours and pick the right strategy for your use-case.
Some teams are still busy building each of these pieces on their own. It's probably a waste of time to re-invent the wheel so many times, in every company, instead go to market quickly with your LLM app and work on what really differentiates your organization from others.
PCA is a powerful technique for dimensionality reduction & data visualisation.
In high dimensional data, features are often correlated, so they don't all provide unique information.
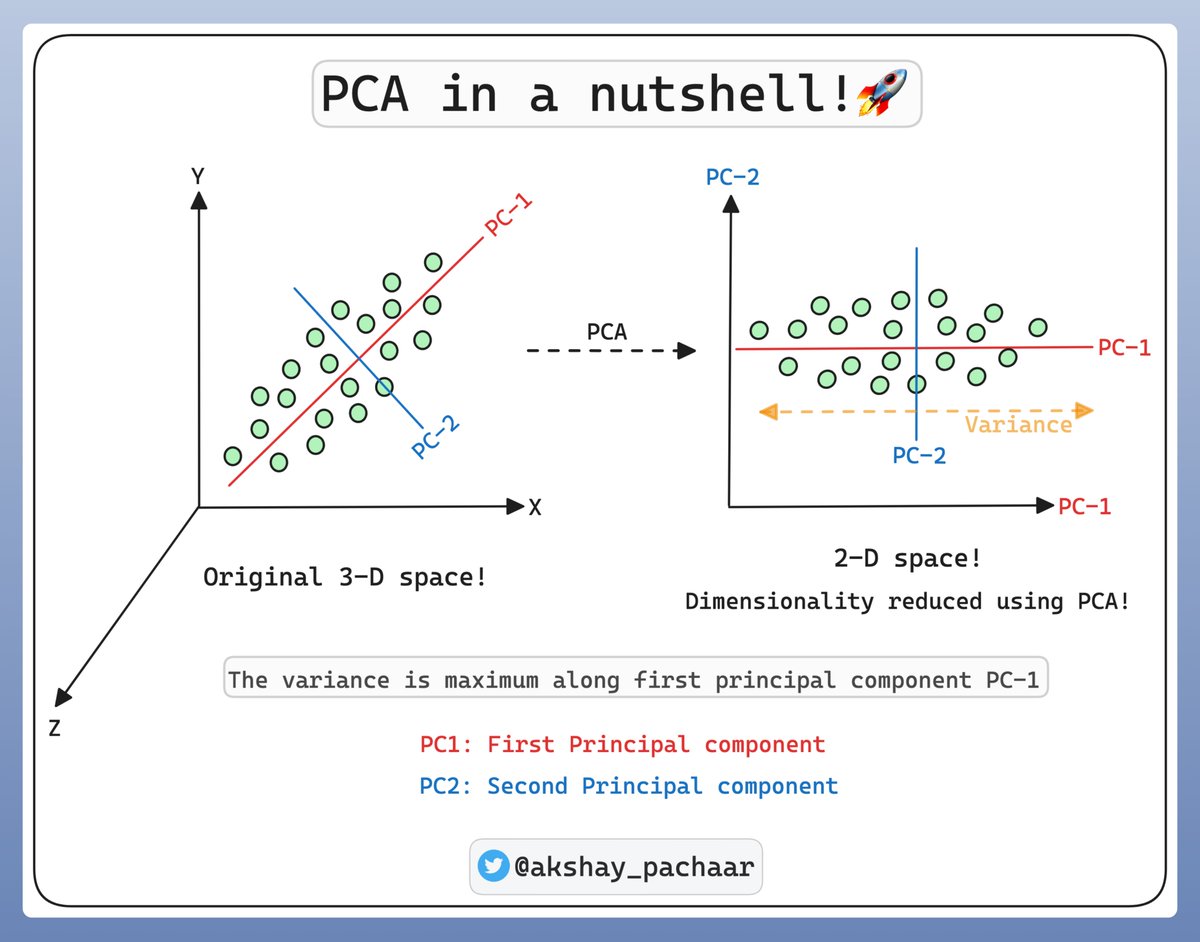
This is where PCA comes in, it reduces dimensionality while retaining as much variability as possible.
So, how does PCA work❓
- Standardize the data (mean=0 | var 1)
- Compute the covariance matrix.
- Find its eigenvalues & eigenvectors.
- Sort eigenvectors by decreasing eigenvalues.
❗️The eigenvectors (principal components) give the direction of the new space, while eigenvalues determine their magnitude (or importance).
❗️The 1st principal component captures the most variance, which is evident in the image below.
Why use PCA❓
- Data Visualization
- Noise Reduction
- Feature Engineering
- Speed up Algorithms
PCA also comes with certain limitations:
- Sensitive to scaling
- Assumes linear relationship
- Doesn't handle categorical data well
- PC components may not have an interpretable meaning
That's a wrap, if you interested in:
- Python 🐍
- ML/MLOps🤖
- Maths for ML 🧮
- CV/NLP 🗣
- LLMs 🧠
- AI Engineering ⚙️
Find me → @akshay_pachaar ✔️
Everyday, I share tutorials on above topics!
Cheers! 🥂
Dall-E 3 now lets you modify the images you generate.
You can add elements, change colors and much more.
I'll show you how to do this easily directly in ChatGPT:
(just released) New R-Tip: Make an R Shiny app that analyzes Excel files (in under 15 minutes).
Article: https://t.co/Q5Ciagp2v7
#datascience#rstats#R#Tips