Quantitative social scientist (PhD) | Cultural values, political behavior, public opinion | APC effects, multilevel modeling, causal inference, survey methods.
🚨🚨Very happy to announce the publication of our new paper (done together with my colleague and friend @tonirodon) appearing in the @BJPolS
https://t.co/tdDCCJ2ad3
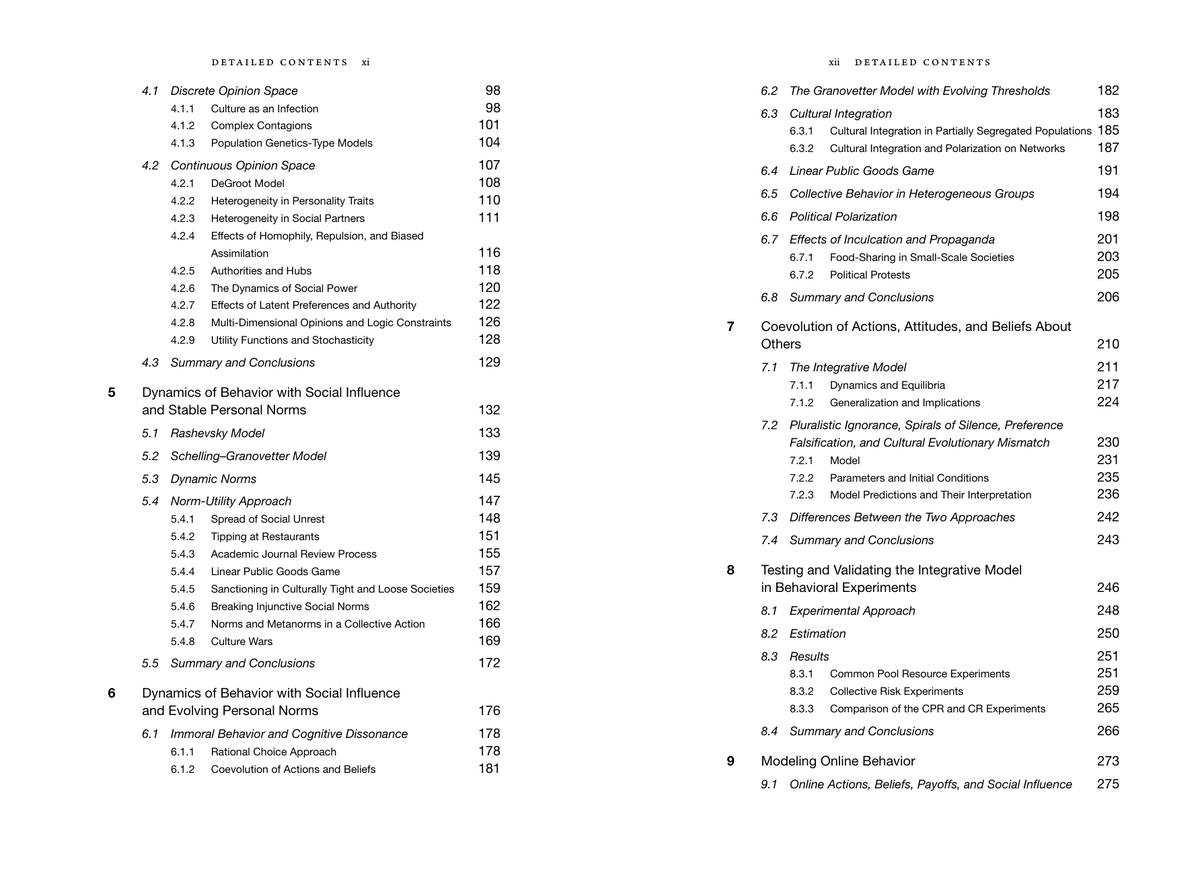
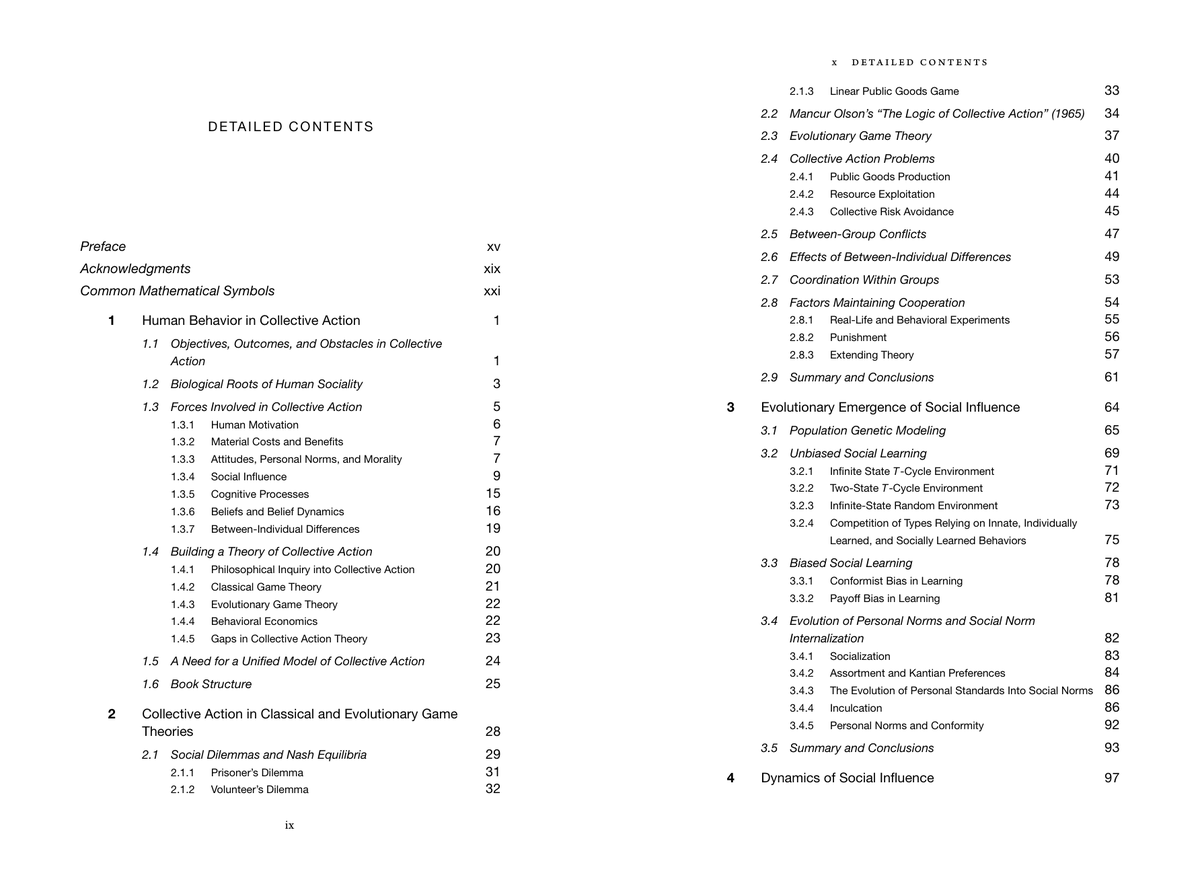
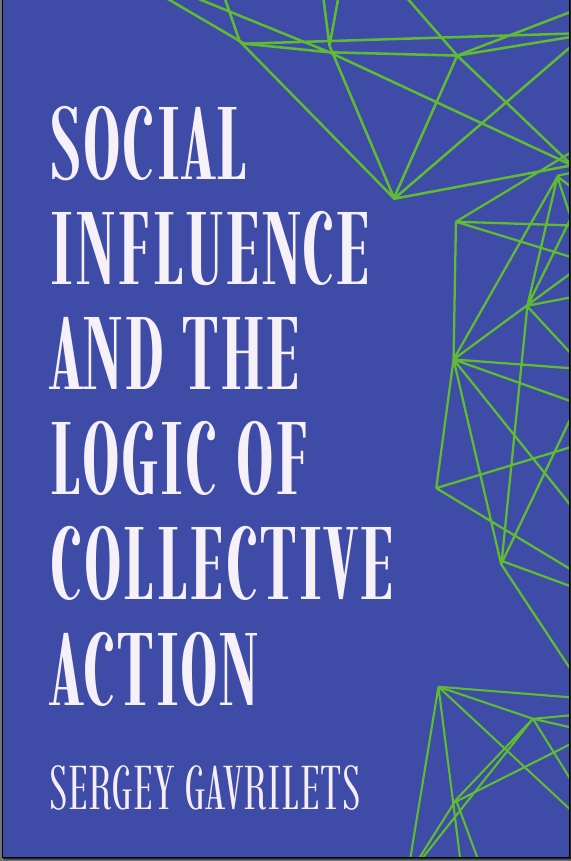
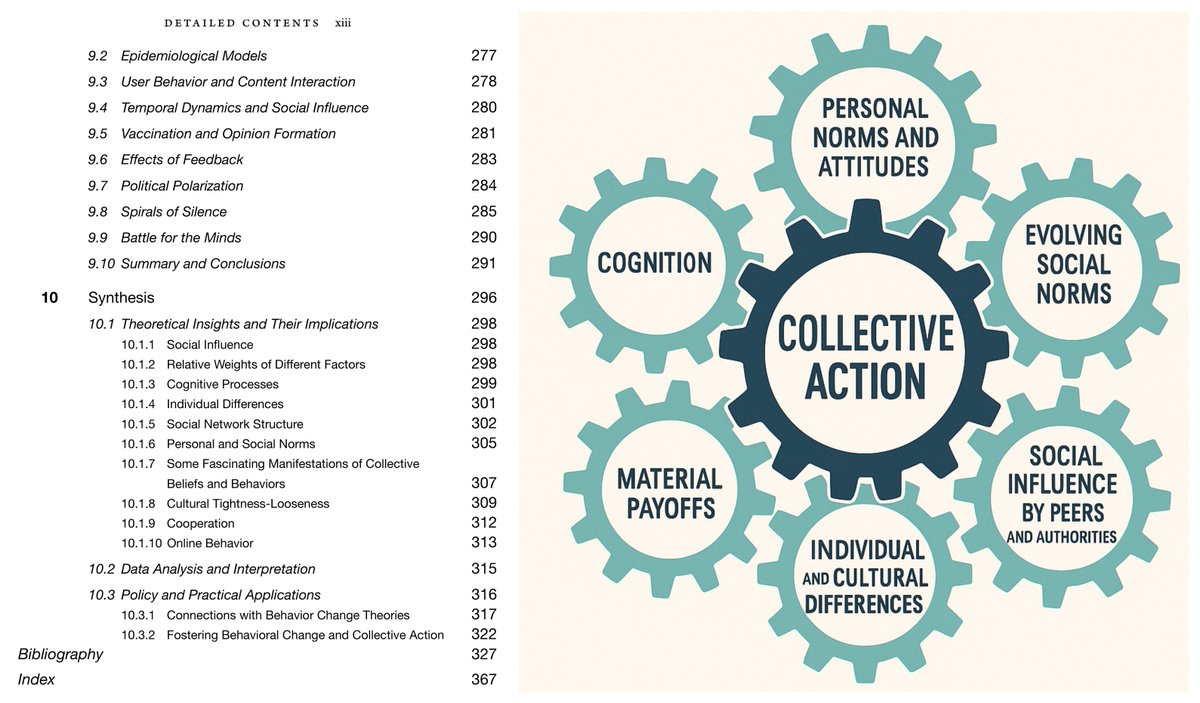
My new book, "Social Influence and the Logic of Collective Action", is now listed in the Princeton Univ Press catalog. It brings together work on social norms, attitudes, beliefs, cooperation, polarization, and online behavior. The TOC is attached.
https://t.co/Mg1CPo6vAZ
In individualistic, easygoing cultures, people are less likely to tolerate free riders when institutions work well. But in tight-knit, rule-following societies, strong group values keep people in line—even if the system does not https://t.co/2BAdtdTcRn
I recently made a very popular LinkedIn post about Simpson's Paradox, which resulted in an engaging conversation. Paul Julian made a great comment on the relationship between Mixed Effects Models and Simpson's Paradox that I wanted to share with you.
He pointed out that when specified correctly, Mixed Effects Models can avoid being fooled by Simpson's Paradox. Unlike a naive linear model that analyzes all data at once, which might lead to misleading conclusions, mixed effects models separate fixed effects (consistent effects across all groups) and random effects (group-specific deviations from the overall trend). This allows the model to account for variations both within and between groups, leading to more accurate interpretations.
In the plot below (generated from reproducible code – thanks, Paul!), you can see how different models compare:
🔹 Fixed Effect (black line): Captures the overall relationship, assuming it is the same across all groups.
🔹 Group Linear Model (dashed red line): Shows the trend within each subgroup, revealing how group-specific relationships can differ.
🔹 Naive Linear Model (gray line): Fails to account for subgroup differences, which can lead to misleading conclusions due to Simpson's Paradox.
🔹 Random Effect (blue line): Captures the variation between groups, allowing for group-specific deviations from the fixed effect.
Here's the original post: https://t.co/ep9N4DOQSw
Important Notes: Mixed effects models offer a flexible framework to address Simpson's Paradox, effectively capturing both group-level and overall trends. However, they have limitations and alternative approaches should be considered. Mixed models, like any statistical tool, can be mis-specified if key variables are omitted. In certain cases, simpler models like OLS can handle group effects just as effectively, provided the predictors are correctly specified. For longitudinal or clustered data, marginal models like GEE or MMRM may be better suited when the goal is to estimate population-average effects, especially since mixed models focus on conditional, subject-specific effects. Additionally, Simpson’s Paradox requires careful causal understanding. Grouping variables can either be confounders or colliders, which influences the choice of model. An inappropriate adjustment can lead to incorrect conclusions, making it crucial to understand the causal structure before deciding whether to use a mixed model or a simpler approach.
For regular tips on data science, statistics, Python, and R programming, check out my free email newsletter. More information: https://t.co/X93SeCe0rb
#R4DS #RStats #DataAnalytics #Statistical #database #DataVisualization
Simplify the creation of publication-ready plots! The ggpubr package builds on ggplot2, providing easy-to-use functions for creating clean and stylish visualizations, perfect for reports, articles, and presentations.
✔️ Publication-Ready Graphics: Designed to help you generate high-quality plots with minimal effort, ensuring your visuals are polished and professional.
✔️ Easy Statistical Annotations: Easily add statistical comparisons, p-values, and significance markers to your plots, making it simple to highlight key differences.
✔️ Streamlined Plot Customization: Includes intuitive functions for adding titles, labels, themes, and more, so you can quickly fine-tune your plots to match your style.
✔️ Seamless Integration with ggplot2: Works directly with ggplot2, allowing you to enhance and customize your plots without learning a new syntax.
The visualizations shown here are from the package website, demonstrating how ggpubr can simplify the creation of beautiful, informative plots: https://t.co/Dx49IJJVkD
Want to master ggplot2 and its powerful extensions to create stunning visualizations? Enroll in my online course, “Data Visualization in R Using ggplot2 & Friends,” starting on November 25, 2024!
Early bird promotion available for a limited time, through November 6.
Further details: https://t.co/ztlEzoFbM3
#Rpackage #tidyverse #DataVisualization #VisualAnalytics #ggplot2 #programmer
The Wise Judgment Consortium (https://t.co/ZkfMhklr6X) introduces @MaksimRudnev, a quantitative social scientist here at the Wisdom & Culture Lab at @UWaterloo! His work explores human values, their cultural variability, and how they shape social perception across societies. 1/6
New paper w/ @caprosser at @apsrjournal. A recent paper claim rising mass polarization in US is actually declining survey cooperation rates (only diehard partisans responding). We show evidence that this actually results from overly strong regularization
https://t.co/J8a2IFwxuL
My new book "Paleoeconomics" is now available online. It offers a chronologically structured overview of the economics of prehistory from around 3.4 millions years ago to the emergence of states around 3500 BCE. It builds on rapidly growing research in several fields. 1/6
Economics still can't predict nor control recessions & inflation very well. But it sure knows a thing about trade. Using a simple Ricardian gravity model of trade along with digitized cuneiform accounting records, we have new evidence for the location of lost Anatolian cities.
"Evolutionary theory provides a foundation 4 the view that norms result from individual decisions based on preferences & beliefs... not only satisfy our wish to understand the world, but also inform the design of policies aimed at influencing social norms"
https://t.co/Ji2MZC9VT1
o1 is the biggest AI update since transformers and it paves a clear path toward AGI.
This is what Ilya saw. This is why Sam wanted trillions of dollars of compute. This is what Leopold warned us about.
Just like transformers, o1 lets you efficiently trade in compute for accuracy, but here it's at inference time instead of pretraining time. It's the AlphaGo moment for transformers. Every big lab was working on this, OpenAI was the first to release.
The path toward AGI is now clear. Train this over images, video, web interactions, robotics sensory data, every source of data we got. If you can construct an RL reward function for a task -- easy to do for code and math -- you can now get better at that task by throwing more RL + inference compute at it.
OpenAI introduced a remarkable new log scaling law, for inference. This is now the most important scaling law. They'll proceed to scale this stuff up 10, 100, 1000x. Sure there might be a hiccup here or there as power plants become harder than compute to spin up and regulations restrict the flow of research. But the benefits are so big and the national implications so grave that this isn't going to stop.
I'm super hyped. I grew up dreaming of a sci-fi future -- didn't you? -- and this is the way to get there. I want an iron man suit, pristine cities, a millennium of feeling 27 years old, trips to Europe that take 1 hour and trips to Europa that take 1 year.
Humans are too slow, lazy, and political to reach this future on our own. We'd sooner wipe ourselves out. Plentiful intelligence is how we get to this future safely.
Sure there are risks, but one other remarkable result from OpenAI's report is that o1 actually gets better at following rules. I'm less worried that the AI itself will choose chaos, and far more worried that bad actors will get access to this tech and RL it toward chaos. We should obviously march forward carefully.
It's a strange feeling to have been planning for this agentic future for a couple years, and to now see it finally arriving. Greg probably doesn't remember this, but I was once chilling with him on a beanbag in the GPT-2 days at an OpenAI WestWorld watching party, and we were arguing about scaling laws. I thought we needed new algorithms to get to AGI. He argued scale is all you need. After GPT-3, I felt he was right. After GPT-4, I knew it. Now with o1, I'm prepared for it.
The era of agents has officially begun, and me and my team are ready. OpenAI's only a block away from our office, and we feel a parallel energy.
Agents powered by lots of inference are going to change our society rapidly. The stakes could not be higher. We need lots of different kinds of help to navigate this well. My plan is to provide these agents with super powerful web retrieval, bc no one is focusing on that and it's extremely important to get right. What's your plan?
"Long ties accelerate noisy threshold-based contagions" — our long-in-the-works paper on how network structure affects social contagion appeared this year in @NatureHumBehav.
My hope is that is triggers a reevaluation of ideas about "complex contagion"
https://t.co/qKNERQinUx
How Allocating Work Aided Our Evolutionary Success
Societies divide labor by gender and age.
A biological anthropologist considers when and why this behavior arose. https://t.co/4HXnxIFF1Z
"We find no evidence that preregistration in itself reduces p-hacking and publication bias."
But...
"When preregistration is accompanied by a preanalysis plan we find evidence consistent with both reduced p-hacking and reduced publication bias."
Many fields—including psychology, sociology, communications, political science, and computer science— use computational methods to analyze text data.
We find that the all versions of #GPT are capable of accurately detecting various psychological constructs in text across 12 languages,
Using simple prompts and no additional training data. GPT thus overcomes the limitations present in existing text analysis methods.
For instance, GPT (r = 0.59 to 0.77) performed much better than dictionaries (r = 0.20 to 0.30) at detecting psychological constructs.
GPT is also effective in several lesser-spoken languages.
https://t.co/ANrBkbI94I
Led by @steverathje2 & @DanMirea4 along with @sucholutsky@RajaMarjieh @CRobertson500
10 Excellent Books for Policy Minded Progressives
1) Good Economics for Hard Times - Banerjee + Duflo.
Great, entertaining overview of current areas of debate and what the empirics currently suggest. Great reference book, topics ranging from growth to trade to immigration.
Heading to ASA to present a paper on what determines social status in Britain using a new conjoint experiment that had people 30,720 status judgements (screenshot below)
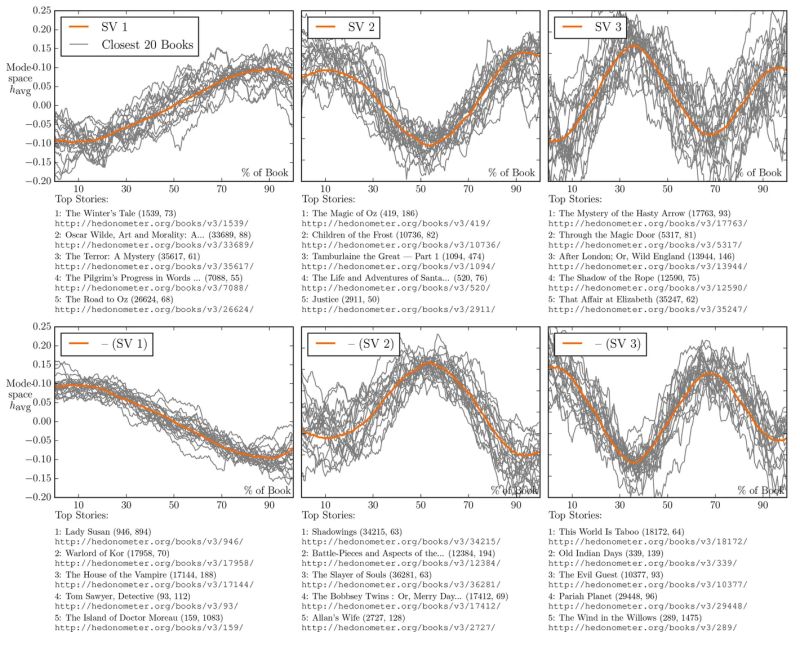
In 2016, researchers at the University of Adelaide tested Kurt Vonnegut's theory that, "There’s no reason why the simple shapes of stories can’t be fed into computers."
They took the emotional arcs of 1300+ novels from Project Gutenberg, turned that into data, used modern tech to analyze the emotional arcs, and then identified 6 patterns seen over and over again in western storytelling.
Here they are:
1. Rags to Riches (rise)
Your classic underdog tale. A humble, hardworking peasant climbs the mountain to pull the sword from the stone.
• Rocky
• King Arthur
• The Pursuit of Happiness
2. Riches to Rags (fall)
Maybe the saddest story of them all. A journey from the highest of highs to the lowest of lows.
• King Lear
• Citizen Kane
• Scarlet Letter
3. Man in a Hole (fall then rise)
A character’s doing fine, gets herself into a huge problem, but figures out how to overcome it. They often end up better than they started.
“You see this story again and again,” Vonnegut says. “People love it, and it is not copyrighted.”
• The Martian
• The Hunger Games
• Shawshank Redemption
4. Icarus (rise then fall)
The hero goes on a meteoric rise up New York (or some other) society, calls everyone “old sport,” and throws the wildest parties in town. Then reality sets in, and he realizes he’s too close to the sun.
• Macbeth
• Great Gatsby
• Death of a Salesman
5. Cinderella (rise then fall then rise)
I’ll leave this description to Vonnegut:
“We’re gonna start way down here. Worse than that, who is so low? It’s a little girl… the shoe fits, and she achieves off-scale happiness.”
• Red Rising
• Slumdog Millionaire
• The Count of Monte Cristo
This is my personal favorite.
6. Oedipus (fall then rise then fall)
Up until the ~70% mark of the story it looks like things are sunshine and rainbows. Walter White goes from high school teacher to king of the drug lords, if you will. Then all goes wrong. The original fall is often not their doing while the final fall is.
• Hamlet
• Gone Girl
• Breaking Bad
My 3 takeaways:
1. Rags to Riches, Oedipus, and Cinderella rank as the three most popular with consumers. AKA, those books sold the most copies.
2. When you think through a story, give it an emotional shape. Literally draw it.
X axis: Time
Y axis: Ill fortune to good fortune
You might be surprised how much it helps you craft your plot (I was shocked).
3. Vonnegut was a damn genius.