Here's the final version of the global population density graphic I made, because another one that is circulating was less well defined, and someone cropped NZ off it
The BBC are reporting that the data was in Excel but was indeed in rows (not columns, phew).
HOWEVER, Public Health England used .xls format and not .xlsx which means they were limited to the pre-Excel-2007 limit of 65,536 (aka 2^16). Which is still breathtaking incompetence.
When I first heard that cases were missing I thought “can’t be an Excel problem, the rows run out at 1,048,576 which is bigger than even total cases”.
I never thought they’d have a case per COLUMN. Unbelievable. And yes: Excel columns end at 16,384 aka “XFD”.
So-called "Covid toe" is emerging as yet another possible sign of the new coronavirus, even though U.S. officials have not yet listed it among the symptoms. Some experts say it may reflect a healthy immune response to the virus. https://t.co/rytrWnf1L3
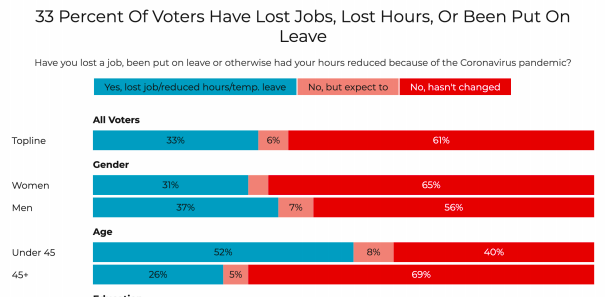
New @DataProgress poll:
- 52% of Americans under 45 have lost their job, had hours reduced, or been furloughed
-35% of Americans under 35 now say they don't have health insurance
https://t.co/IR61m7J0zn
If the 16.8 million people who have filed for unemployment in the past three weeks are the ONLY newly unemployed people then the unemployment rate is 15%.
In reality at least a third haven't applied, meaning that the unemployment rate is closer to 20%.
By the power vested in me by Mike Pence's public health expertise—and I should add that this declaration is extra true because it has been vetted and improved by his office (which everyone agrees is doing an extremely good job)—I declare it beer o'clock.
@thecliffbar@Noahpinion The snippet says that Uber lowers commute times (on average) for those commuting by transit, and I think that’s what he means by the conclusion (2). It doesn’t mean that every person commuting by transit has a shorter commute time.