$UNI looks good here imo 📈
after months of downward movement, it finally looks like we’re about to break a down trend and with a good volume as well
no rush, let the entry come to us, i’ll get it from a breakout and a retest then a moderate stop loss to manage risks
keep your eyes on the chart peep
.
$UNI BOTTOM IS IN
Could begin an accumulation period at this level, or slowly gain traction with small upside movements
❇️Current price $3.6
($2.4B mcap)
❇️TARGET $17.10
($10.7B mcap)
You won’t get this opportunity again.
The Crypto bottom is in an 99% of people are completely fading it.
They’ll jump onboard but later, and higher.
Ignore them, they’re all morons.
Buy the bottom now, and you’ll be rich af in 3-6 months.
🚨 2026-2027 Bull Run Roadmap:
July: Bear Trap
August: Bull Run Accelerates
September: New Bitcoin ATH
October: Distribution Begins
November: Capitulation
December: Mass Panic
January: Final Cycle Bottom
Keep in mind: I’ve called every major market top and bottom for over 10 YEARS.
I was one of the only people who called the top in October, and I’ll do it again, that’s literally my job.
If you still haven’t followed me, you’ll regret it.
$UNI is printing a powerful double bottom formation at a major support zone inside a long-term falling wedge 👀
Buyers have defended support twice, showing strong demand after an extended downtrend. The combination of a double bottom and falling wedge often signals seller exhaustion and a potential shift in market psychology.
Bulls are slowly reclaiming control, and a breakout above key resistance could trigger a strong expansion move. Momentum appears to be building for a major recovery 📈🔥
Market sentiment is turning bullish as accumulation continues and buyers aggressively defend support. 🚀
$UNI #UNI #Uniswap #Crypto #Altcoins #TechnicalAnalysis
My 2026 Bull Run prediction:
June → Bear trap
July → Bitcoin breakout
August → Altcoin season
September → New ATH around $150K
October → Bull trap
November → Liquidation cascade
December → Bear market kicks in
Keep in mind: I’ve called every major market top and bottom for over 10 YEARS.
I was one of the only people who called the top in October, and I’ll do it again, that’s literally my job.
If you still haven’t followed me, you’ll regret it.
The idea that Bitcoin can go back to an ATH this year is still my base case. I know it might sound like a bold call after all this choppiness, but cycles and patterns don’t always play out the same way. In order to invalidate every aspect of the 2022 bear market with its lower lows and lower highs formation down to the October low because that’s what everyone was taught crypto cycles should look like, people are now expecting the same structure again.
However the same people did not expect an ATH before the halving, and they did not expect a bearish Q4 in the last year of a full four-year cycle. Yet they still expect the same fractals and patterns to play out as in 2022 balrighttt.
So, in order to invalidate all these assumptions Bitcoin would push to a new ATH with a few ABC intra-range corrective phases followed by a final blow-off top.
What I am looking at on the lower timeframes is the liquidity point at 73,800 as a final low until the end of the month, followed by a move into the 85–90K range into a summer rally back above 100K into 108K. This would be followed by another ABC correction and a final blow-off top.
Then, just after the midterms we would have a three-month period to sharply correct downward just like in early 2025. In the best case we hold 70–65K, in the worst case we could even make a new low to 55K.
And that would be it you have your four-year cycle, invalidating everyone, as it has done from beginning to end.
Brain fog. Insomnia. Tight jaw.
You’re not “falling apart.”
Your nervous system is stuck in hidden anxiety.
Here are 8 body-based ways to calm it down (without medication): 🧵
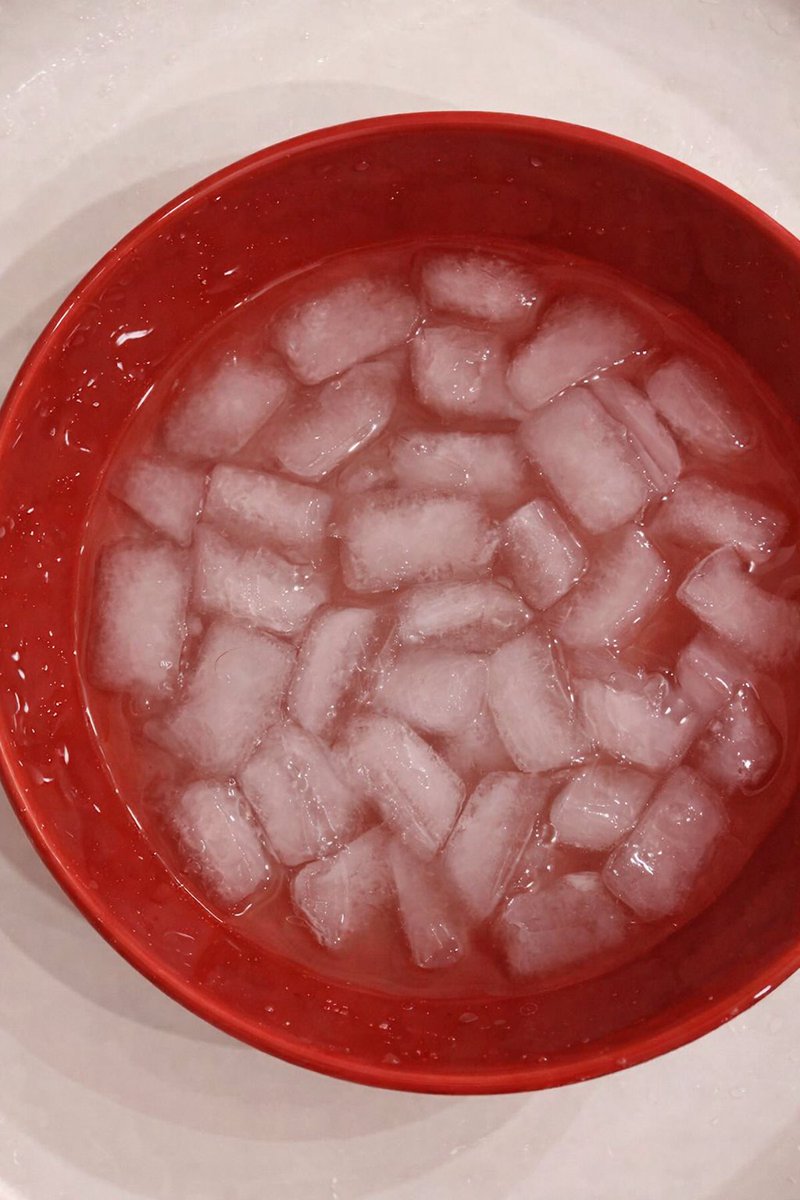
1. Cold water on your face.
🚨 $PENGU sessiz sedasız güç topluyor… ama asıl olay dirençte kopacak gibi.
Grafiğe baktığımda ilk gördüğüm şey şu:
dipten toparlanma denemesi var ama henüz “tamam döndü” demek için erken.
Çünkü fiyat güzel tepki vermiş olsa da yukarıda net bir duvar var.
O duvar aşılmadan bu iş sadece “tepki” olarak kalabilir.
📊 Grafikte ne görüyorum?
$PENGU bir süredir alttan destek alarak yukarı doğru sıkışıyor.
Bu iyi tarafı.
Ama aynı zamanda yukarıda direnç bölgesine yaklaşmış durumda.
Yani piyasa şu an şunu soruyor:
“Buradan devam mı, yoksa yine satış mı?”
🔴 Yukarıda kritik seviyeler:
0.012728 – 0.017242 üstü kapanış gelirse
işte orada hareket ciddileşir.
Devamında:
➡️ 0.025326
➡️ 0.047427
➡️ 0.069665
seviyeleri konuşulmaya başlar.
Özellikle 0.017242 üstü mum kapanışı gelirse,
ben orada “tamam, alıcılar güçlenmiş” derim.
🟢 Aşağıda destekler:
0.009207 şu an ilk önemli destek.
Altında:
➡️ 0.007222
➡️ 0.005780
bölgeleri var.
Bu desteklerin altına kapanış gelirse,
ben orada “tepki bozuldu” derim ve fazla inat etmem.
$PENGU şu an tam sosyal medyanın sevdiği yerde:
biraz hareket var, biraz umut var, biraz da “acaba patlar mı?” havası var.
Ama ben yine aynı şeyi söylerim:
Hype’a değil, kapanışa bakarım.
Çünkü bu piyasa insana önce umut verir,
sonra dirençten kafasına vurur. 😅
#PudgyPenguins #pengu #kripto #altcoin #bitcoin
⚠️Uyarı: Grafiklerim eğitim amaçlıdır. Hiçbir şekilde yatırım tavsiyesi içermiyor. Kripto paralar riskli varlıklardır. Sizlerde kendi araştırmanızı yapın arkadaşlar.
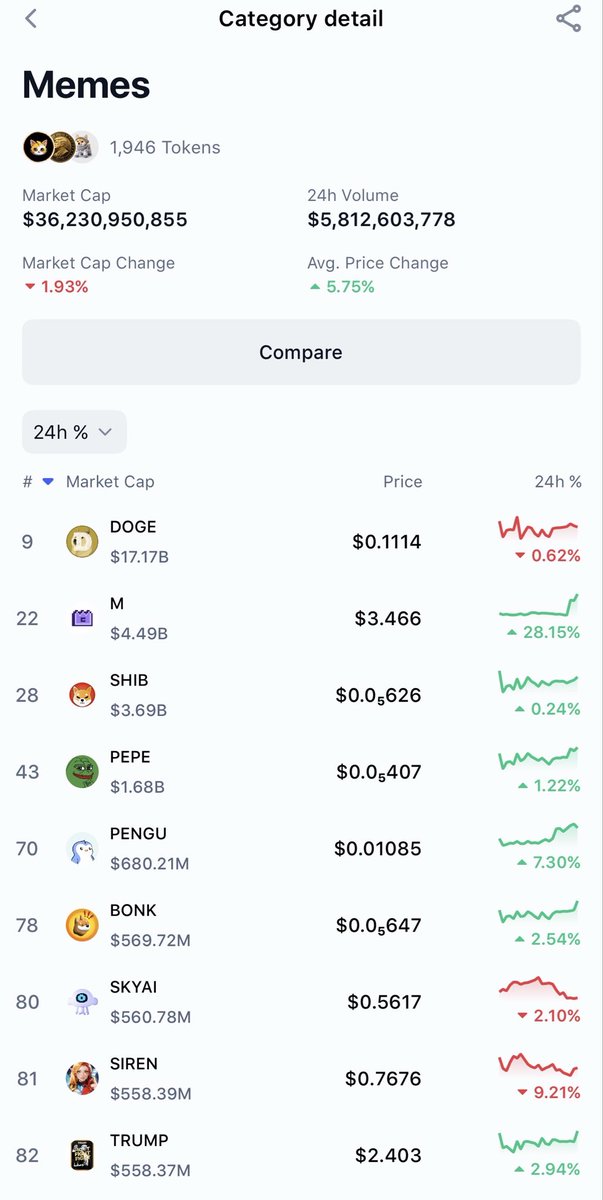
Again no way $PEPE is worth 2.5x + and $DOGE is worth 25.3x + $PENGU ‘s current market cap. PENGU continues to ship MUCH more than both combined, MUCH better R:R than both still. Approaching a long time resistance before a big violent move up; continue to accumulate the Pudgy 🐧
@Coinvo I am Filipino, and I can say that President Rodrigo Duterte is the best president. Drug addicts in the Philippines should really be eradicated because those people are dangerous. Corruption in the Philippines is severe, current president is an addict himself
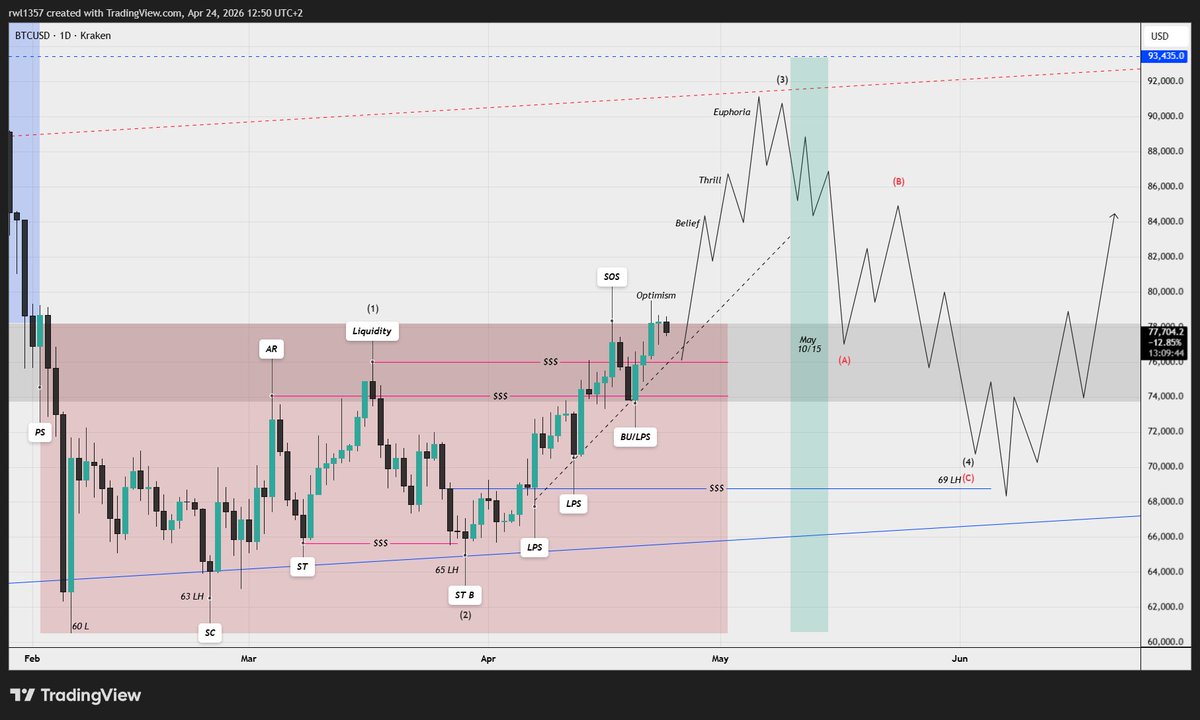
This is a multi-perspective analysis to add confluence and explain why I see Bitcoin moving higher after we bottomed in recent months.
Starting with the trend:
The trend on the macro has been bullish since we tested the lows on February 23 at 63k. That was our first higher low in the new bullish structure. We then formed a second higher low at 65k, with the next expected higher low sitting in the 69k–71k zone.
Wyckoff perspective:
After the selling climax at 63k, we had our automatic rally up to 74k which tapped macro resistance and pushed us back down to around 65k. From there, we began building a liquidity range by sweeping highs and lows. After the secondary test, we swept 74k again, followed by another sweep of the lows at 65k (our secondary test in Phase B). This also aligned with the second higher low in the trend. Since then we’ve been building the final points of the support as the price goes up but doesn’t fall back down, and now we are now hovering above both the preliminary support and the automatic rally. In theory, as long as 74k holds and we continue building this staircase pattern, we can see an explosive move to the upside at any moment.
Wall Street Cheat Sheet perspective:
The current price action fits the Wall Street Cheat Sheet pattern almost perfectly. Many charts and fractals are copying what happened in December, with people calling this a fake move or bull trap. What they don’t realize is that they are contributing to the exact psychology needed for the market to move higher. As it chops around, it builds frustration and FOMO. Once we break out aggressively to the upside (aligning with both Wyckoff and the Cheat Sheet), those same people will feel they’re missing out and rush in to buy at any price. That’s when we’ll likely see a larger correction back to the 69k–71k zone. This pullback would hold the macro bullish trend and reset sentiment.
Timeline perspective:
A major pivot is likely around May 10–15 around with the new FED Chair announcement. This could spark euphoria as people anticipate the new FED will cut rates and act dovishly, adding to the buying pressure. Once everyone has bought expecting the new FED to push markets higher, we can get a healthy reality-check correction. Only then should the summer rally begin, extending into Q3 or even better Q4, with Bitcoin reaching 108k–116k — or making a new all time high while ETH and altcoins outperform in the second half of the year.
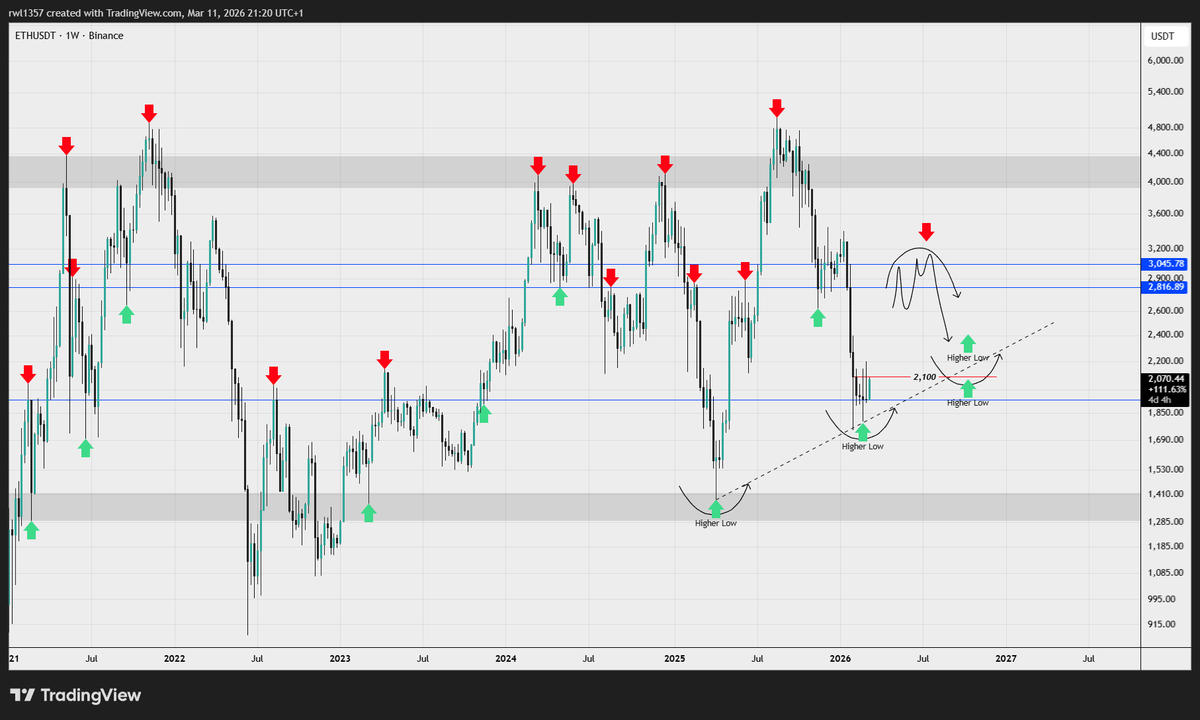
If I say that the local bottom for ETH is already in nobody would believe it, anyways, structurally a reclaim of 2,100 with a nice weekly close would likely generate a market rally into the summer, back to 2,800–3,000. At that point, the market will decide whether the 4-year cycle is still in play or not.
The majority already know my take and I don’t think the 4-year cycle exists anymore. For now however the market still looks like it does, simply because price action has played out so far like a normal cycle, yet we will find out in the summer once we reach 2,800–3,000, from there we will see a small pullback to maintain another higher low either around 2,500 or back to 2,100–2,200.
At this stage it barely matters where the pullback happens. What matters is that those levels hold by that time, and then price breaks 2,800–3,000 pushing toward a new ATH, and I think that’s the most likely scenario based on how the structure is presenting right now, as well as a few macro setups I follow that correlate with the same idea the 4-year cycle will no longer be respected atleast not for crypto.
By the time everyone is waiting to buy the lows, they’ll be forced to buy much higher than current prices after realizing the market is holding stronger than a typical bear market. Also as mentioned 2,800–3,000 is the barrier between selling pressure and buying pressure, after breaking it I don’t think we’ll stop again at 4,000 quite the opposite we’ll likely break through it and reaching 14k–20k by mid to late 2028, with small intra range resistance around 6,500–8,000 and few more small levels.
We've been pathing the same charts for months now, and I'd say we've nailed about 90/100% of the LTF moves so far. The macro direction has remained to the upside, as highlighted in previous macro updates—all of which have consistently pointed in the same direction.
This chart has mainly focused on LTF moves, starting with the retest of the bottom on February 23rd at 63k, followed by a BOS on the LTF, we then retested 65k where the price officially started building a bullish structure. After that, we faced the macro resistance at 74k where we made a new higher high, mentioning to expect 1-2 weeks of uncertainty after the FOMC—which is exactly what happened.
This was followed by another bottom at 65k from which a new market reset began. We've since printed another higher low and are now back at a higher high, now that we're back above 74k and holding it there are two possible scenarios, Bullish case: We consolidate here, Trump folds again for the third time since the conflict started, and the market pushes higher exceeding 84k, targeting 90-96k (essentially above the 200 EMA) into May 10th.
Alternative scenario, since we made another higher high last week, it would be perfectly normal to see another higher low at 69k. For the 3rd in a row, this would offer a strong buying opportunity (again).
The overall structure has been clear for a long time, 60k as the bottom, 63k as the first higher low, 65k as the second higher low, and a potential 69k as the third higher low as the trend remains neutral to bullish, (by the way it's not necessary to reach 69k—only if it does, then look to reposition, personally I've already taken 10% off the table and will take another 20% off if the rally continues from here while we hold above 74k)
#Bitcoin – What’s Next?
The Big Sunday Report: All We Need to Know
🚩 TA / LCA / Psychological Breakdown: A few days ago, I gave a long at the 71k region and mentioned targets of the 79–84k region, and I am now changing something in the plan! I previously said that between 79–84k I would take profit of the long and ADD more SHORTS, this strategy has now changed and is very important to understand!
My long from the 71k region remains open, but my take profit has changed. Instead of taking profits between 79–84k, I will take HALF OF THE POSITION SIZE as profit at the 76,200 region, and this is also very important to understand! I am NOT adding short orders at 76,200, but still between 79–84k in case the market allows a move there. The other half of the long will also be closed between 79–84k if the market reaches that region. Once 76,200 is hit, I will take profit on half of the position size of the long and move the stop loss to entry to avoid any loss and secure 50% of the profit. I hope this makes sense now. You might wonder where this shift comes from, and I need to admit a small mistake in my calculation: the probability of hitting 76k is very high, but the probability of reaching 79–84k is currently medium. Because of this, I am adjusting my take profit areas. Overall, the short from 115–125k remains open, and additional short orders are placed between 79–84k in case the market reaches that zone, I am not interested to add short orders at 76k region, just if we move higher and we see higher FOMO, I would be interested to add between 79-84k, not earlier.
I am expecting a large downside move in the coming weeks, it should not take much longer, as the move is very close. I am expecting the S&P 500 to crash within the next two months, with a downside move of more than 35%. In comparison, the S&P 500 dropped 34% during the COVID black swan event. I am expecting a much larger downside move this time, with a heavy domino effect.
I am expecting a large trap for bulls as well, something market makers will use to send us lower into the 50s area and even further afterward. We have not bottomed out. The only question now is: how high will we rise before continuing downward? Will it be 76k before rejection, or will we reach the 79–84k region first? This question needs more time to be answered with clarity. While I see the probability of 76k as extremely high, I currently see 79–84k as medium probability, and therefore I am adjusting my trade accordingly. Profit is the only option and I am using every move to make a profit, no matter what my bias are!
As always, I am very transparent with you regarding my trades and decisions, and I want to personally thank you all for the support you are giving. Congratulations to everyone who took the short with me at the exact top, I will keep it open and realize it at much lower levels than where we are now.
Join DrProfit Premium now: https://t.co/Ice9n2uknI