Had to reread several times. This seems fine and sustainable…
"Tech sector capital spending contributed 40%-45% of US GDP growth over the last three
quarters, up from less than 5% in the first three quarters of 2023."
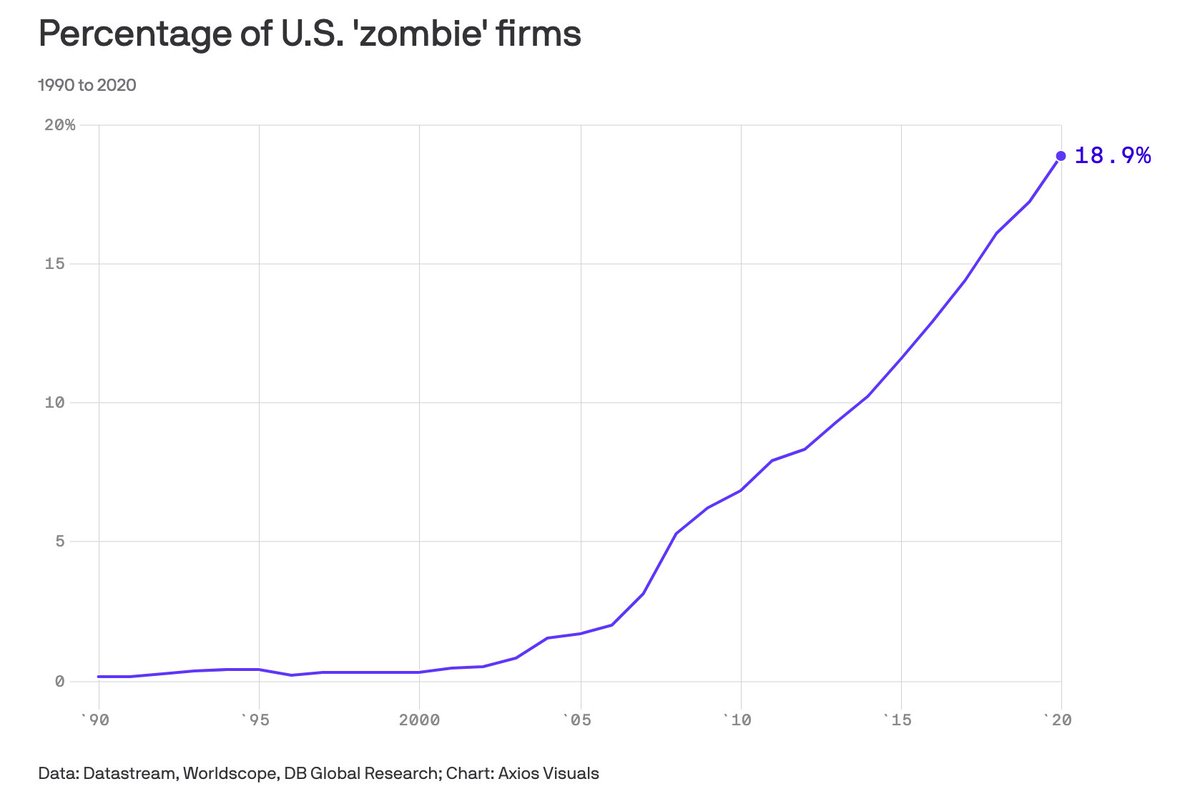
Looking for a "creative destruction" measure... zombie company share of total firms, bankruptcy rates from 1980-on, etc.
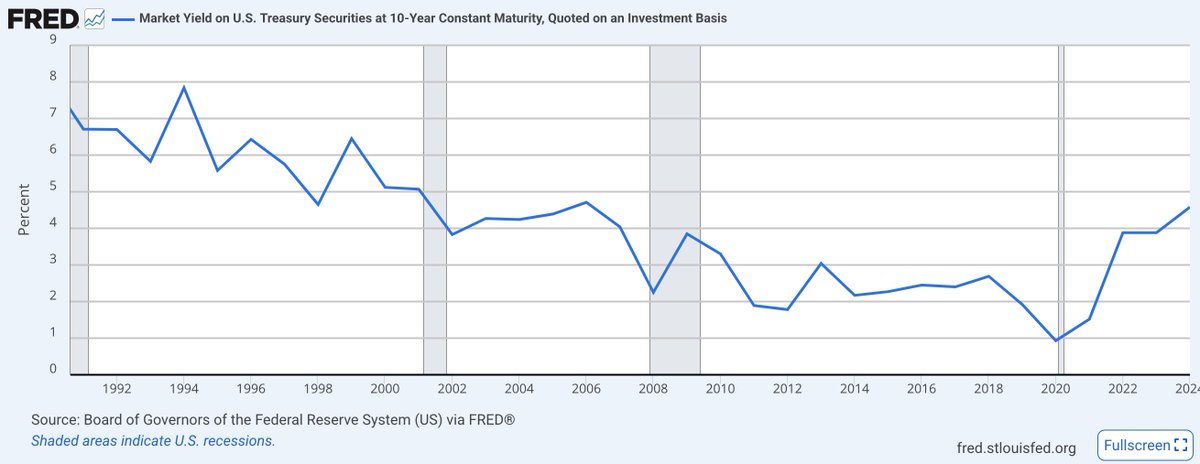
With the sustained rise in yields and "1/3 of corporate debt maturing 2025-2027" -- what's the best data to track that cycle?
Reading "Price of Time" by Chancellor for the first time (which is excellent).
Adapted the Babylon, Greece and Rome charts on U-shaped interest rate curves to other examples. In short, rates decline in prosperity and rise sharply during periods of decline and fall.
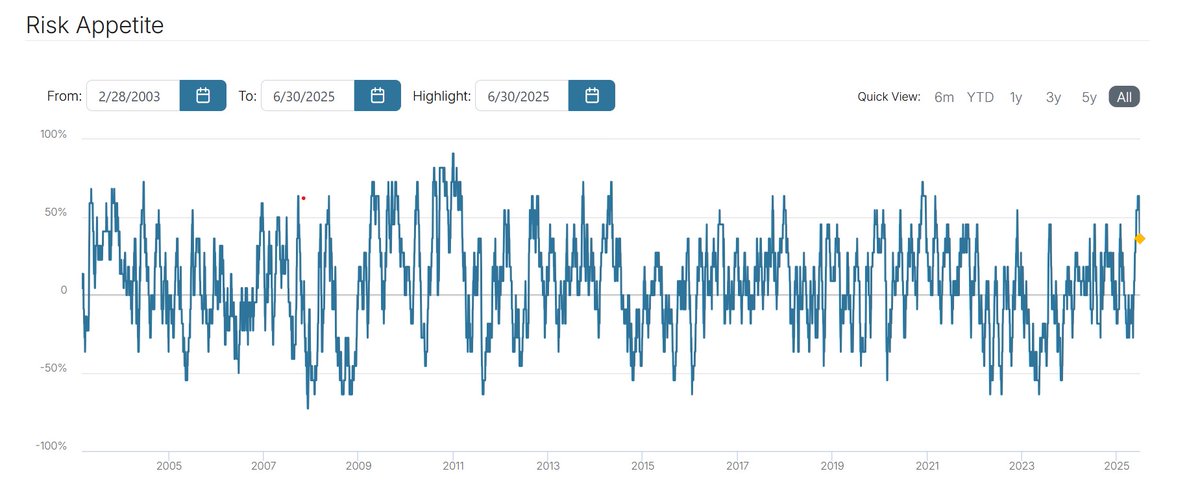
Was looking for data/indexes that track risk taking behavior in aggregate and came across State Street's indicator.
One of the highest reads in net flows for risk appetite for March - June.
https://t.co/RuNjMLpMrv
Interesting data/divergence pointed out from @profplum99 in this interview.
Not something we've seen before where Consumer Sentiment so far off from the Misery Index... Rise of AI, lack of purpose, nihilism, vibecession, K-shaped economy, etc.
CAUTION: the all-important passive capital inflows into stocks are starting to show signs of flattening, perhaps even on the verge of contracting, reports money manager Mike Green @profplum99
Is the 'giant mindless robot' in danger of going into reverse?https://t.co/QUbDu7B67Q
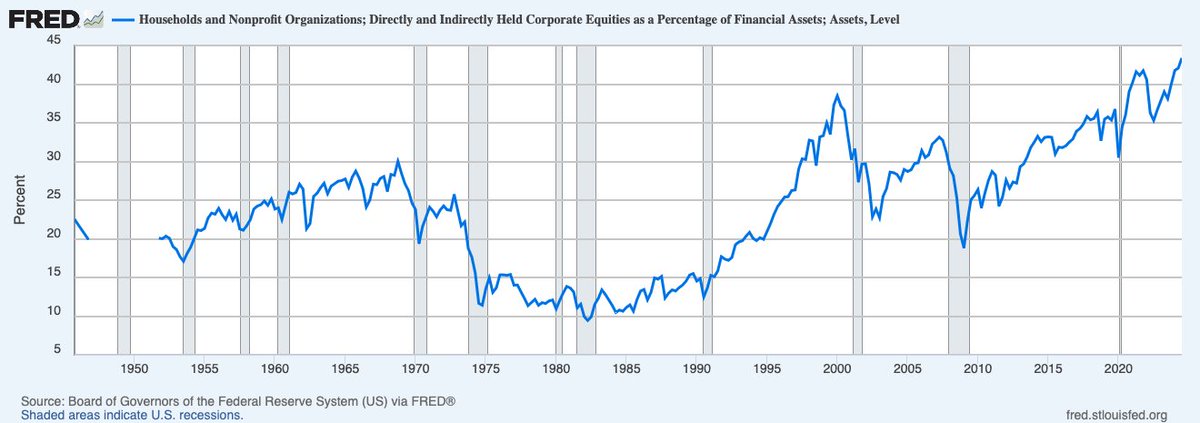
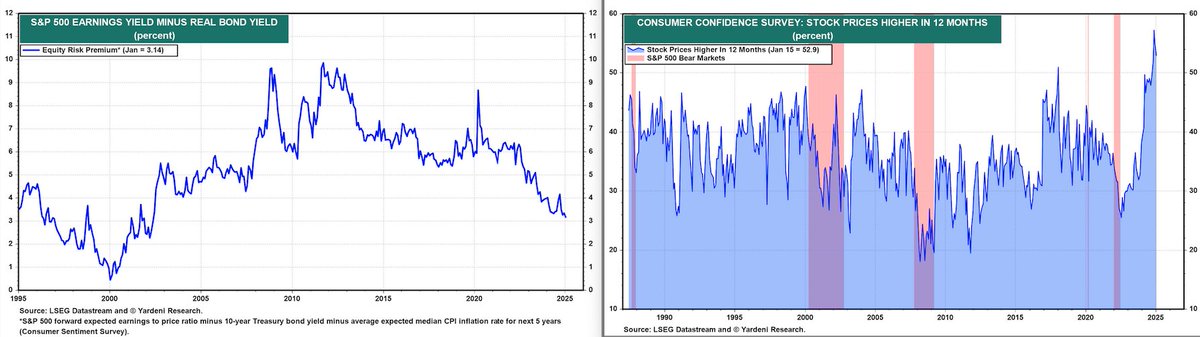
From Howard Marks on measuring capital market cycles. What data would you track to asses this?
Sentiment, credit spreads, venture/PE activity, financial assets % share, equity risk premiums. What else?
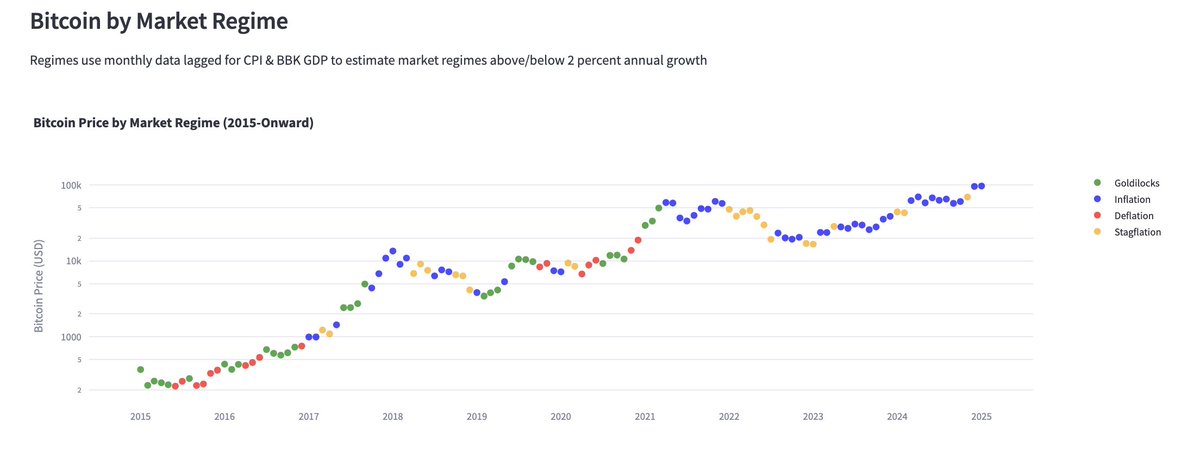
A simple view of market regimes and Bitcoin's price measuring monthly US inflation and growth (very basic above or below 2%).
Much more sophisticated market regime work out there but working through my versions of it.
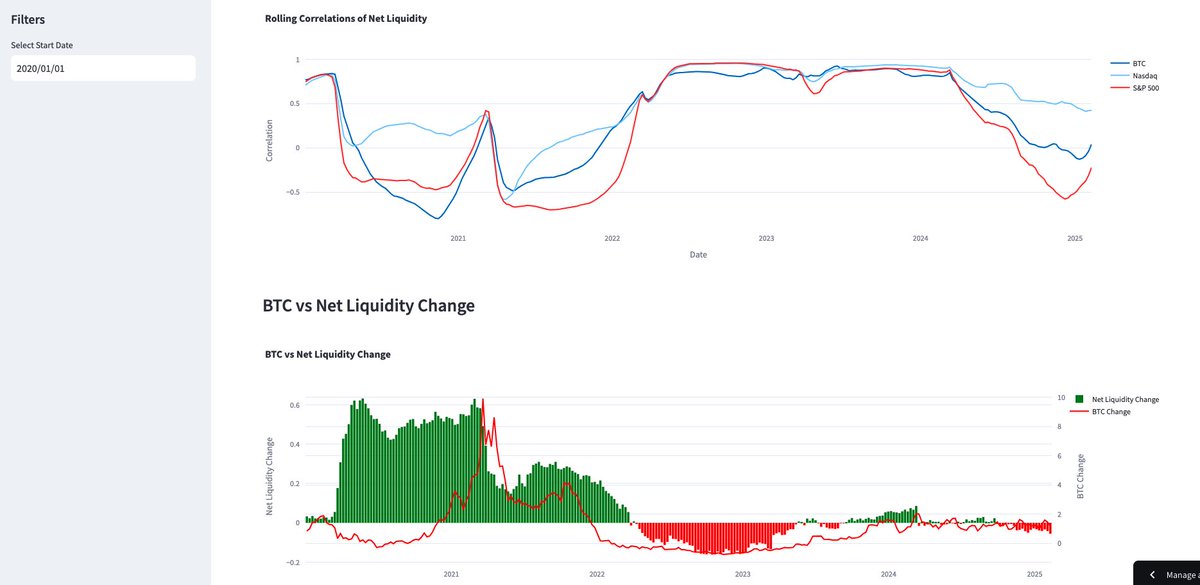
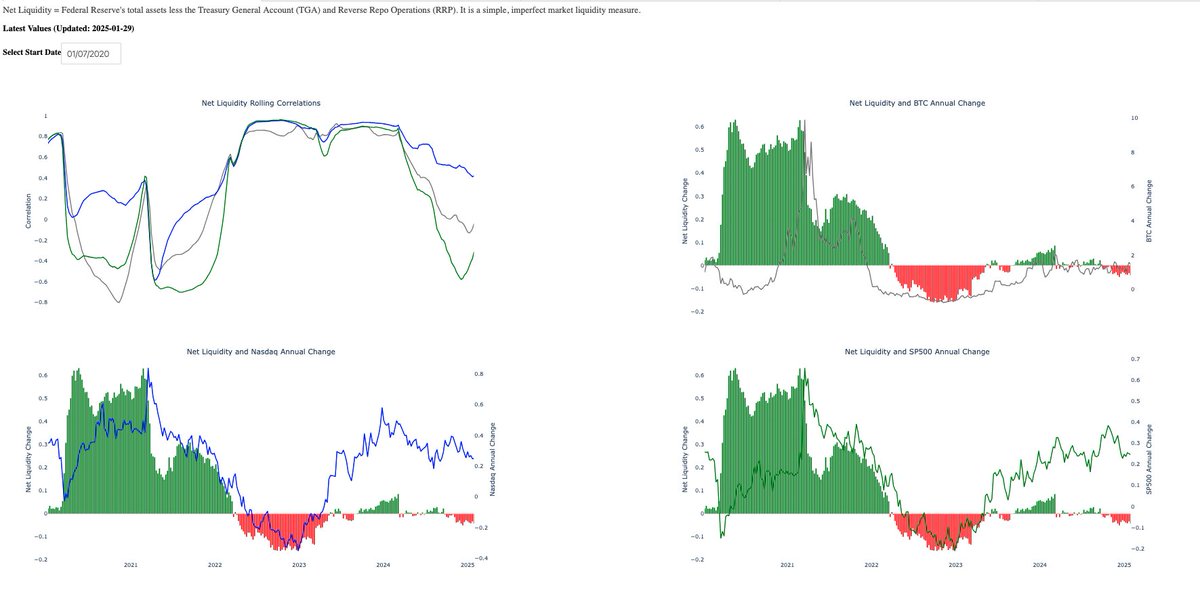
Didn't know how clean @streamlit was... A "work in progress" project but starting to collect and share different market data I find interesting here. FRED data, updates nightly. Adding as I go.
https://t.co/GhAvpjedlD
Back to sharing some of my investment analytics work for fun when I have the time.
This is an attempt to create an index around the BTC open interest market (futures, options and perps).
Today is my last with @BitcoinMagazine and @UTXOmgmt.
Grateful they took a chance on me and gave me the opp to work in this space full-time. I’m not active much on here these days but a huge thank you to everyone who engaged with my work. As it goes, tick tock #bitcoin
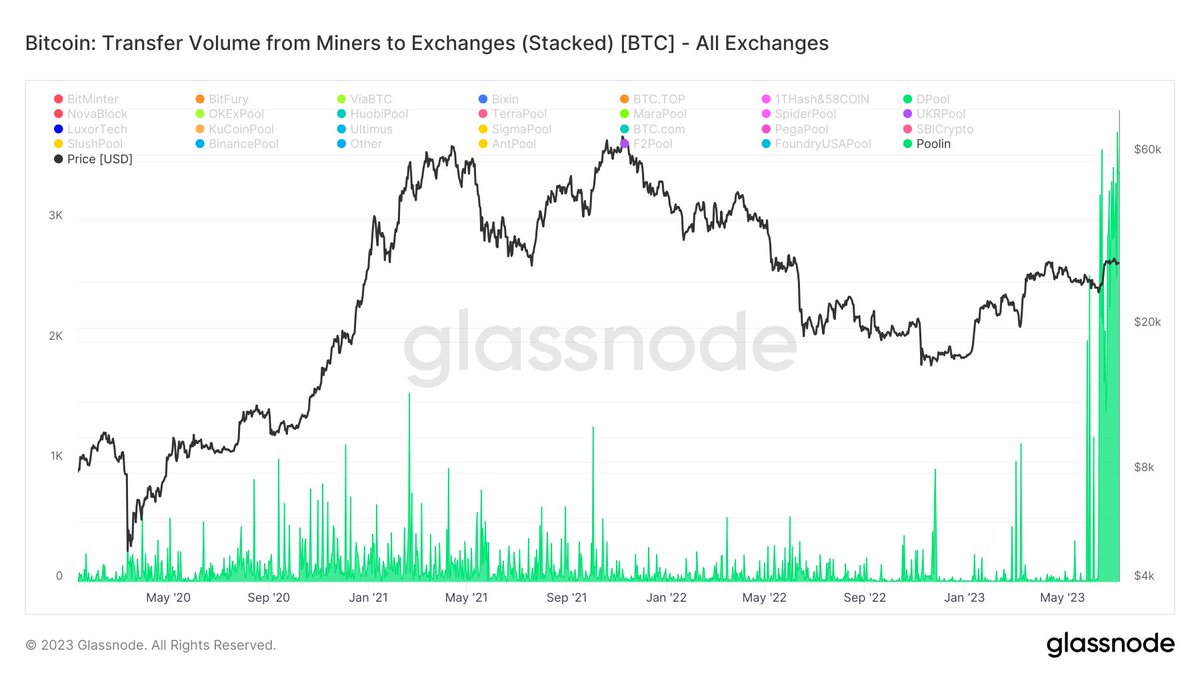
Bitcoin (that aspirational digital store of value) seems to be shrugging off the rise in real rates, anticipating the possibility of a spot ETF. This chart suggests that Bitcoin is slightly ahead of itself, based on its adoption curve and the macro real-rate environment.
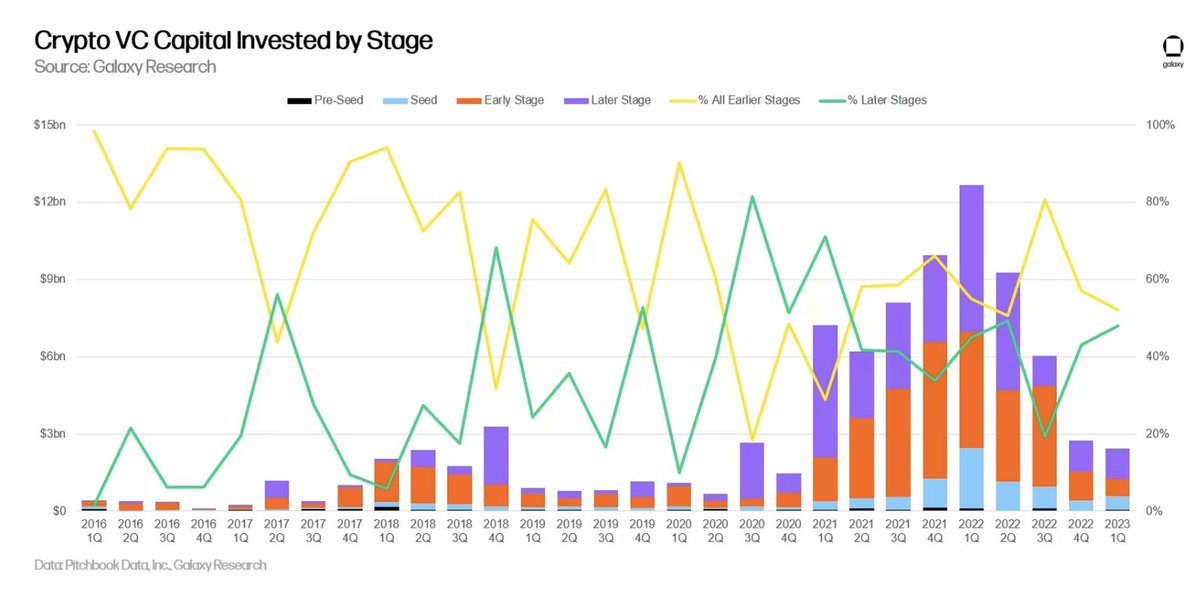
Anyone know of a specific database or hub for #Bitcoin specific venture deals? Funding amounts, valuations, product categories, etc.
Something like this from @glxyresearch
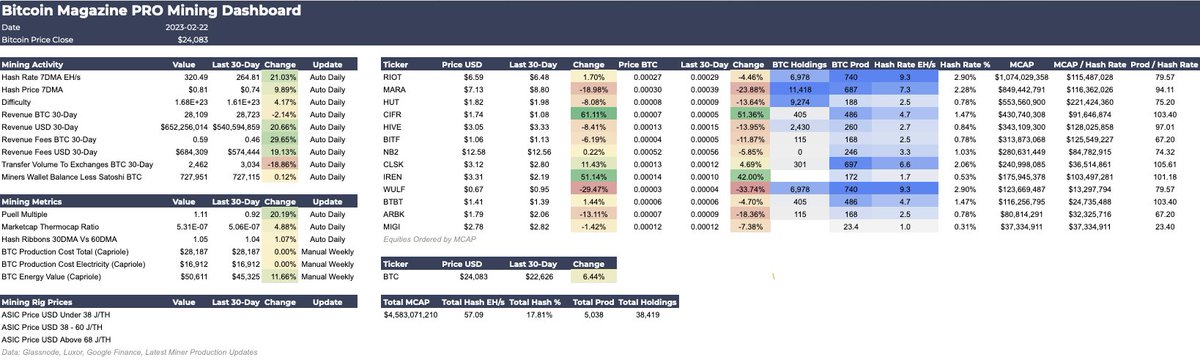
After some public miner stocks up 100%+ from historic lows to start 2023, tides turning again with nearly all under performing btc over last 30 days.
Some new production updates out this month with this group of public miners having ~23% of hash rate.
https://t.co/ukuio9ZdaO