A lot of accounts are calling a top. Here's why most are early and how you'll know when it's real.
A top isn't a price. It isn't a valuation multiple. It isn't a feeling. A top is a structural condition. And it can only be confirmed after the fact. What you CAN track in real-time is whether the conditions are stacking.
We monitor five:
1. THE FLOOR NARROWS
The GEX flip cushion is the structural insurance underneath the market. All cycle it sat at 8-10% below price. A crash needed to be 9% just to break the floor. When that cushion shrinks to 3%, then 2%, then 1%, the insurance is disappearing. Yesterday we watched it briefly shrink from 9.1% to 3.9% in one session. It recovered today. When it doesn't recover, that's the first warning.
2. THE FUEL RUNS OUT
The mechanical engine runs on put decay. 12M puts decaying daily force dealers to buy shares. When institutions stop buying puts, the fuel source dries up. The P/C ratio dropping from 2.61 to 2.12 over the last month is early evidence. Fewer puts means less decay means less mechanical bid. The engine doesn't break. It starves.
3. CORRELATIONS SPIKE
When everything becomes one trade, one catalyst unwinds everything. We track this daily with our correlation scanner. Average pairwise correlation below 0.40 is healthy dispersion. Above 0.55 is herding. Above 0.70 is liquidation. Right now we're at 0.37. The SPY-TLT correlation at the 100th percentile is the early flag. When the broad correlation follows, the diversification that protects portfolios collapses.
4. THE REBUILDS FAIL
Every selloff this cycle, the structure rebuilt within 1-3 sessions. May 15 gamma cliff: rebuilt in 3 days. May 19 NVDA selloff: rebuilt in 2 days. June 3 Iran shock: rebuilt in 4 hours with a new flow record. The afternoon institutional build showed up every single time. When the structure inverts and the afternoon build doesn't come, the recovery pattern is broken. That's the signal that the character changed.
5. THE MAGNETS DISAPPEAR
All cycle we tracked 10:1 and 16:1 magnet-to-accelerator ratios above price. The path of least resistance was always up because the magnets above vastly outnumbered the accelerators below. When that ratio inverts and accelerators dominate above price, the structural gravity flips from pulling the market up to pushing it down.
HOW THEY STACK:
One condition alone is a warning. Two is a watch. Three or more simultaneously is the regime change. Right now we have one: SPY-TLT at extreme correlation. That's a warning, not a top.
February to March was NOT a top. The market dropped 7.7%. Then every condition resolved. The builds returned. The floor held. The magnets reasserted. The engine rebuilt. Price made new highs. That was a pullback within a trend, not a structural top.
A REAL TOP looks like this: the floor narrows and stays narrow. The fuel thins and doesn't refill. Correlations spike and stay elevated. The afternoon build stops showing up. The magnets disappear above price. All happening together. Not one. All.
We track these five conditions every session. When they stack, we'll publish it the same way we published the rising wedge, the gamma cliff, and the correlation study. Before the event. With the data. On the record.
Until the structure breaks, every selloff is a dip within a trend. The day the structure breaks and doesn't recover, that's the top. Not a prediction. A structural diagnosis.
We'll know it when the data shows it. So will you.
$SPY $QQQ $VIX
SPX GEX LEVELS: May 26
The energy shock that drove hot CPI, hot PPI, and two months of Hormuz anxiety might be unwinding tonight. WTI crude dropped 5.8%.
🚨🚨Tuesday's expected range: 7,400 – 7,550. Bias higher toward 7,500 on the oil collapse. If WTI holds below $100, the range shifts up.
Nikkei is reporting the US and Iran are discussing a plan to reopen the Strait of Hormuz approximately 30 days after reaching a deal to end hostilities. If that framework holds, the supply disruption that pushed oil above $104 and drove the hottest inflation prints since 2023 starts reversing on a known timeline.
At the same time, CENTCOM confirmed self-defense strikes in southern Iran tonight targeting missile launch sites and boats placing mines. Massive explosions reported across Bandar Abbas, Sirik, Jask, and surrounding military sites. Trump demanded Iran's enriched uranium be turned over or destroyed.
Both tracks are running simultaneously. Military pressure and diplomatic progress. The oil market is pricing the deal, not the strikes — crude down 5.8% tells you the commodity traders believe an agreement is coming.
Here's what it means for the gamma structure.
Net GEX held at +$1.08B into the long weekend. The 7,500 max magnet carries +$171M, 27 points above Friday's close. The center of gravity sits at 7,595, 1.6% above spot, still the most bullish skew we've recorded. The magnets ladder cleanly above: 7,600 (+$121M), 7,700 (+$62M), 7,800 (+$47M). Every strike from 7,400 to 7,800 is positive gamma.
If oil's decline holds into Tuesday's open, the energy shock repricing is structurally bullish. Lower oil means lower inflation expectations, which gives Warsh latitude on rates, which stabilizes yields, which supports equity multiples. That's the chain reaction the market has been waiting for since the Hormuz blockade began.
Our oil duration research showed SPY forward returns deteriorate monotonically the longer WTI stays above $100. A sustained break below $100 resets the clock entirely and removes the single largest headwind for equities since March.
The flip cluster consolidated to 17 levels, the highest at 7,395, 79 points below. That's adequate cushion. The zone from 7,000 to 7,350 remains negative gamma with the 7,000 accelerator at -$25M. But the accelerator zone matters less if the macro backdrop is shifting from inflationary headwind to deflationary tailwind.
Two buy signals remain active. The inflation matrix (both hot): day 13 of 20. The CPI hot selloff edge: day 14 of 20. Both are in the back half of their windows with positive forward returns intact.
The first full session under Fed Chair Warsh was quiet Friday, no public remarks moved yields. Tuesday is the first test of whether Warsh plus a Hormuz deal plus oil below $100 creates the combination that pushes the market to new highs.
$SPX $SPY
QQQ PRE-MARKET | Monday May 25 (Memorial Day) | Tuesday Setup
$717.54 close. Oil down 5.8%. The chain reaction that matters most for QQQ just started.
Our Composite Score: -2.8 [Neutral]
THE QQQ CASE:
We published the SPX setup tonight. Here's why the same thesis hits QQQ harder.
Lower oil means lower inflation expectations. Lower inflation gives Warsh latitude on rates. Rate stability brings down the long end. Lower yields lift equity multiples. And no sector is more sensitive to that chain than tech.
QQQ is a duration bet. When the 30-year sits at 5.2%, tech multiples compress because future earnings are discounted at higher rates. If oil breaks below $100 sustainably and the inflation narrative reverses, the 30-year starts coming in. That's the multiple expansion QQQ has been waiting for since yields hit 18-year highs.
Oil down 5.8% tonight isn't a one-day trade. If Hormuz reopens on a 30-day timeline, energy prices reprice structurally. That reprices inflation. That reprices the entire yield curve. That reprices QQQ.
THE STRUCTURE:
GEX: +$44M total. Near-term: -$5M. Barely positive. The structure is thin heading into Tuesday. Not suppressive. Not amplifying. Neutral. That means the macro drives the tape, not the options mechanics. If oil's decline holds, the structure won't fight it.
Magnets above:
$720: +$27M (0.3% above)
$725: +$43M (1.0% above)
$730: +$48M (1.7% above)
$735: +$25M
$740: +$35M
$750: +$37M
The magnets ladder cleanly from $720 to $750. Every step above is positive gamma. No resistance until $750.
Accelerators below:
$700: -$28M (2.4% below)
$680: -$27M (5.2% below)
$650: -$30M (9.4% below)
The downside exists but the accelerators are far and small. The nearest is 2.4% below. Minimal near-term risk in the structure.
GEX flip: $654. Cushion: 8.6%. Deep floor. The structural insurance is intact.
IV: 26.1%. Spread: +8.9% above realized. Options are expensive. If oil's decline triggers a risk-on rally, IV compresses. QQQ has the most room for vol compression of any major ETF right now. A 9-point spread collapsing toward realized means significant mechanical support.
IV skew: -4.46%. Bullish. Calls significantly more expensive than puts. The demand for QQQ upside is priced into the options chain. The market was already positioned for this before oil moved.
Dealers short 138.8M. The engine is ready. Any gap higher forces dealer buying at the open.
Call VWAS: $736. Targeting 4% above legacy OI. The new call positioning is aimed at $730-$740. That's 2-3% above current price. The flow built into Friday's close was reaching for exactly the move oil is now enabling.
THE NVDA OVERHANG:
NVDA's vanna unwind should be mostly exhausted by Tuesday. IV crushed from 63% to 41% over two sessions. The mechanical selling pressure that dragged NVDA from $227 to $215 loses its force as IV approaches realized. If NVDA stabilizes above $215 and the oil collapse lifts the broader tech complex, the supply chain trade (NVDA, MU, AVGO) reaccelerates.
OUR THE INFLATION MATRIX:
QQQ Both Hot signal: Day 13 of 20. Target: +2.67%, 81% win rate (p = 0.006). The strongest statistical signal in our dataset. If oil's decline accelerates the inflation repricing, the matrix return could front-load in the final week of the window.
This is the catalyst the signal was waiting for. Both Hot said the market handles inflation when CPI and PPI agree. A sustained oil decline doesn't just handle it. It reverses it.
IRAN AND HORMUZ:
Nikkei reports the US and Iran are discussing a plan to reopen Hormuz approximately 30 days after reaching a deal. CENTCOM simultaneously struck military targets across southern Iran tonight. Military pressure and diplomatic progress running in parallel.
The oil market is pricing the deal, not the strikes. Crude down 5.8% tells you the commodity traders believe an agreement is coming. If they're right, the energy shock that drove the hottest inflation since 2023 starts reversing on a known timeline.
The bottom line:
QQQ is a leveraged bet on the chain reaction that just started. Oil down means inflation down means yields down means tech multiples up. No sector benefits more from a Hormuz resolution than the one most sensitive to discount rates.
The structure is thin but the magnets are above. The IV is expensive with room to compress. The inflation matrix is in its final week. NVDA's overhang is fading. And oil just dropped 5.8%.
Tuesday morning. The macro does the heavy lifting. The mechanics don't fight it.
$QQQ $NVDA $SPY
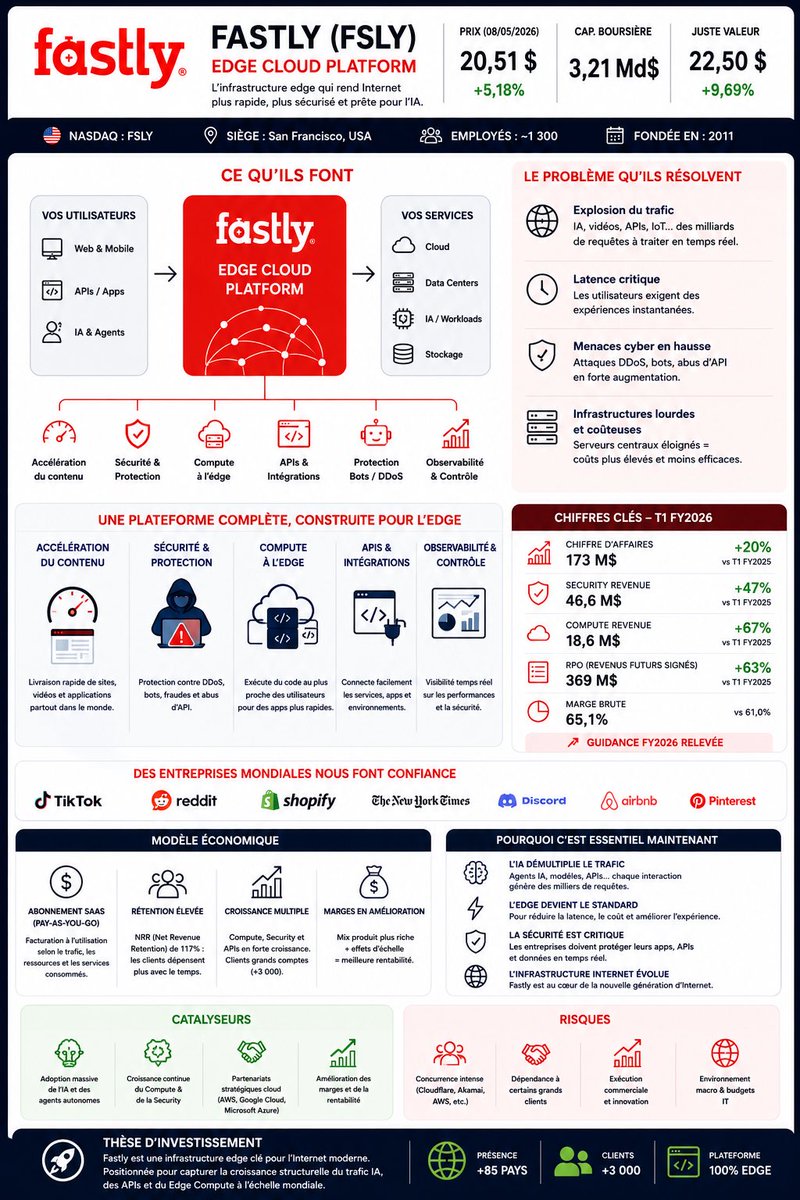
⚡ $FSLY
Internet entre dans une nouvelle phase.
Avant, le web servait surtout à afficher des pages, regarder des vidéos ou utiliser quelques applications.
Aujourd’hui tout devient :
• temps réel
• connecté
• piloté par des APIs
• alimenté par l’IA
Demain, des millions d’agents IA vont communiquer entre eux en permanence :
→ appels API
→ échanges de données
→ calculs temps réel
→ automatisation massive
Le problème, c’est que l’infrastructure Internet actuelle devient trop centralisée.
Quand les données doivent voyager très loin vers quelques gros data centers :
• la latence augmente
• les coûts explosent
• les applications ralentissent
• les risques cyber augmentent
Et avec l’IA, ce problème devient énorme.
C’est exactement là où Fastly intervient.
Fastly $FDLY construit une couche “Edge Cloud”.
L’idée est simple :
rapprocher la puissance informatique des utilisateurs.
Au lieu de :
Utilisateur → cloud très loin → réponse lente
Fastly fait :
Utilisateur → réseau Fastly local → réponse immédiate
Résultat :
⚡ moins de latence
🛡️ plus de sécurité
☁️ meilleur edge compute
📡 meilleure gestion du trafic
🤖 infrastructure adaptée à l’IA
Ils ne vendent pas juste “des sites plus rapides”.
Ils construisent :
• accélération web
• cybersécurité
• protection APIs
• protection bots/DDoS
• edge compute
• infrastructure réseau temps réel
Et c’est là où la thèse devient intéressante :
L’IA ne réduit pas le besoin d’infrastructure.
Elle l’explose.
Chaque agent IA génère énormément plus de trafic qu’un Internet classique.
Donc :
plus d’IA
=
plus de besoin :
• d’edge compute
• de faible latence
• de cybersécurité
• d’infrastructure distribuée
Pendant longtemps Fastly était vu comme :
“un simple CDN”.
Mais le marché commence à comprendre que leur vraie valeur est peut-être ailleurs :
⚡ devenir une couche critique du futur Internet IA.
Les derniers résultats vont dans ce sens :
📈 CA +20%
🛡️ Security +47%
☁️ Compute +67%
📄 RPO +63%
Le plus important :
les segments liés au futur accélèrent fortement.
Le risque reste réel :
Cloudflare, AWS et Akamai sont énormes.
Mais si l’IA continue d’augmenter le trafic mondial comme attendu,
les infrastructures edge pourraient devenir aussi stratégiques que le cloud l’a été ces 15 dernières années.
Et Fastly est déjà positionné exactement au croisement de cette tendance
🚨 Les stablecoins représentent désormais +315 milliards $ dans l’écosystème crypto.
USDC, USDT, EURC, EUROe… pourquoi ces cryptos “stables” deviennent-elles aussi importantes pour les investisseurs et la DeFi ? 👀
👉 Fonctionnement
👉 Risques
👉 Régulation
👉 Opportunités 2026
On décrypte tout ici 👇
https://t.co/n3rAXMQ2mc
#Stablecoin #Bitcoin #Crypto #USDC #USDT #Ethereum #DeFi #Blockchain #Finance #BTC
You're a millionaire trader in 12 months (timeline for self-study)..
Print this off then check it off when you have mastered the concept.
Months 0–1
1. Risk management
Only risk fixed amounts daily and survive long enough to improve consistently.
2. One setup mastery
Trade only one repeatable setup daily until execution becomes completely automatic.
3. Stop-loss discipline
Exit immediately at invalidation level without hesitation, hope, fear, or revenge.
4. Emotional control
Detach emotions from outcomes and focus entirely on process and execution.
5. Market awareness
Understand market trend, key levels, news events, and overall market sentiment.
6. Journal everything
Record every trade, mistake, emotion, and lesson after market closes daily.
Months 2–3
7. Patience mastery
Wait hours for A+ setups instead of forcing random low-quality trades.
8. Entry precision
Enter only near support, resistance, retests, or strong confirmation zones consistently.
9. Reward-to-risk understanding
Take trades minimum 2:1 reward-risk with asymmetric upside potential always available.
10. Position sizing
Increase size slowly only after consistency and emotional stability are fully proven.
11. Routine building
Create identical daily premarket, trading, and postmarket review habits every day.
12. Selling discipline
Hold winners until targets hit instead of selling early from fear repeatedly.
Months 4–6
13. Price action reading
Study candles, liquidity, momentum shifts, and market structure every single session.
14. Market psychology
Recognize fear, greed, manipulation, traps, and emotional crowd behavior quickly daily.
15. Trading fewer setups
Focus on highest probability opportunities instead of overtrading unnecessary market noise constantly.
16. Capital preservation
Protect account aggressively during difficult periods and reduce size after consecutive losses.
17. Macro understanding
Track interest rates, inflation, earnings, bonds, and geopolitical market-moving catalysts daily.
18. Confidence building
Trust proven strategy statistics instead of reacting emotionally during temporary drawdowns.
Months 7–9
19. Consistency focus
Prioritize consistent execution daily instead of chasing massive unrealistic trading profits immediately.
20. Advanced journaling
Analyze recurring behavioral mistakes weekly and systematically eliminate emotional execution weaknesses.
21. Holding runners
Allow strong trends to continue instead of exiting profitable trades too early.
22. Adapting to volatility
Adjust position sizing and expectations depending on current market conditions intelligently daily.
23. Time management
Trade only optimal hours and avoid random impulsive trades outside plan entirely.
24. Building edge
Refine setups through statistics, repetition, and identifying unique repeatable market advantages consistently.
Months 10–12
25. Scaling responsibly
Increase size carefully while maintaining same emotional discipline and execution quality daily.
26. Protecting mental health
Sleep properly, exercise consistently, and avoid burnout affecting trading decisions negatively.
27. Advanced execution
Master scaling in, scaling out, and managing trades during high volatility environments.
28. Wealth preservation
Focus on protecting profits, taxes, cash flow, and long-term wealth compounding strategically.
29. Business mindset
Treat trading professionally with systems, routines, discipline, and measurable performance tracking daily.
30. Millionaire mindset
Think long-term, stay process-driven, and compound small advantages relentlessly every single day.
In 2 years, POET grew 18000% from $1 to $16 so far.
When POET was trading at $4, I said, "This is the NEXT AMD" in AI. No one listened.
Here's my favorite 14 photonics AI stocks to focus on:
1. AEHR | Aehr Test Systems (~$96)
Tests photonic burn-in every hyperscaler order runs through them.
Buy zone: $60–$70
2. AAOI | Applied Optoelectronics (~$163)
800G/1.6T transceiver wins with MSFT backlog accelerating fast.
Buy zone: $80–$90
3. LITE | Lumentum Holdings (~$881)
$2B NVIDIA deal. OCS backlog sold out through 2027.
Buy zone: $550–$600
4. CIEN | Ciena (~$520)
WaveLogic 6 DSP dominates. 45% backlog surge signals runway ahead.
Buy zone: $300–$300
5. MRVL | Marvell Technology (~$163)
Custom AI ASICs + optical DSP NVIDIA $2B partnership confirmed.
Buy zone: $100–$120
6. GLW | Corning (~$175)
Fiber monopoly. $6B Meta deal funds AI data center buildout.
Buy zone: $120–$130
7. COHR | Coherent Corp (~$340)
Deepest optical platform. Book-to-bill above 4x — capacity constrained.
Buy zone: $220–$230
8. MTSI | MACOM Technology (~$288)
LPO tech cuts DSP cost. 3.2T roadmap positioned for next cycle.
Buy zone: $220–$230
9. FN | Fabrinet (~$720)
Manufactures for everyone optical foundry with zero customer drama.
Buy zone: $480–$500
10. CRDO | Credo Technology (~$195)
201% YoY revenue growth. DustPhotonics deal adds silicon photonics IP.
Buy zone: $90–$100
11. VIAV | Viavi Solutions (~$45)
Hidden alpha. Test infrastructure every optical vendor relies on.
Buy zone: $25–$30
12. AXTI | AXT Inc (~$76)
InP wafer chokepoint. $60M backlog. Doubling capacity by end-2026.
Buy zone: $40–$45
13. LWLG | Lightwave Logic (~$15)
EO polymer tech could replace lithium niobate. 4 Fortune 500 design-wins.
Buy zone: $7–$8
14. POET | POET Technologies (~$16)
Optical interposer on a single chip. Marvell order = first real commercial signal.
Buy zone: $6–$8
Remember, LWLG and POET are early-stage plays on a real AI bottleneck: moving data faster and more efficiently inside data centers.
LWLG is developing polymer-based optical tech that could outperform current materials with lower power and higher speed.
POET is building integrated optical chips that simplify and reduce the cost of high-speed data transmission.
These stocks can both hit $100+ in less then 2 years but it will require strong adoption, major partnerships, and a continued AI-driven market rally.
♻️ RESHARE this post and reply with 1 comment for my trading strategy for FOMC on April 29.
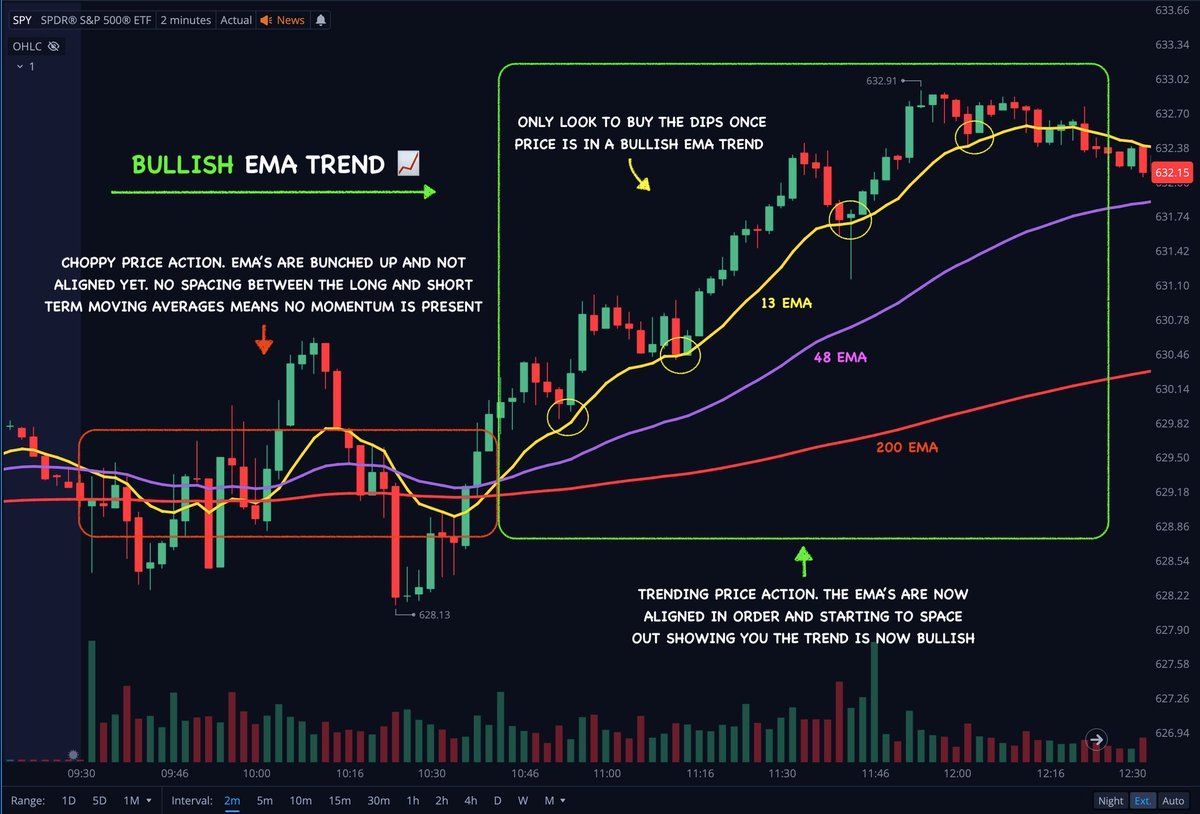
$SPY • I love my EMA trend system! It helps me avoid chop and trade the momentum 🧵
Here’s how it works…
Add the 13 • 48 • 200 EMA’s onto the 2 minute chart (ext hours on)
• Bullish EMA trend 📈
13 EMA top 🟡
48 EMA middle 🟣
200 EMA bottom 🔴
Favor calls in a bullish trend.
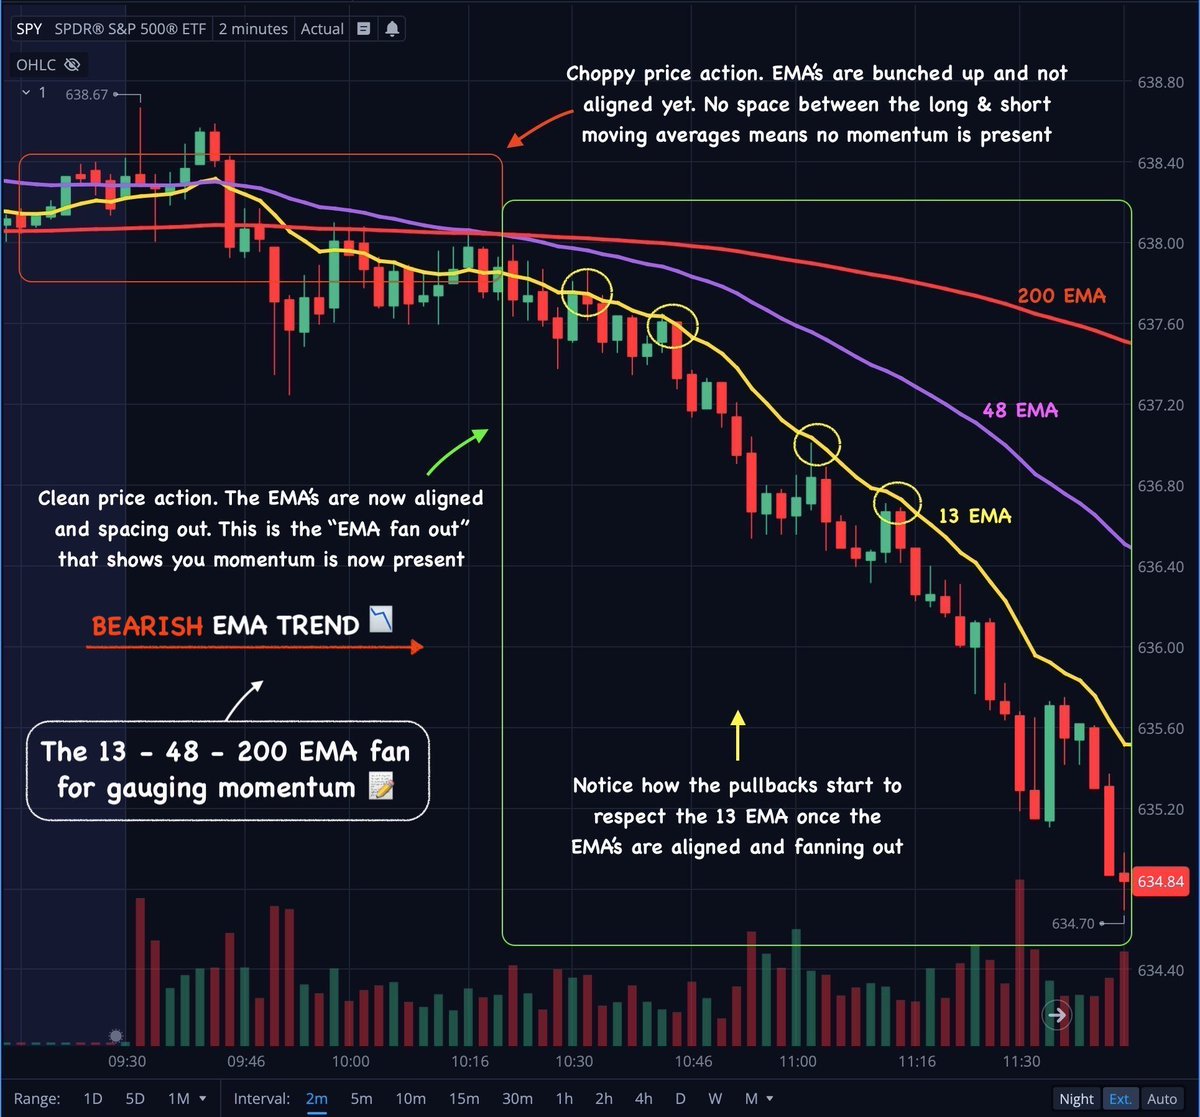
• Bearish EMA trend 📉
200 EMA top 🔴
48 EMA middle 🟣
13 EMA bottom 🟡
Favor puts in a bearish trend.
Now… This next part is important!
When the 3 EMA’s are tightly stacked it’s a clear sign of chop ❌
When the 3 EMA’s start to space out it’s a clear sign of momentum ✅
Aim to only place trades while price is showing momentum in the EMA trends.
Stay cautious in the areas with no EMA spacing / momentum. That is where most get chopped up👇
FİNANS PİYASALARINI GERÇEKTEN ANLAMAK İSTİYOR MUSUN?
Bu 1 saatlik Bloomberg Terminal dersi, çoğu kişinin hayalini kurduğu 2 aylık Goldman Sachs stajından daha fazlasını öğretecek.
Terminal yıllık $30.000.
Ama bu ders bedava.
Bu hafta kendine yapacağın en iyi yatırım bu olacak.
Zamanın yoksa kaydet. Sonra izle.
Les RWA vont prendre de plus en plus de place dans les années à venir.
La demande est là et les clients répondent présents.
👉Actuellement, le marché est estimé à 30 milliards de dollars
🎯Pour 2027, on s'attend à ce que le marché dépasse les 150 milliards de dollars
On retrouve de très nombreux acteurs dans le secteur comme $ONDO ; $QNT ; $SYRUP ; $XDC ou encore $CFG
Claude a maintenant accès en temps réel aux cotations boursières et données d'options.
Vous pouvez récupérer cours, scanner chaînes d'options, vérifier Greeks, et visualiser votre portefeuille sans quitter le chat.
Voici comment connecter l'API (gratuite) étape par étape :
[ Ajoute en Signet 🔖pour ne pas perdre ! ]
@InvestNomade@lasouch38 Qu’ ils comprennent pas pourquoi et qu ils m’offrent 10 euros 😂. Au moment de passer à la page vérification, ça tourne à l infini… J ai essayé avec différents navigateurs, aucun changement… Je pense qu il doit avoir y avoir une recherche matériel à ce moment là (webcam)


![alphaticaio's tweet photo. QQQ PRE-MARKET | Monday May 25 (Memorial Day) | Tuesday Setup
$717.54 close. Oil down 5.8%. The chain reaction that matters most for QQQ just started.
Our Composite Score: -2.8 [Neutral]
THE QQQ CASE:
We published the SPX setup tonight. Here's why the same thesis hits QQQ harder.
Lower oil means lower inflation expectations. Lower inflation gives Warsh latitude on rates. Rate stability brings down the long end. Lower yields lift equity multiples. And no sector is more sensitive to that chain than tech.
QQQ is a duration bet. When the 30-year sits at 5.2%, tech multiples compress because future earnings are discounted at higher rates. If oil breaks below $100 sustainably and the inflation narrative reverses, the 30-year starts coming in. That's the multiple expansion QQQ has been waiting for since yields hit 18-year highs.
Oil down 5.8% tonight isn't a one-day trade. If Hormuz reopens on a 30-day timeline, energy prices reprice structurally. That reprices inflation. That reprices the entire yield curve. That reprices QQQ.
THE STRUCTURE:
GEX: +$44M total. Near-term: -$5M. Barely positive. The structure is thin heading into Tuesday. Not suppressive. Not amplifying. Neutral. That means the macro drives the tape, not the options mechanics. If oil's decline holds, the structure won't fight it.
Magnets above:
$720: +$27M (0.3% above)
$725: +$43M (1.0% above)
$730: +$48M (1.7% above)
$735: +$25M
$740: +$35M
$750: +$37M
The magnets ladder cleanly from $720 to $750. Every step above is positive gamma. No resistance until $750.
Accelerators below:
$700: -$28M (2.4% below)
$680: -$27M (5.2% below)
$650: -$30M (9.4% below)
The downside exists but the accelerators are far and small. The nearest is 2.4% below. Minimal near-term risk in the structure.
GEX flip: $654. Cushion: 8.6%. Deep floor. The structural insurance is intact.
IV: 26.1%. Spread: +8.9% above realized. Options are expensive. If oil's decline triggers a risk-on rally, IV compresses. QQQ has the most room for vol compression of any major ETF right now. A 9-point spread collapsing toward realized means significant mechanical support.
IV skew: -4.46%. Bullish. Calls significantly more expensive than puts. The demand for QQQ upside is priced into the options chain. The market was already positioned for this before oil moved.
Dealers short 138.8M. The engine is ready. Any gap higher forces dealer buying at the open.
Call VWAS: $736. Targeting 4% above legacy OI. The new call positioning is aimed at $730-$740. That's 2-3% above current price. The flow built into Friday's close was reaching for exactly the move oil is now enabling.
THE NVDA OVERHANG:
NVDA's vanna unwind should be mostly exhausted by Tuesday. IV crushed from 63% to 41% over two sessions. The mechanical selling pressure that dragged NVDA from $227 to $215 loses its force as IV approaches realized. If NVDA stabilizes above $215 and the oil collapse lifts the broader tech complex, the supply chain trade (NVDA, MU, AVGO) reaccelerates.
OUR THE INFLATION MATRIX:
QQQ Both Hot signal: Day 13 of 20. Target: +2.67%, 81% win rate (p = 0.006). The strongest statistical signal in our dataset. If oil's decline accelerates the inflation repricing, the matrix return could front-load in the final week of the window.
This is the catalyst the signal was waiting for. Both Hot said the market handles inflation when CPI and PPI agree. A sustained oil decline doesn't just handle it. It reverses it.
IRAN AND HORMUZ:
Nikkei reports the US and Iran are discussing a plan to reopen Hormuz approximately 30 days after reaching a deal. CENTCOM simultaneously struck military targets across southern Iran tonight. Military pressure and diplomatic progress running in parallel.
The oil market is pricing the deal, not the strikes. Crude down 5.8% tells you the commodity traders believe an agreement is coming. If they're right, the energy shock that drove the hottest inflation since 2023 starts reversing on a known timeline.
The bottom line:
QQQ is a leveraged bet on the chain reaction that just started. Oil down means inflation down means yields down means tech multiples up. No sector benefits more from a Hormuz resolution than the one most sensitive to discount rates.
The structure is thin but the magnets are above. The IV is expensive with room to compress. The inflation matrix is in its final week. NVDA's overhang is fading. And oil just dropped 5.8%.
Tuesday morning. The macro does the heavy lifting. The mechanics don't fight it.
$QQQ $NVDA $SPY](https://pbs.twimg.com/media/HJNf3zRXcAAVuVh.jpg)