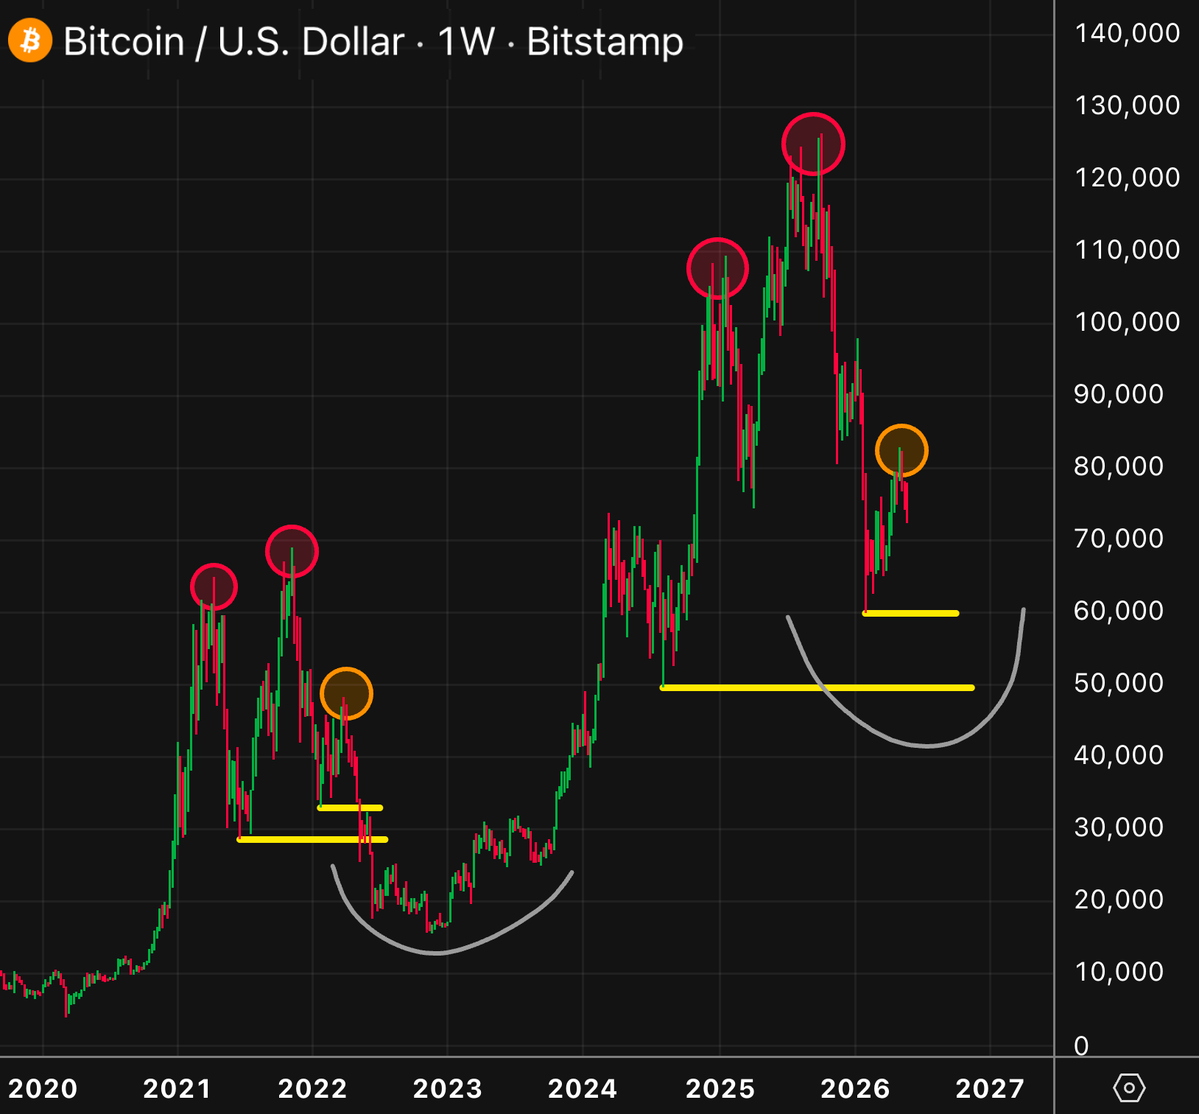
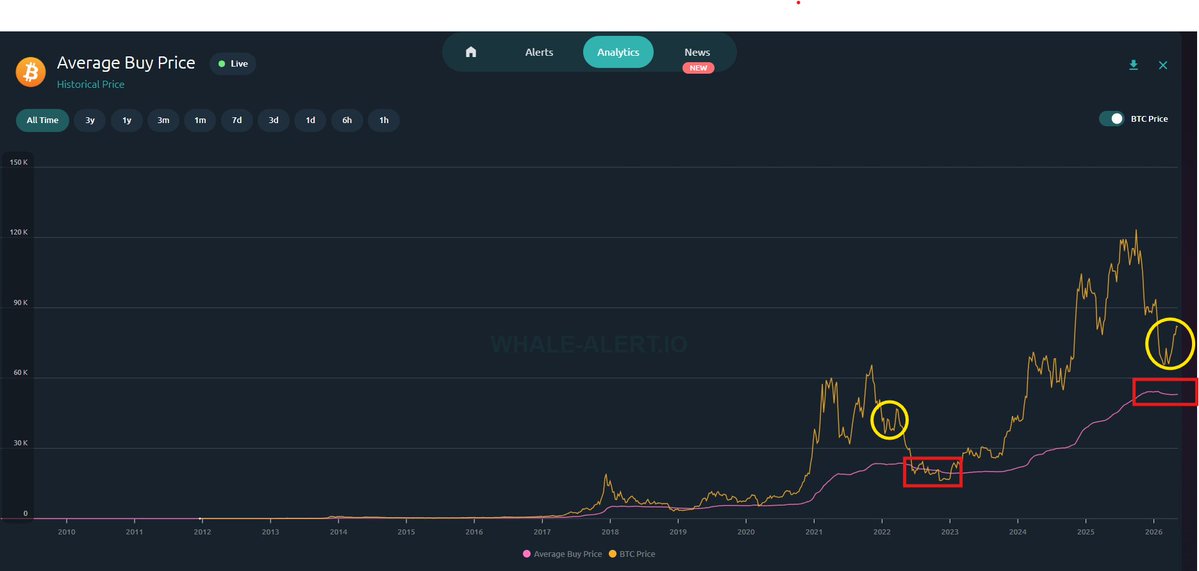
$BTC is entering it's final stage of the bear market.
Max pain to late shorts and bottom callers.
Every bear market, price has rested:
blue line ✅
yellow line
pink line
5th target box
I bought the right dip January 4, 2023 at $16,800. (green circle)
#Bitcoin broke 60K and took out the lower low.
Is this a bounce setup, or is the road lower opening up?
In the video:
• BTC weekly structure
• 4H wave count
• Bounce vs breakdown path
• DXY and ES correlation check
Full $BTC video is live.
#Elliottwave
NDR's pattern matching tool shows that the NASDAQ has closely tracked the dotcom analog and is closer to 1998 than 2000. It still suggests near-term volatility ahead.
🚨 WHY AM I BUYING BTC NOW? 🚨
I've been calling this bear cycle since 107k
Exited near the top, watched the entire drop play out
Now I'm starting to move in the other direction
Not because I think the bottom is in - I don't
Because waiting for confirmation means missing the best levels
The market is in extreme fear and snowballing lower with no positive catalyst in sight
Summer is coming - historically the deadest season for crypto and 90% of the narrative is negative
That's exactly when accumulation makes sense
In 2022 I did the same thing. Nobody wanted to touch BTC
So, here is my buy plan this cycle:
- 10% at 65k-67k
- 20% at 55k-60k
- 40% at 49k-52k - where MA 350 has ended every bear cycle
- 30% reserved if the market surprises further
The goal isn't the perfect entry
The goal is to not miss the cycle
NOTIFS ON!
Bitcoin is now perfectly following the Bear Cycle channel.
History is repeating itself, everything going according to my plan:
The $BTC pattern for 2026 is simple:
$82K → $71K → $48K → $55K → $41K
Next targets:
→ $72K in days
→ $41K by June
I called the $15k bottom in November 2022 and $126k top in October 2025.
If you missed those calls, don't worry. I'll call the next one too.
Follow now. I'll update you as this dump plays out.
Bitcoin: Dubious Speculation
In this video we talk about Bitcoin nearing the 200D SMA.
In 2018/2022, the 200D SMA was the local high.
In 2014/2019, BTC went slightly above.
In 2014/2018/2022, the lower high occurred around the 0.382 Fib retracement, which is around $85k.
But in 2018 and 2022 that corresponded to the 200D SMA.
Tough market to get right, but my guess is that a lower high is eventually formed and then BTC forms a major low in October 2026.
#BTC
Bitcoin continues to remain beneath the Macro Triangle it broke down from months ago
Bitcoin has never been able to reclaim a Macro Triangle once price had broken down from it
$BTC #Crypto#Bitcoin
Tom Lee says the May/June SPY crash will feel like hell, but you just buy the dip for SPY target $770+
Here's exactly what's coming from @fundstrat:
1/ The Timeline
New Fed chair confirmation is starting NOW.
Kevin Warsh. Senate floor vote could come 50-70 days after committee. That puts a new Fed chair in place by June-July 2026.
2/ History doesn't lie and it's horrifying
"10 of 13 Fed chairs had a drawdown of more than 10% in the first year. So I think it's more the rule than the exception that we're going to get a drawdown." says Tom Lee
Since 1930, the SPY has logged average drawdowns of 5%, 12%, and 16% over the 1-, 3-, and 6-month periods after a new Fed chief took the helm all larger than the typical peak-to-trough drop in a randomly selected year, per Barclays.
This isn't a black swan. It's a pattern.
3/ The Road Map
"We originally said that the market could get towards 7,300. And it looks like we're on a path towards that. We're well over 7,000. And then we'll have a decline that will feel like a bear market. Perhaps it's because of the market testing new Fed chair." — Tom Lee
The data backing this: The median intra-year drawdown from an all-time high in the SPT since 1980 is 10.4%. Statistically, there's a 50% chance the index drops 10% or more at some point in 2026.
Feel like a bear market = -15% to -20% easily on the table.
4/ But Mag 7, crypto, and software are ALREADY bleeding
"Keep in mind, a lot of the markets have already had a drawdown in the Mag 7, crypto, and software."— Tom Lee
The broad index hasn't felt it yet. Rotation is a warning shot, not a safety net.
5/ Then… the rally of a lifetime
"I think a rally follows because fundamentals are strengthening maybe one of the strongest rallies we'll see in our lifetime."— Tom Lee
Since 1980, the average intra-year drawdown has been over 14% yet the SPY has still averaged 10.7% annual gains during that same period. Double-digit drops have historically come with double-digit annual gains.
The flush is the setup.
6/ His final warning:
"Just a reminder just don't time the market, even if you're tempted to." says Tom Lee
So this is the full sequence:SPY → 7,300 than New Fed chair → 10-16% drawdown then rally of our lifetime
My entire buying strategy comes down to three steps:
trending on weekly
pullback to key moving average
consolidation breakout near 21EMA
that's it. everything else is noise.
Stick to these and you'll have better entries, zero fomo, actual discipline.
🚨 THE S&P 500 WON'T MOVE THE WAY YOU THINK
Please pay close attention:
1. The price is in an uptrend
2. The RSI is in a downtrend
3. The OBV is in a downtrend
When the price rises while volume and momentum fall, it means one thing:
“Smart money is selling on the rally, while retail investors are buying”
This is exactly what happened before the October 2025 peak
The same divergence. The same euphoria. The same result
I am convinced that this rise will soon turn into a decline
Don’t believe me?
Save this tweet and let’s see who’s right