$MINA — the structure is getting interesting.
Looking at the higher-timeframe structure, the current relief rally is approaching a major resistance zone around $0.197–$0.234.
If this structure continues to develop as expected, I’m watching for a rejection from this area, followed by another bearish leg.
The potential path I’m tracking is:
Resistance → rejection → lower high → continuation down → final capitulation.
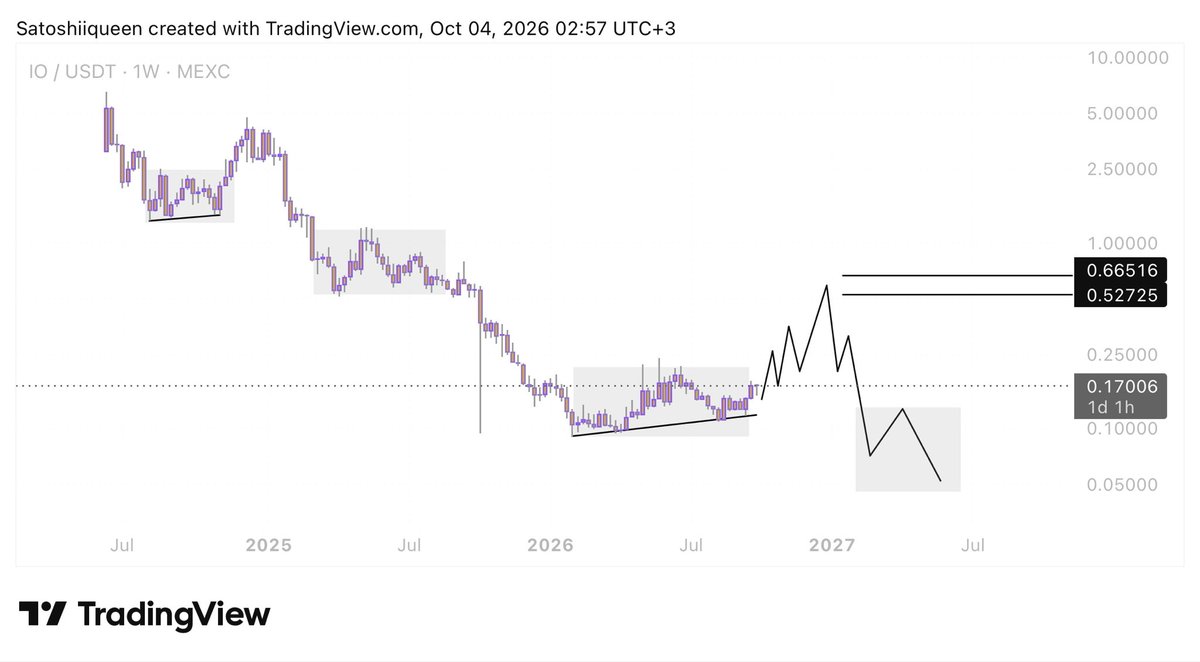
$IO — the structure is still pointing to a larger move before the next major leg down.
Price is currently consolidating around the $0.10–$0.20 range, and the structure suggests a relief rally could develop first.
My projected path:
→ Break higher from the current range
→ Multiple swings toward the $0.53–$0.66 resistance zone
→ Distribution / rejection
→ Bearish continuation
The key point is that I’m not expecting a straight-line move.
The market can create several bullish-looking swings on the way up before the larger bearish structure resumes.
$HBAR — Long-Term Structure
After the last relief rally toward $0.13, I expect HBAR to enter another major correction.
Based on the current structure, this correction could potentially take price back toward the $0.045 accumulation zone.
That area could become an important foundation for the next phase of the market.
From there, I would expect HBAR to have the potential to finally begin a meaningful bull cycle.
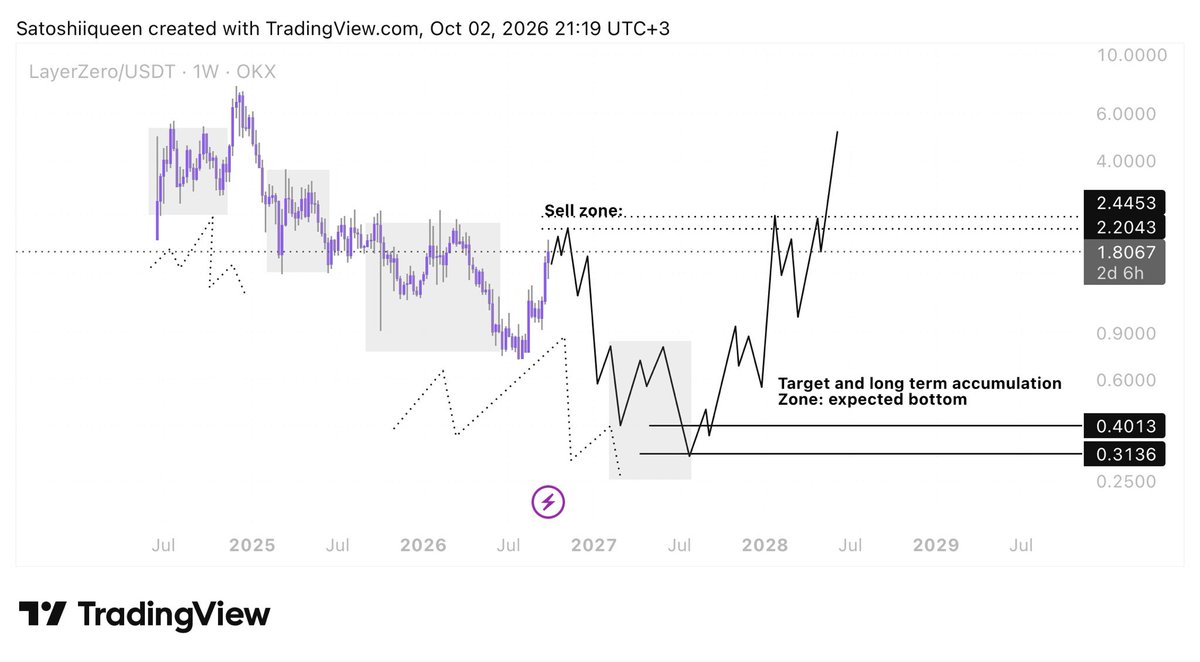
$ZRO — Structure is developing similarly to the previous structure.
If the fractal continues to play out, we could see another move into the $2–$2.45 sell zone, followed by a deeper correction toward the $0.31–$0.40 accumulation zone.
This is the area I’m watching for the expected bottom and potential long-term accumulation.
After that, the structure could transition into a new expansion, with $4+ as a longer-term target.
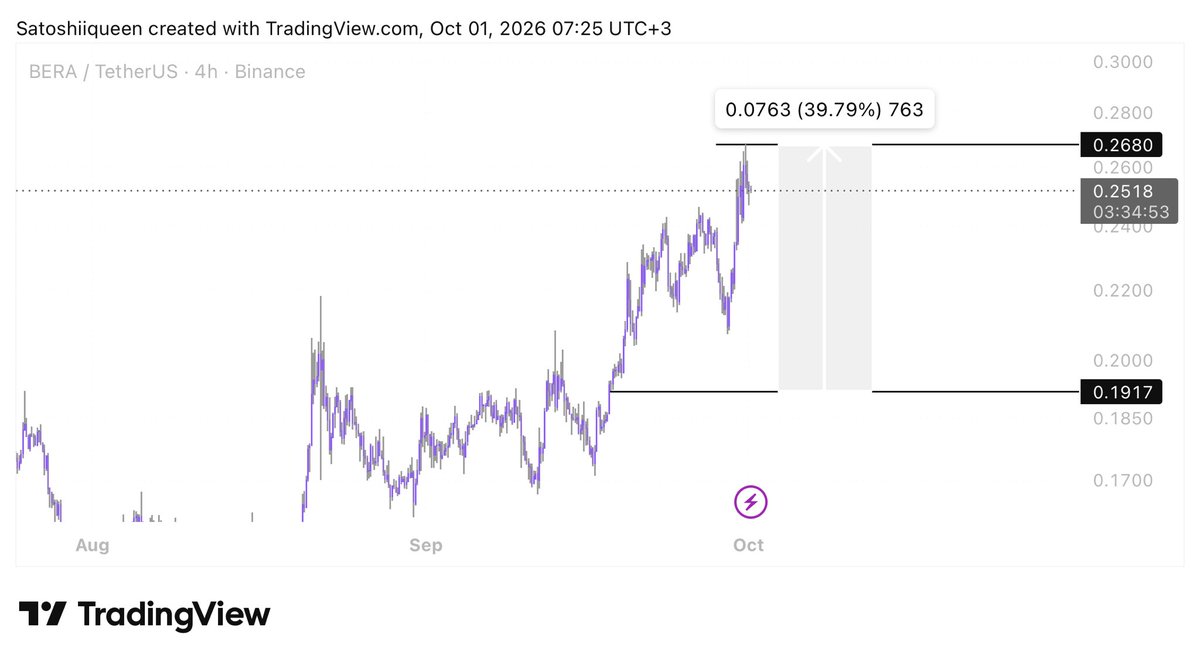
$BERA is showing a structure I’ve seen repeatedly across major altcoin bear markets.
After the initial collapse, price often enters a consolidation/relief phase before the next major bearish continuation.
My expectation for BERA is:
• Short-term relief rally and structural reset
• Potential move toward the $0.2768 area
• Another rejection and deeper bearish continuation
• Final bottoming process potentially developing throughout 2027
• Long-term bottom zone: $0.071–$0.052
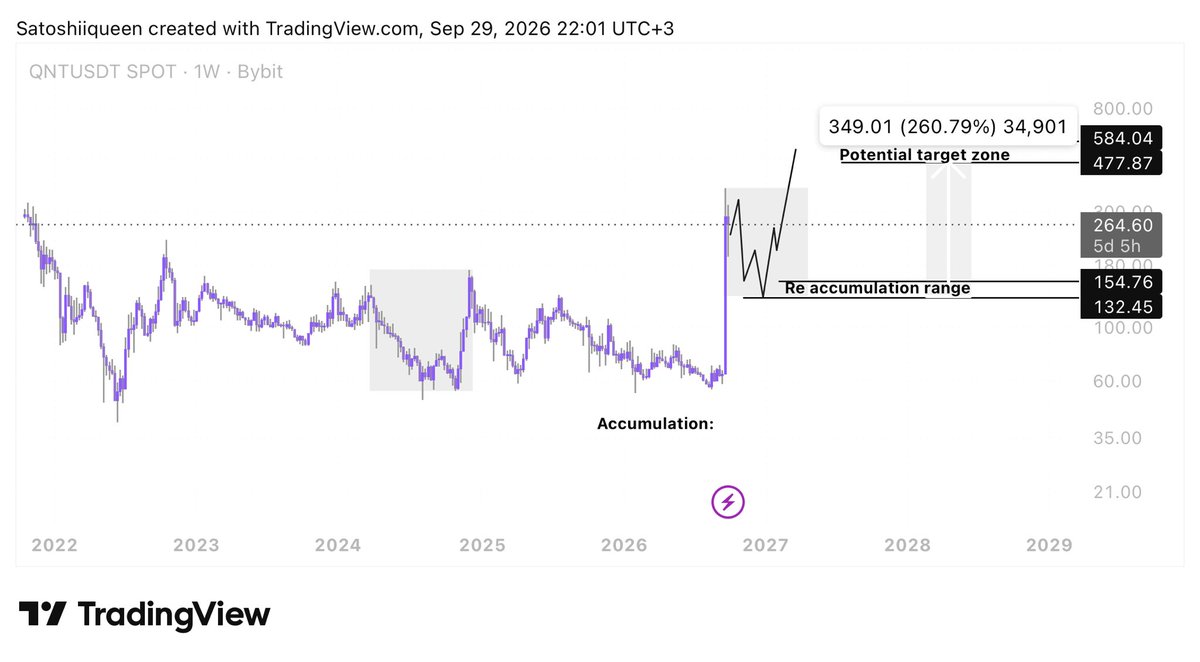
$QNT — after a strong impulsive move, we’re now seeing some weakness around the resistance area, which suggests that a correction may come before the next leg higher.
I’m watching the $132–155 re-accumulation zone as a potential area for this correction to develop. If price holds this range and builds another base, it could act as a re-accumulation phase before the next expansion.
The next potential target zone is around $478–584, with $477 and $584 marking the key levels on the chart.
So the structure I’m watching is:
Impulse → Correction / Re-accumulation ($132–155) → Next Expansion → $478–584 target zone.
This correction could also act as a retest of the long-term accumulation phase after the breakout, before the next major expansion.
$RUNE:
The current recovery may look like the start of a new bullish trend, but looking at previous similar structures, price action suggests that one more leg down may be needed before a new bullish trend can begin.
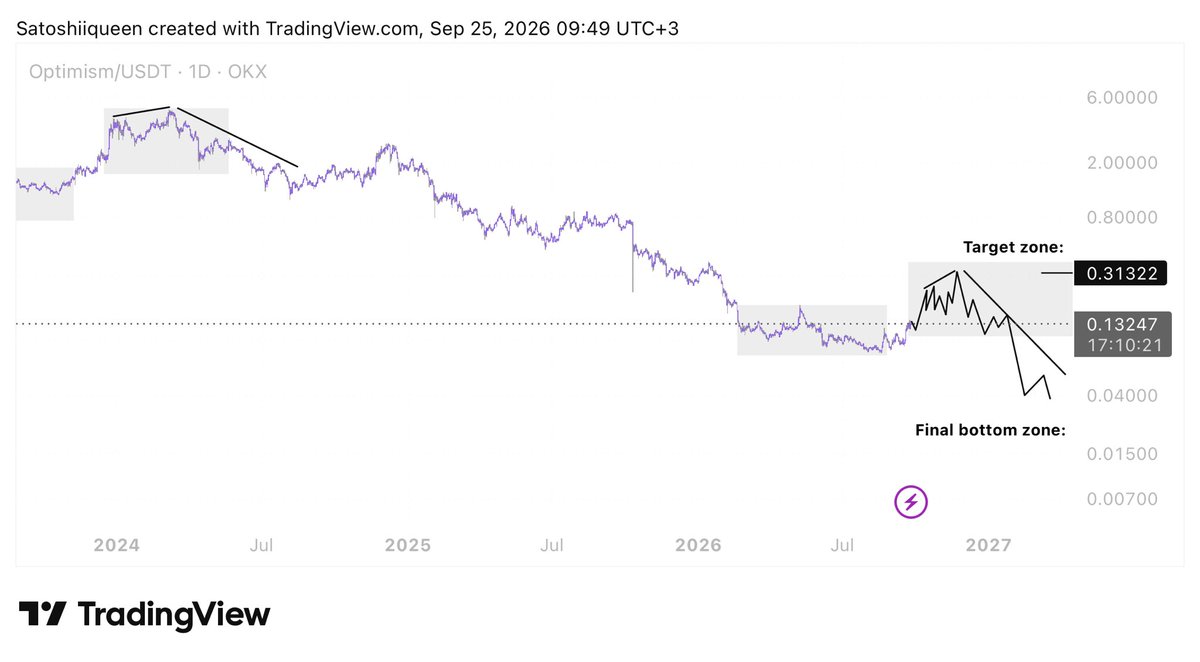
$OP — The current structure is starting to resemble the previous major structure.
If you compare the highlighted areas, the behavior is quite similar: after a prolonged decline and accumulation phase, price eventually breaks higher and forms a strong relief rally, before the larger bearish trend resumes.
We are now seeing the beginning of what could become a similar relief rally from the current lows.
If this structure continues to develop in a similar way, I’m watching around $0.30 zone as the potential target area for this rally.
But reaching that zone would not necessarily mean the larger bearish structure is over. If the previous behavior repeats, the relief rally could eventually be followed by another major decline toward the final bottom zone.
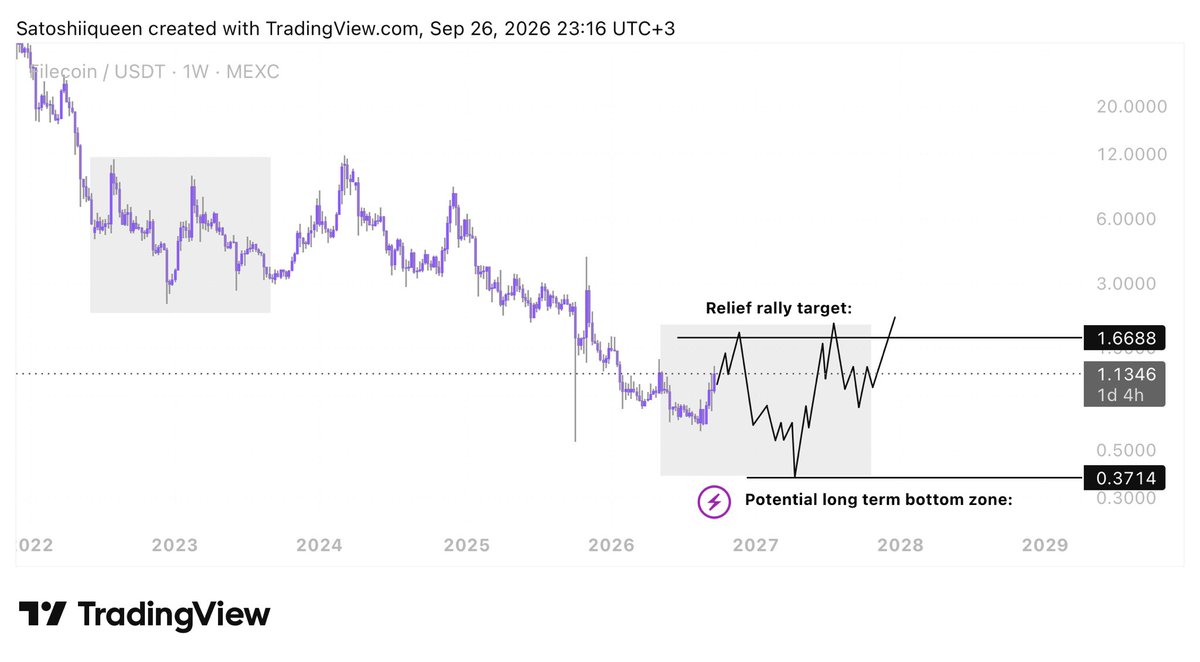
$FIL — the structure is still telling the same story.
If we look at the entire structure since 2022, FIL has been building a prolonged corrective pattern rather than a clean bullish reversal.
The important part is what happened historically: after major declines, FIL repeatedly formed complex relief structures before continuing lower.
Right now, I’m watching for a similar scenario.
The current structure could develop into another relief rally toward ~$1.67, while still remaining part of the larger bearish structure.
That would not automatically mean a new bull trend has started.
Instead, I’m looking for a larger corrective formation to develop over the coming months, potentially followed by another major decline.
The area I’m currently watching as a potential long-term bottom zone is around $0.37.
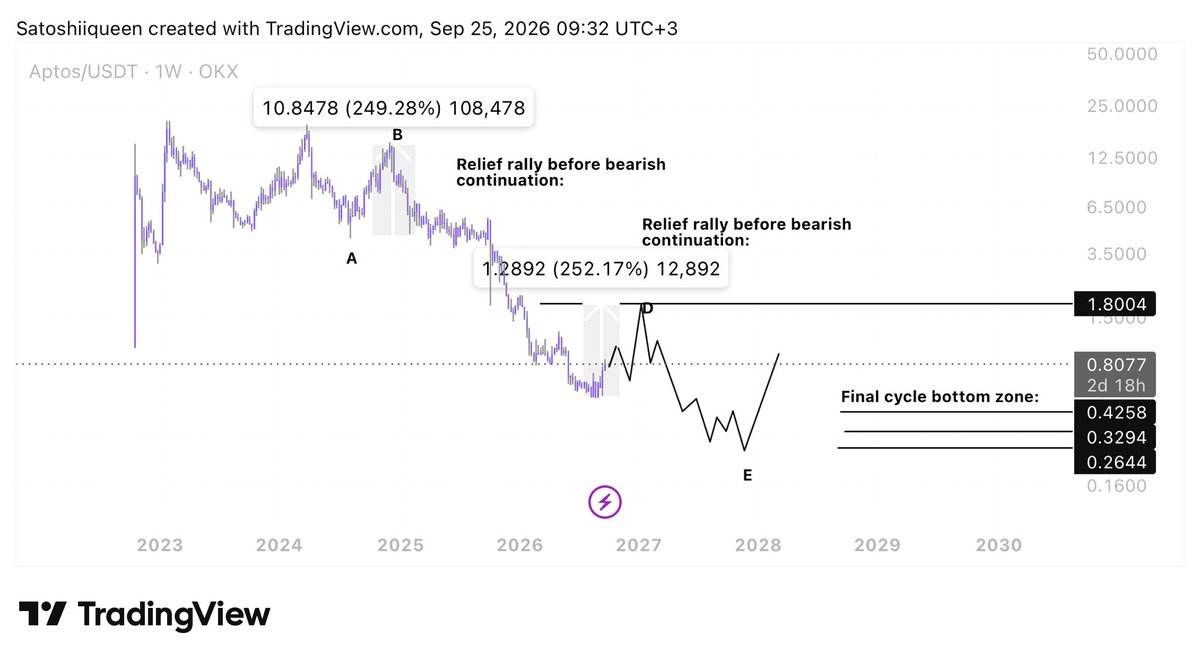
$APT — The current structure is starting to look very similar to the previous one.
If you compare the two sections, the structure is quite clear:
Strong decline → significant relief rally → bearish continuation.
We’ve already seen this sequence play out in the previous structure. Now, after another major decline, APT appears to be starting a new relief rally from the current lows.
If the current structure continues to resemble the previous one, I expect this relief rally could potentially extend toward the $1.50–$1.80 zone before another bearish continuation begins.
From there, the larger decline could eventually lead toward my final cycle-bottom zone.
$WIF
Looking at the WIF chart, we can see that a similar pattern has formed at every major local bottom. This structure has already played out twice, with each occurrence followed by a strong impulsive move to the upside.
Now, price is developing an almost identical structure once again. If history continues to rhyme, it’s reasonable to expect that this third setup could play out in a similar way to the previous two, potentially leading to another strong upward impulse.
Potential target: 0.4744
Accumulation area: 0.1400–0.1500
$JUP UPDATE:
As expected, $JUP has reached the $0.3188 target.
From $0.1638 → $0.3188
That’s a +94.63% move since the setup was shared.
Target hit exactly as projected.
$JUP update:
JUP appears to be developing a structure very similar to the one we saw previously. The current price action is following a comparable sequence of consolidation, relief rally, and subsequent decline.
If this fractal continues to play out, I’m expecting another relief rally toward the $0.30–$0.33 area before the next major bearish leg begins.
The potential long-term bottom zone remains around $0.075.
$COTI
COTI appears to be developing a larger corrective structure that has interesting similarities with its previous cycle.
The key feature I’m watching is the repetition of two major structures.
Structure 1:
After the initial decline, COTI entered a prolonged consolidation, followed by a relief rally before eventually continuing lower.
Structure 2:
We may now be seeing a similar sequence. The initial decline has already been followed by a consolidation and a significant relief rally.
However, I’m not calling the relief rally finished yet. It is or finished or It could still develop further before the market makes its next major move.
If Structure 2 continues to resemble Structure 1, the potential path could be:
Relief rally → further volatility/rejection → another leg lower → potential long-term bottom → larger recovery.
The long-term bottom zone I’m watching is around $0.0050–$0.0057.
@juraj_krajcik1 Thank you!
A short was worth opening from 0.05. If you missed that entry, it’s better not to risk it now — the price has already dropped 35% from there.
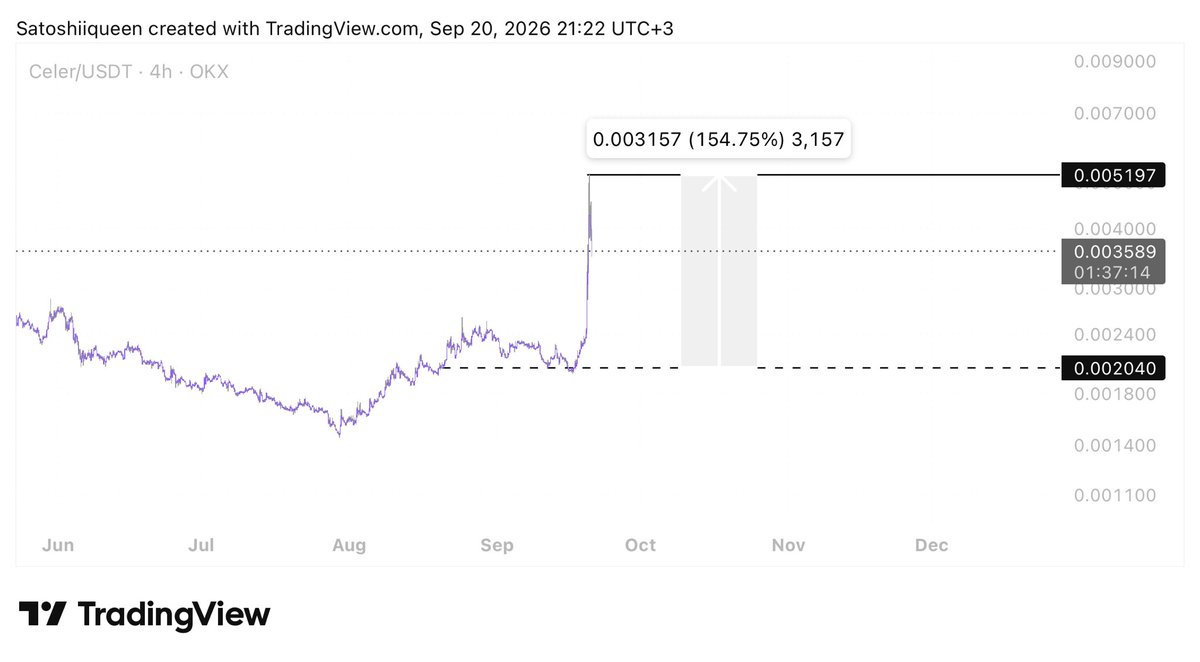
$CELR UPDATE
$CELR has reached the $0.005197 as expected.
From $0.002040 → $0.005197
That’s a +154.75% move since the setup was shared.
Target hit exactly as projected.
$CELR update
The current structure looks remarkably similar to the corrective structure we saw throughout 2024–2025.
We’re seeing a similar sequence: correction → relief rally → bearish continuation, followed by another corrective consolidation.
If this fractal continues to play out, I expect a relief rally toward $0.0043–$0.0050, followed by another bearish continuation.
$EIGEN
Similar to the previous structure, price is literally developing the same pattern in almost the same way.
The same sequence is playing out again: consolidation → compression → relief rally → rejection → another bearish leg.
That’s why I’m watching the $0.45–0.46 area as the potential relief-rally target. If the structure continues to repeat, the next major move could come to the downside, with $0.073–0.046 remaining my potential long-term accumulation zone.
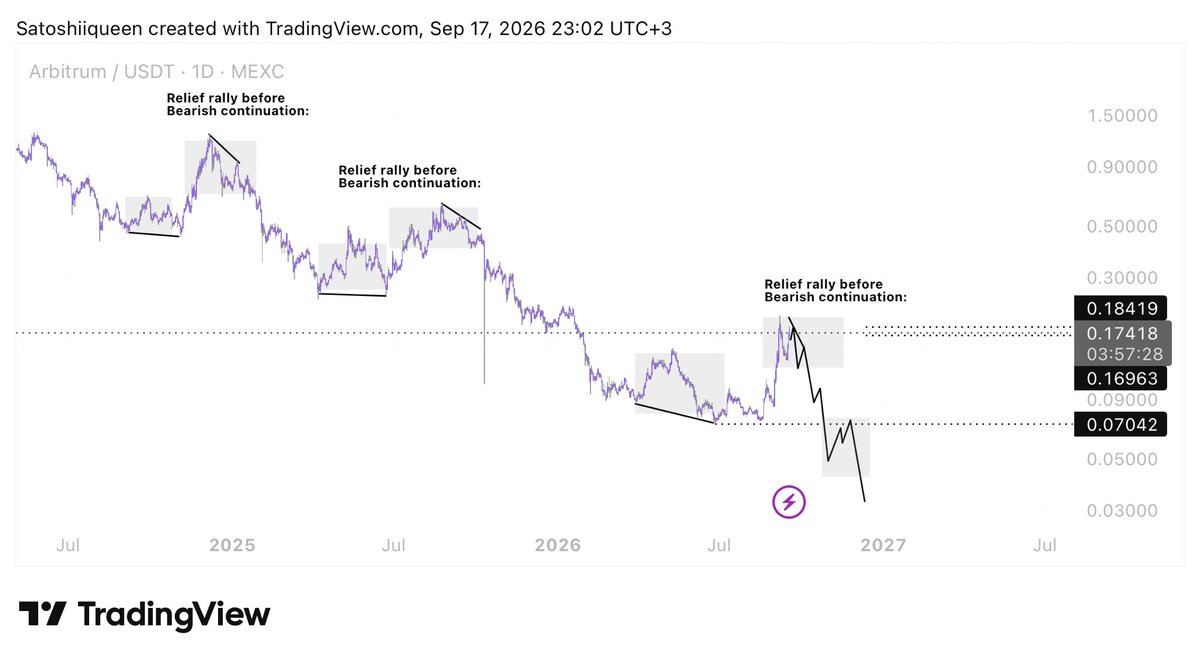
$ARB Update:
The relief rally has completed as expected.
If we compare the current structure with previous similar formations, we can see a repeating pattern: after the relief rally peaks and gets rejected, price often attempts to rise again, creating the illusion that the bullish move will continue.
However, each time, this recovery attempt failed, and price eventually entered another major bearish continuation.
The current structure is developing similarly. If the pattern repeats, this relief rally could be followed by another deeper bearish move.
$ARB — Higher-Timeframe Outlook
ARB has repeatedly shown the same behavior throughout its bearish trend: a relief rally followed by another continuation to the downside.
We have already seen several examples where these relief rallies produced significant upside moves before the bearish trend resumed.
The current setup appears to be developing a similar pattern.
The key area to watch is the $0.169–$0.184 range, where another relief rally could potentially find its top before the next bearish continuation.
Pay attention: the target may not be reached immediately. Price is likely to reach this area through volatility and multiple moves — not in a single candle or straight-line move.
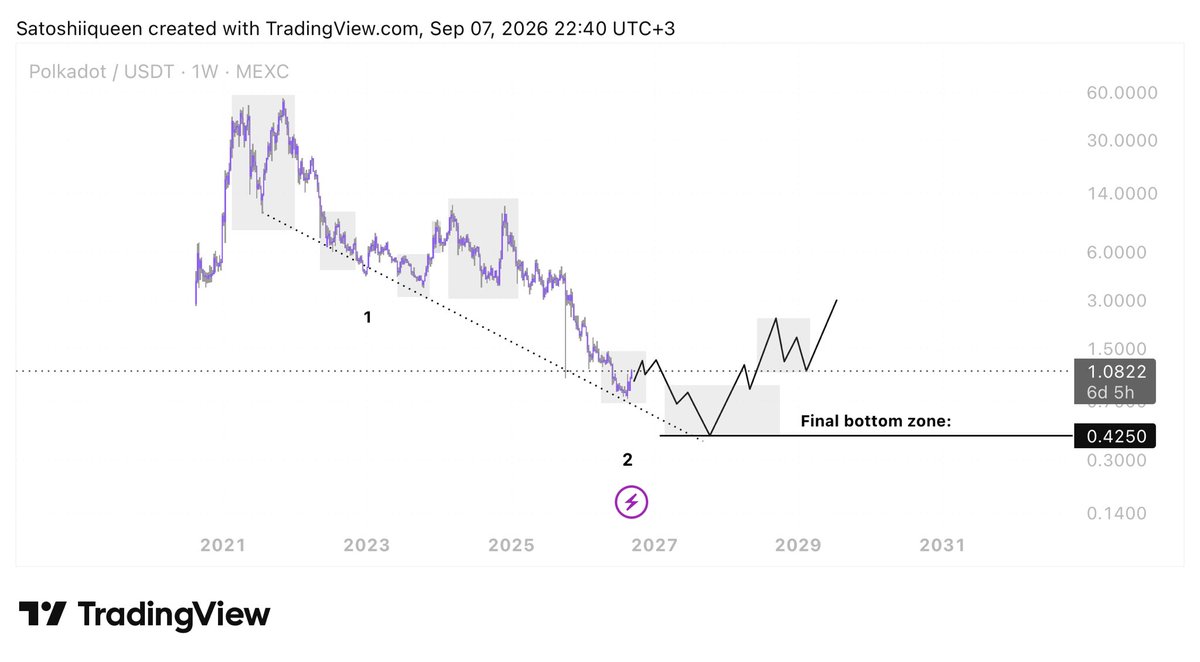
$DOT — Long-Term Structure
DOT is showing a structure that strongly resembles its previous major bottoming phases.
The key point is that the bottoming process has historically been much more complex than a simple V-shaped reversal. After the initial major decline, price tends to spend an extended period building a base, creating multiple relief rallies and liquidity traps before the final expansion begins.
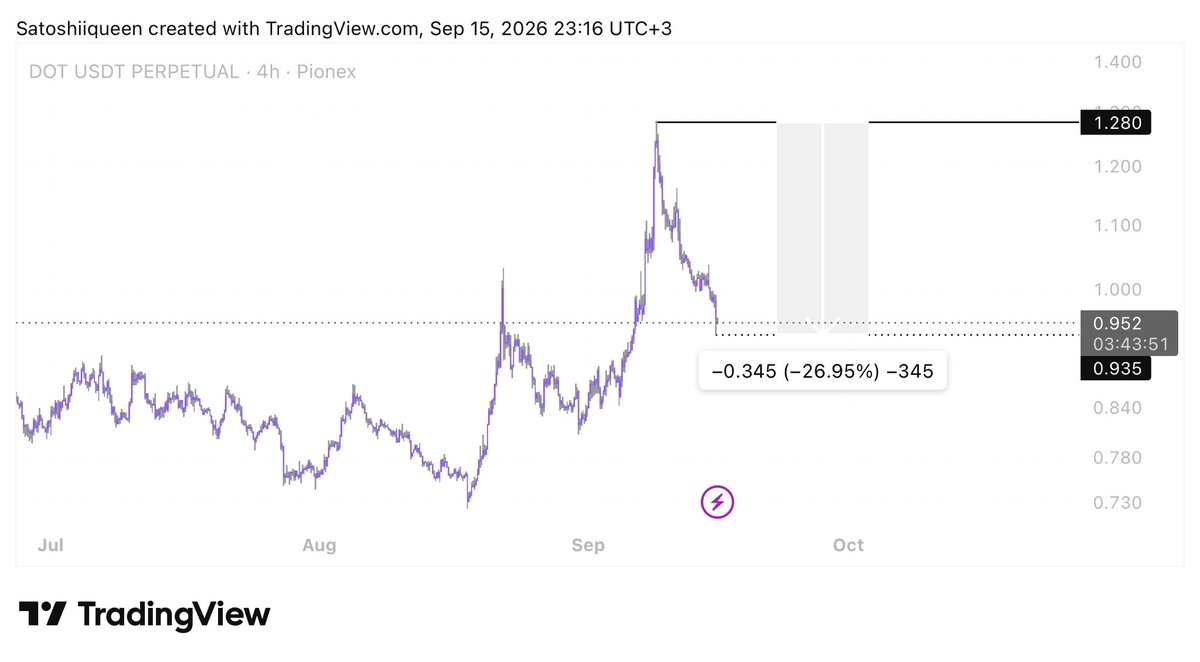
The current rally appears to be another relief rally until 1.2-1.4$ resistance zone rather than a confirmed trend reversal.
If the historical structure continues to repeat, I expect this rally to be followed by another bearish continuation, potentially pushing $DOT into the $0.38–$0.42 final bottom zone.
Only after this final corrective move is completed would I expect the larger bullish reversal to begin