La juventud en España ya no puede emanciparse sin empobrecerse.
El problema es muy grave cuando, incluso trabajando, la vivienda está absorbiendo toda posibilidad de construir una vida autónoma.
Estos son los datos del Observatorio de Emancipación 2025 🧵
🆕Panorama de la educación 2025. Indicadores de la #OCDE
📊Estadísticas de los sistemas educativos más desarrollados del mundo:
👉La evolución de los sistemas educativos📈
👉El impacto social🌍
Accede a toda la información del informe de #OECDEAG ➡https://t.co/IhtQvPqPMP
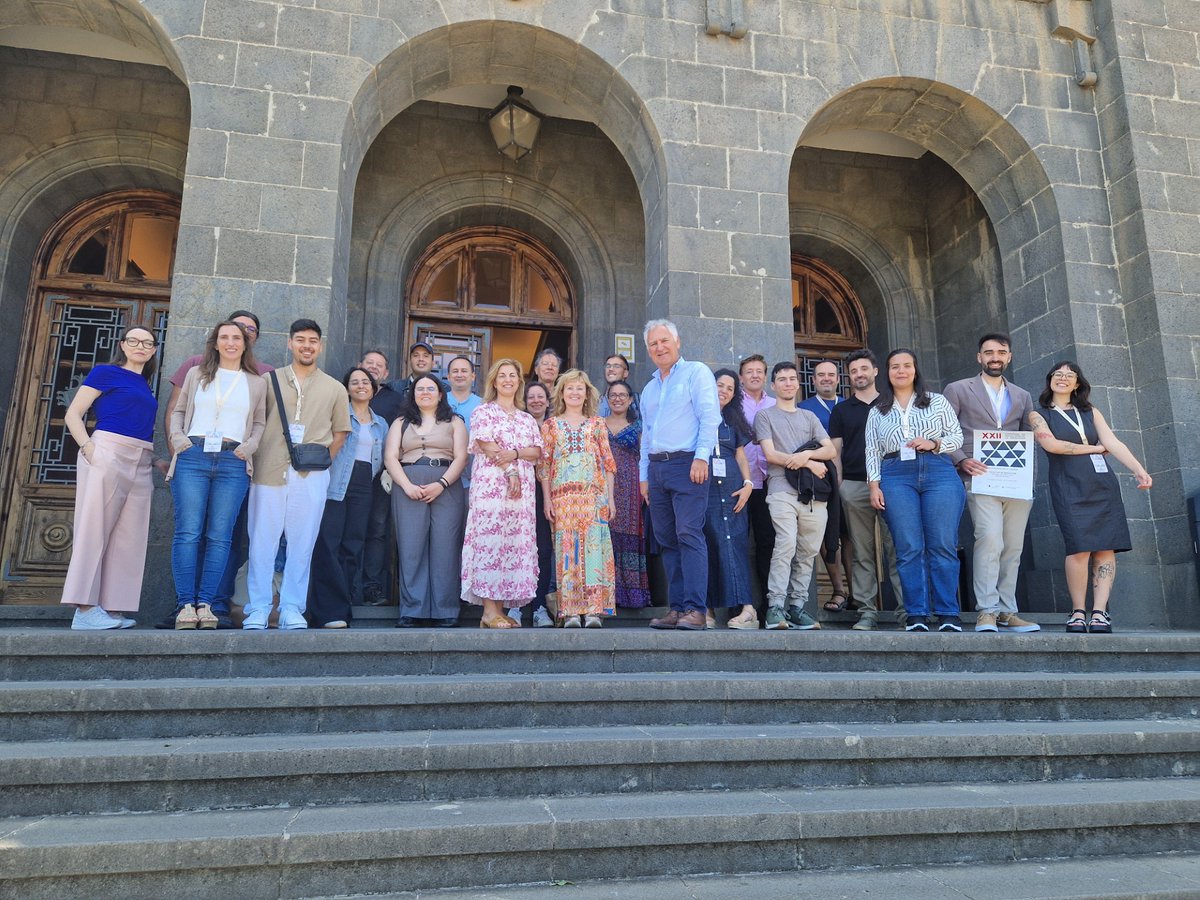
Celebrado en @ULL el "XXII Congreso de Sociología de la Educación". Muchas gracias al equipo de La Laguna por la organización y a todos y todas los participantes en el congreso. #SociologíaEducación@FES_Sociologia
https://t.co/LTr21mTT4O
⌛ ¡La espera terminó!
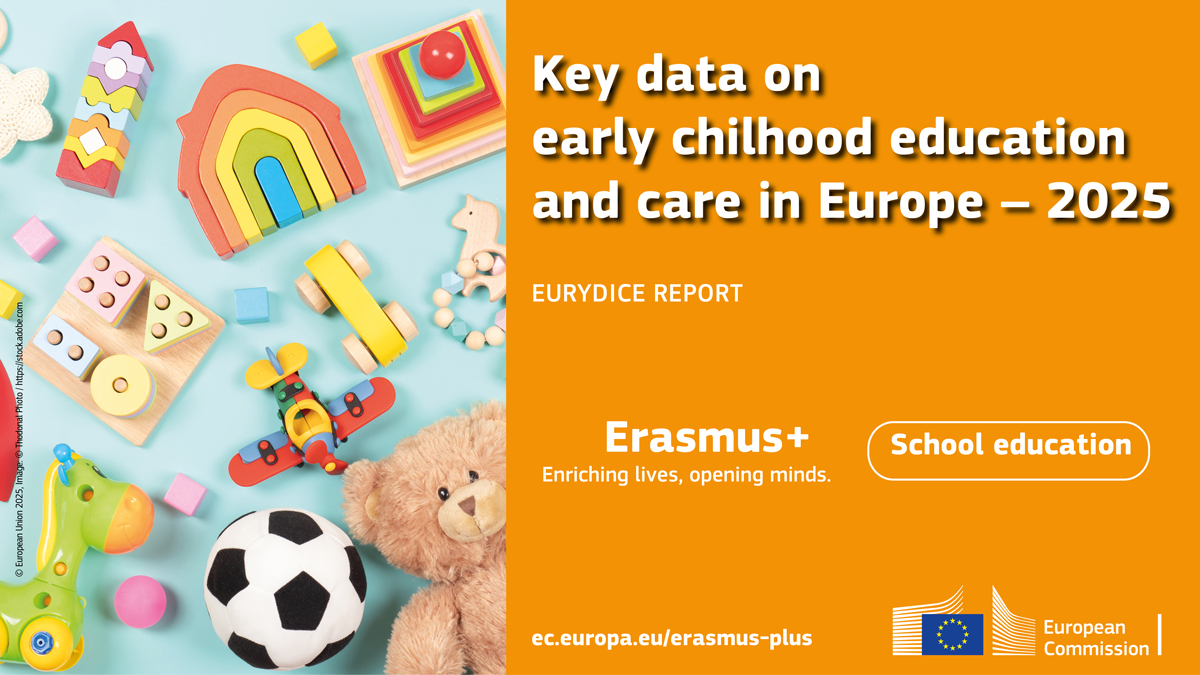
🚨 Hoy se publica el informe #EurydiceEU “Cifras clave de la educación y atención a la primera infancia en Europa. Edición 2025”, proporcionando datos y tendencias clave que marcaran la pauta en los próximos años 📈
👉 https://t.co/S22HUV9hL1
"Economía de la Educación", un auténtico “handbook”, elaborado con la colaboración de 22 investigadores y publicado por la Fundación Ramón Areces. El manual, de acceso gratuito, ofrece una visión exhaustiva y muy actualizada sobre estado del conocimiento en este campo de la investigación. La reseña de Augusto Ibañez @Fundacion_SM https://t.co/W8pvodmWNt
OECD data finds that students from low-educated and low-income parents are less likely to be employed in adulthood than their more advantaged peers, even with equal education and academic performance.
The OECD researches how career guidance can help 👉 https://t.co/UXus8YdY8R
Lope de Vega saca a relucir su pluma, mas no su criterio.
Critica un elemento (El rechazo al turista irrespetuoso), pero ignora la reivindicación original (el modelo turístico y la pobreza que genera para la población local).
Desviar el debate no elimina el problema.
Estimada gente de Canarias:
Los escombros en los barrancos no los tiran los turistas.
El "cuartito de aperos" de 200 m2 y con piscina en terreno rústico no lo construyen los turistas.
Las toneladas de mierda que aparecen en el Teide tras una nevada no las dejan los turistas.
1/ Esta investigación comenzó hace muchos años, cuando hice mi primer análisis de portadas ¿pueden medirse las noticias? ¿Se puede cuantificar la cantidad de información que dedican? ¿Se puede VER sesgo de cada medio sobre el 15M en un gráfico?
Abro #HiloTesis@UOCUniversidad
Fuga de cerebros en la España vaciada: cómo Madrid absorbe el talento joven del resto de comunidades
Un estupendo tema de @ainhoa10ruiz
https://t.co/XHFa53mXCW
Common Probability Distributions That Occur In Nature And Why Mathematics Is The Language Of The Universe
Fundamentally the patterns of the universe repeat themselves making machine learning and AI possible.
Basically, when training ML models, including NNs we are attempting to model the patterns in the data. A good model can predict unseen data points that are part of the original data distribution.
Here are the common probability distributions and where they occur naturally
Symmetry and normal distributions - Nature loves balance. You see it in butterfly wings, faces, and even in physical laws. Natural phenomena that exhibit symmetry often fit well with a normal distribution.
The Central Limit Theorem tells us that the sum of many independent, identically distributed variables approaches a normal distribution. These distributions are characterized by a mean and a standard deviation and everything from human heights, IQ scores, and even the velocities of molecules in a gas follow a normal distribution
Log-normal distribution - If the logarithm of the variable follows a normal distribution, then the variable itself has a log-normal distribution. The distribution of financial assets, or the sizes of particles generated by grinding, blood pressure, and metabolic rates in various organisms often follow a log-normal distribution.
The Log-Normal Distribution often arises from multiplicative growth processes, where you're repeatedly multiplying by some random factor.
Uniform Distribution. This is self-explanatory. All outcomes are equally likely. In the continuous case, the probability density function is flat between the minimum and maximum values. Rolling a fair die, or picking a card from a well-shuffled deck follows uniform distributions
Poisson Distribution It describes the probability of a given number of events occurring in a fixed interval of time or space. The events must occur with a known constant mean rate and independently of each other. It is the go-to for predicting rare events.
Poisson distribution models the number of times a radioactive atom decays in a given time period, or the number of cars passing through a certain point in a given time frame.
If a particular intersection sees an average of 10 cars passing through it per minute, the Poisson Distribution can estimate the probability of 15 cars passing through in the next minute. Similarly in sports like hockey or soccer where goals are rare, you can use distribution to model the number of goals scored by each team.
Bernoulli Distribution, the binary star of the probability universe! Scientifically speaking, it's a discrete probability distribution that models a single experiment with exactly two outcomes, often termed "success" and "failure," and is characterized by a single parameter p, the probability of success.
The flip of a coin, genetic inheritance (you either have a trait or you don't), and the polarization of a single photon (either vertical or horizontal) model this distribution.
Binomial Distribution It describes the number of successes in a fixed number of independent Bernoulli trials, each with the same probability of success.
For example, The number of heads when flipping a coin multiple times, or the number of defective items in a batch of manufactured goods can be modeled with this distribution.
Exponential Distribution models the time you have to wait for the next event in scenarios where events happen independently and at a constant average rate. It's often used to describe phenomena like the time between bus arrivals or the intervals between radioactive decay events.
In essence, it's the go-to distribution for understanding "waiting times" in various natural and man-made systems.
This is a summary of the most common distributions. There are a bunch of other distributions that are related or variations on the above distributions and the image below captures some of them.
These naturally occurring distributions speak to why mathematics is the language of the universe and how you can use it to model and predict its behavior