Forever amazed at the quantity and quality of satellite data that's available, free of charge.
Below is a series of animations I made showing key climate and atmospheric variables observed from various satellites
@tropomi@ESA_EO@NASAEarth@NASA@NCEOscience@SpaceParkLeic
Check this out if you're a Chinese citizen and want to come and do a PhD with us :-) We specialise in space research, both looking out at the universe and looking back towards out own planet to better understand climate change. If you're interested in climate, get in touch :-)
When you hear about #wildfires in the #Amazon its sometimes hard to truly appreciate the scale. This animation shows smoke from these record-breaking fires consuming most of the region, a disaster for both health and the environment🛰️🔥
Made with @sentinel_hub & @NOAASatellites
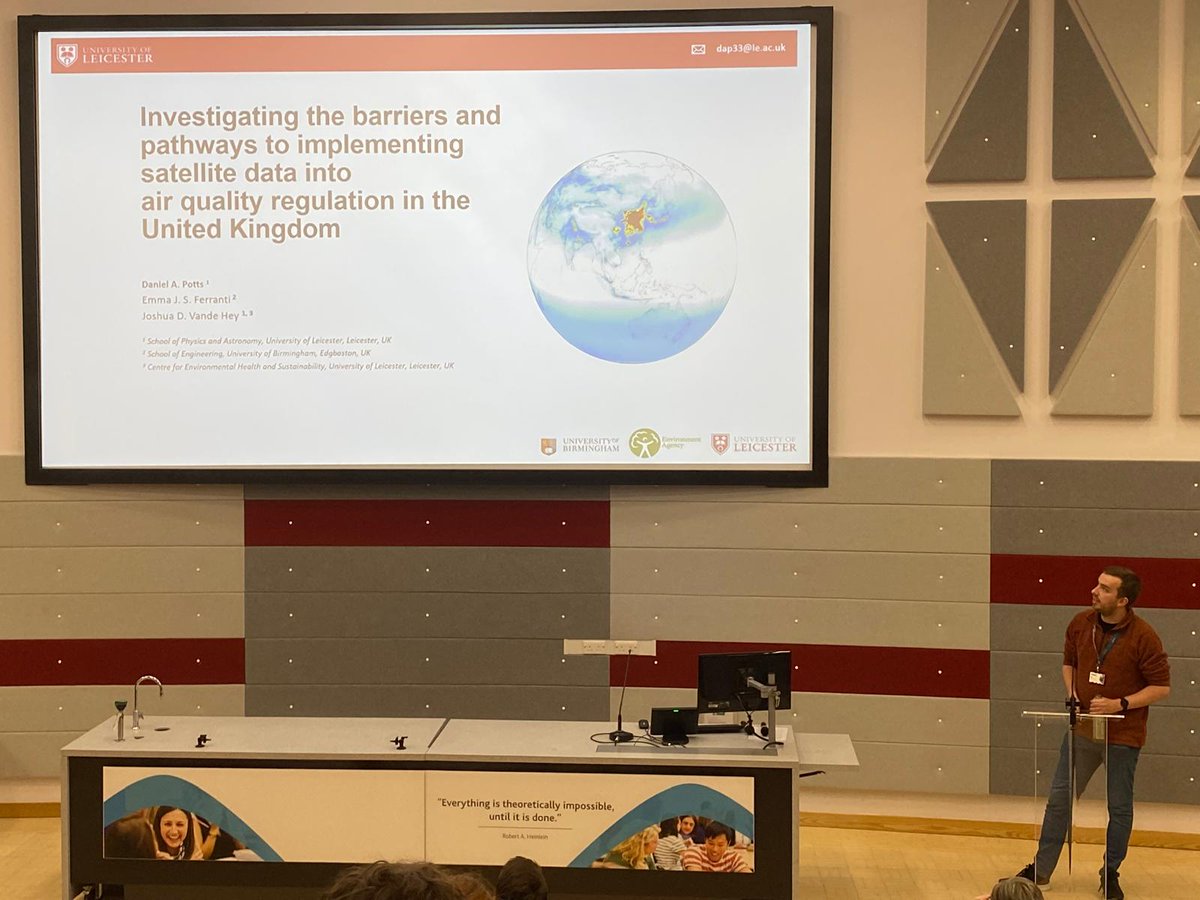
Having a great time at the #UKEO2024 conference in York. I had the opportunity to present work from my PhD, where we looked into the barriers and pathways to implementing satellite data into air quality regulation.
Link to study:
https://t.co/bIcacThJMs
Yesterday I passed my PhD Viva with minor corrections! 3.5 years of work and 3.5 hours of viva later 🥂
Massive thanks to my supervisors @JoshVandeHey, Emma Ferranti, Roger Timmis and @DrHarjSembhi for all the support, and I'm excited to continue working together!
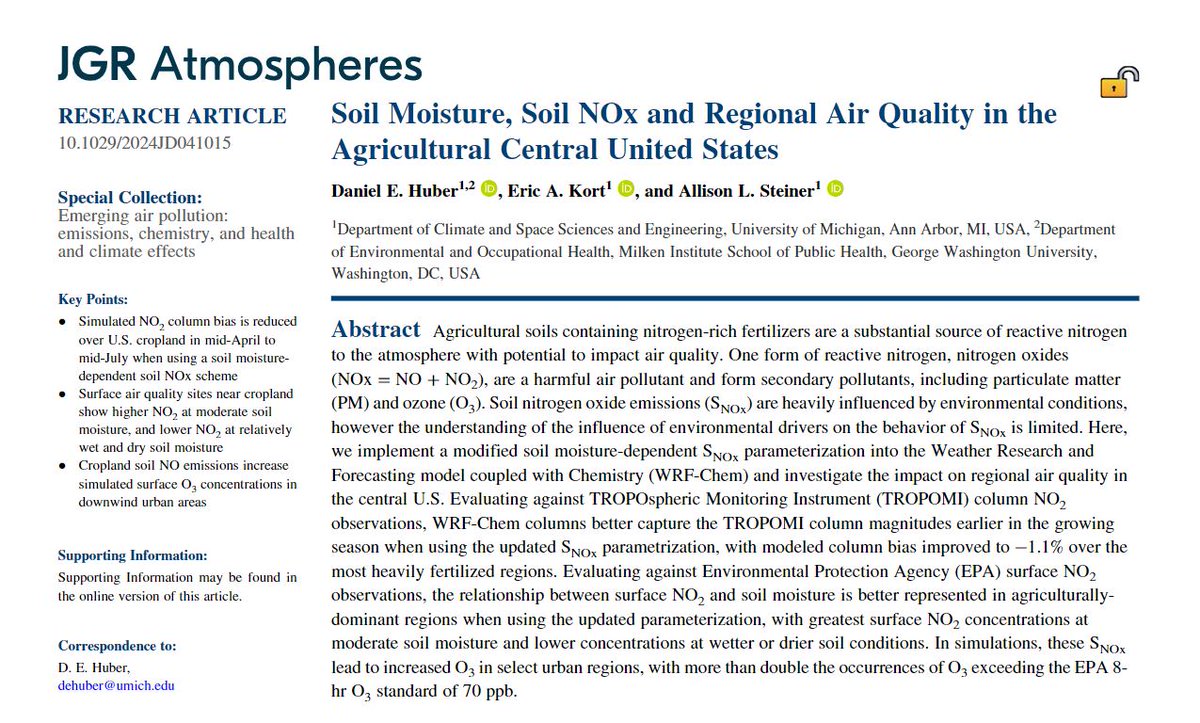
The final chapter of my Ph.D. is published! We show how the soil moisture vs. soil NOx relationship can help explain NO2 variability over Central U.S. cropland, with implications for rural to urban AQ.
Check out our publication at JGR: Atmospheres 👉 https://t.co/Uz87V9oJSu
@shye547 @tropomi@ESA_EO@NASAEarth@NASA@NCEOscience@SpaceParkLeic Thanks! Made with python and the cartopy package, with the underlying data coming from Google Earth Engine with Xee or downloaded from the original source in the case of SIF and methane
Forever amazed at the quantity and quality of satellite data that's available, free of charge.
Below is a series of animations I made showing key climate and atmospheric variables observed from various satellites
@tropomi@ESA_EO@NASAEarth@NASA@NCEOscience@SpaceParkLeic
Blink and you'll miss it!
On 18 May, a meteor burned up in the night sky over Spain and Portugal – it was also caught by the Lightning Imager on the Meteosat Third Generation Imager satellite far away in geostationary orbit.
Credits: @esa / @eumetsat
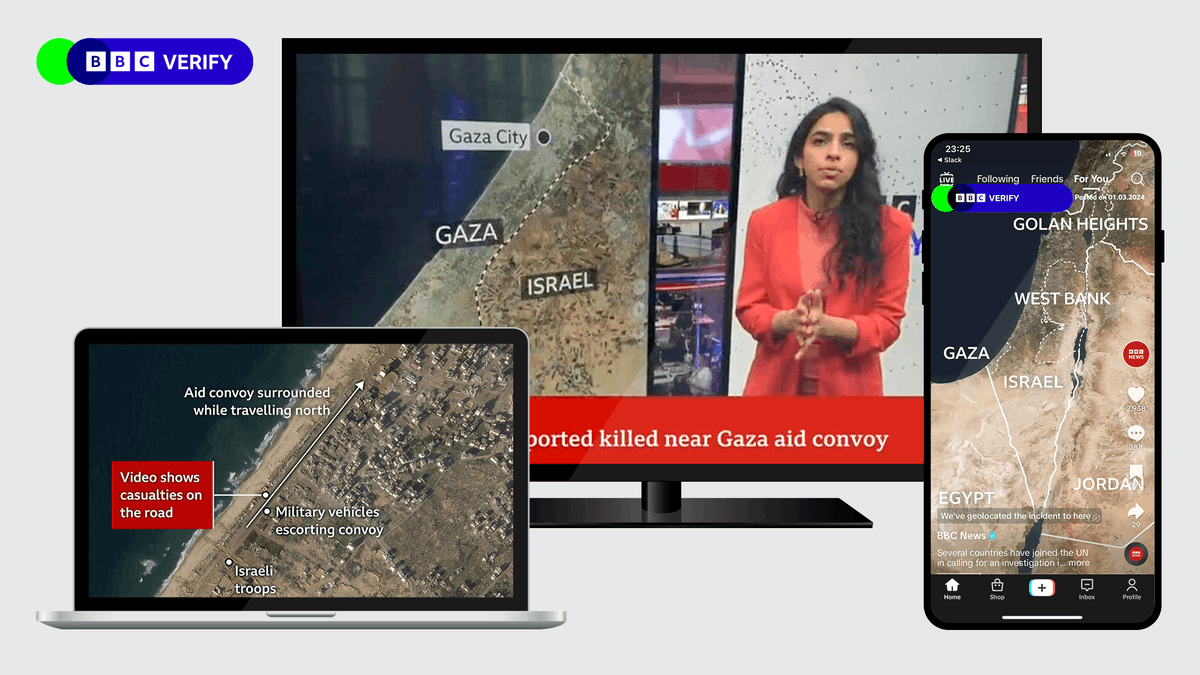
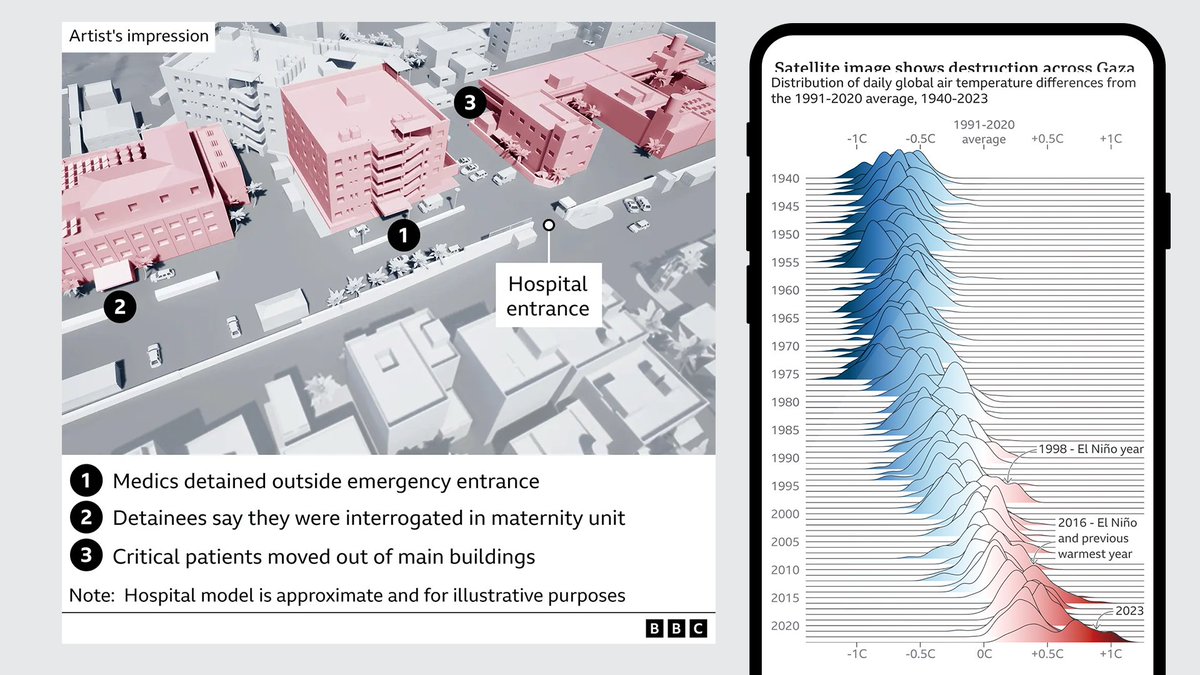
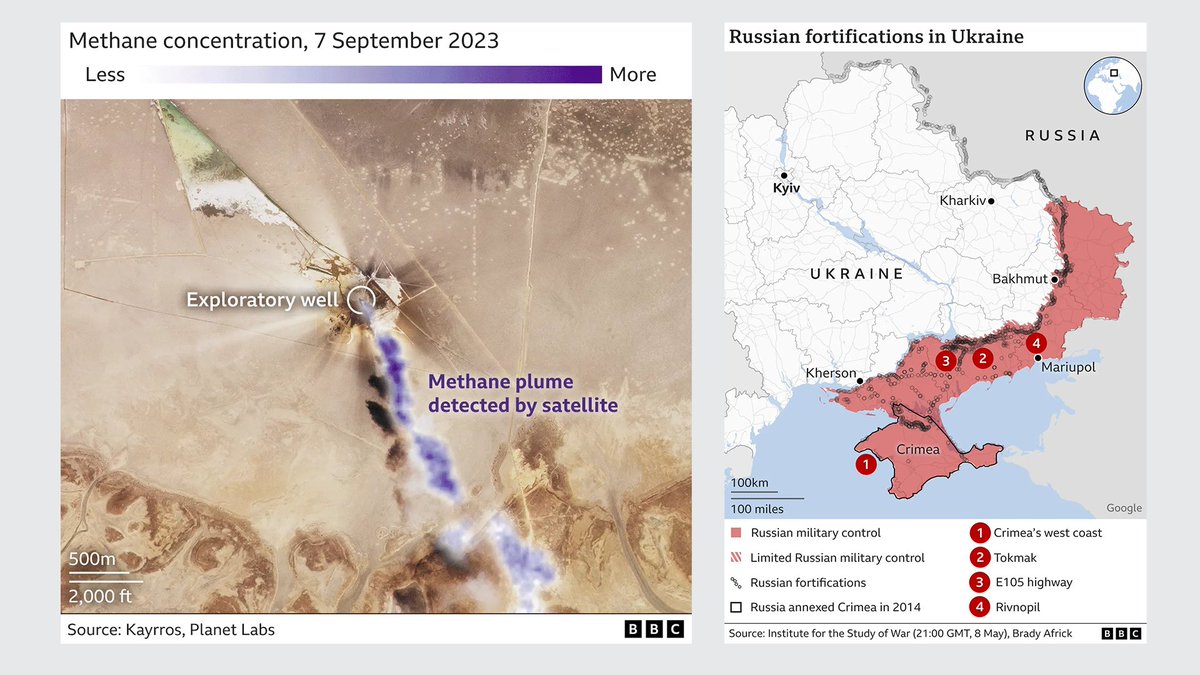
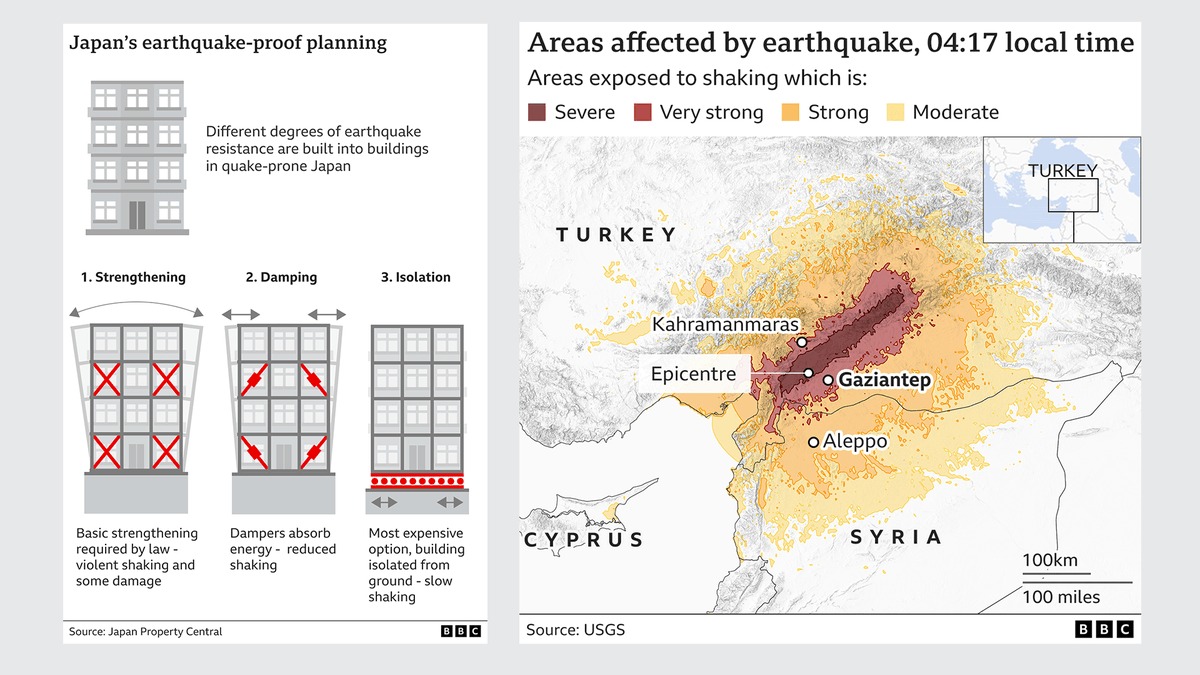
BBC News are #hiring! looking for a Senior #infographic designer/reporter to join the new Verify team, playing a central role in #OSINT investigations - visualising verification, satellite imagery, creating diagrams, #maps and #dataviz. Flexible hybrid working - apply by 26 March:
https://t.co/1YMzUgC9uE
The "Door to hell", a gas-filled pit that's been burning for 50 years, as seen by #Sentinel2 using a SWIR overlay to identify active burning 🔥🛰️
Processed with @sentinel_hub using a modified version of @Pierre_Markuse script, data from @CopernicusEU@ESA_EO
In 1971, engineers from the Soviet Union ignited a fire in a gas-filled hole in the Turkmenistan desert.
Anticipating that the flames would extinguish within days, they were surprised when the fire continued to burn.
Now, 52 years later, this site, known as “The Door to Hell,” is still ablaze.
Every winter, the Po Valley in Northern Italy experiences poor #AirQuality as temperature inversions trap pollutants against the mountains, such as Nitrogen Dioxide shown here.
@tropomi@CopernicusEU@ESA_EO
Want to help me develop a digital twin of tropical wetlands? Expertise in machine-learning, Earth observation or hydrological modelling? Post-doc advert now live here. https://t.co/20nS2dipeV Please RT :-)
It’s been 24 hours since the new EPA PM2.5 (air quality / particulate matter) standard, so that’s enough time to pass for a few hot takes. The new standard is a net positive for sure, but several important nuances to be aware of… Mega-thread! 🧵 1/