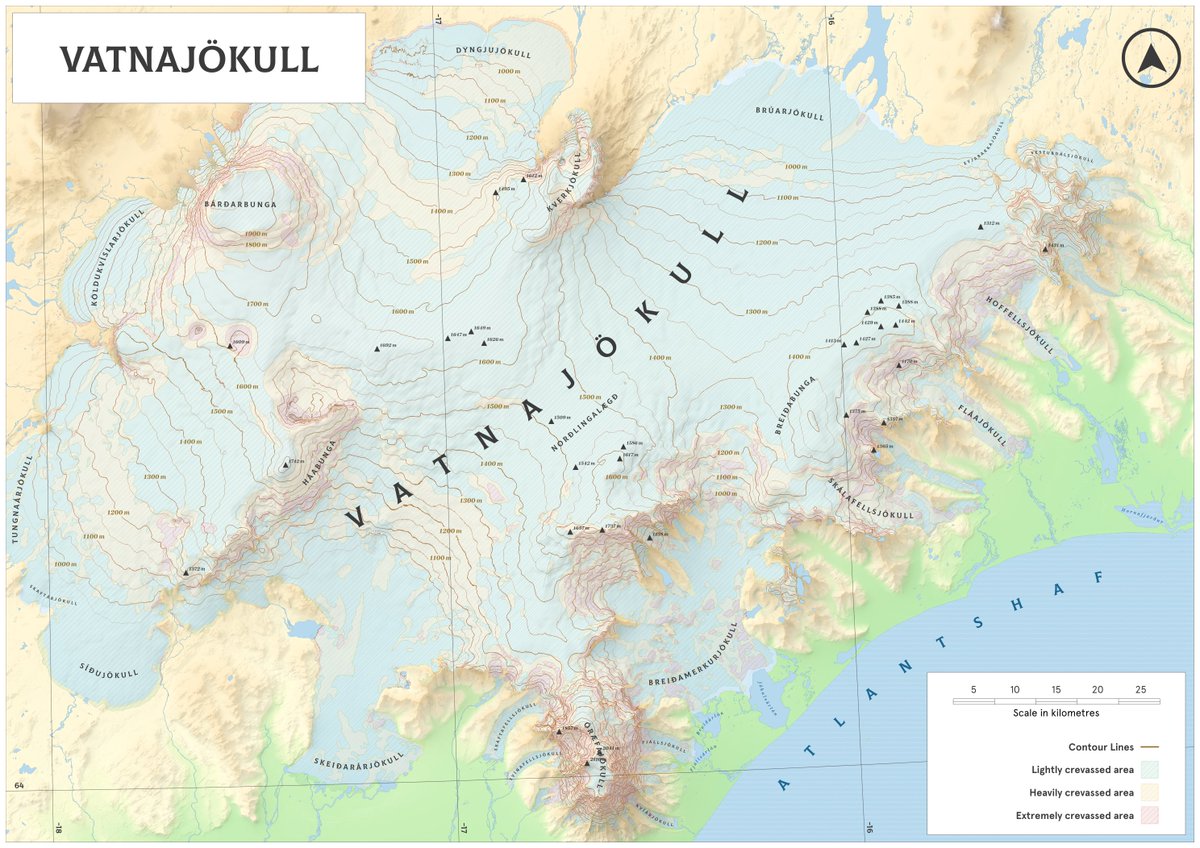
El glaciar Vatnajökull cubre aproximadamente el 8% de Islandia, creando un sobrecogedor paisaje de hielo que entierra volcanes activos bajo su superficie. El mapa muestra la elevación del glaciar y la concentración de grietas por zonas.
Stuck on your next GIS project? I have been working for the last few weeks on a little side project: a creative GIS generator based on React that will help you break through any creative block and explore new ideas.
This is GIS Brief Generator! 📄
November means #30DayMapChallenge.
Stuck on a theme or just want new ideas?
This small tool I built generates map briefs to help you overcome the feared creativity drought and get started:
https://t.co/A40hm156zb
Happy mapping! 🗺️
@zecer_bdg To jest mapa liczby ludności, a nie mapa gęstości zaludnienia, więc wielkość osiedli nie ma znaczenia. Rzek też nie zaznaczałem, bo mapa ma po prostu odpowiadać na jedno pytanie: ile osób mieszka w danym miejscu? Wszystko inne to dodatki, które tylko wprowadzają szum 😌
Hi, @BydgoszczPL!
Sprawdziłem wasz „RAPORT O STANIE MIASTA BYDGOSZCZY ZA 2023 ROK” i znalazłem interesującą, chociaż strasznie brzydką mapę o liczbie ludności na osiedlach w 2023 r.
Postanowiłem ją poprawić dla was i opowiedzieć, co i dlaczego.
https://t.co/p2Ihe323VR
⬇️
On the following link you have the full code available in Github:
https://t.co/mCh8dGSNqD
I hope it helps all GIS professionals going through a creative drought to find interesting ideas for their next projects.
Do not hesitate sharing your feedback and outcome!
Stuck on your next GIS project? I have been working for the last few weeks on a little side project: a creative GIS generator based on React that will help you break through any creative block and explore new ideas.
This is GIS Brief Generator! 📄
Select your map type (you can choose between Topographic, Political, Choropleths, Dots, Physical or Transit), your map scope and click Generate.
That's it. That easy.
The tool will give you a brief and its deadline.