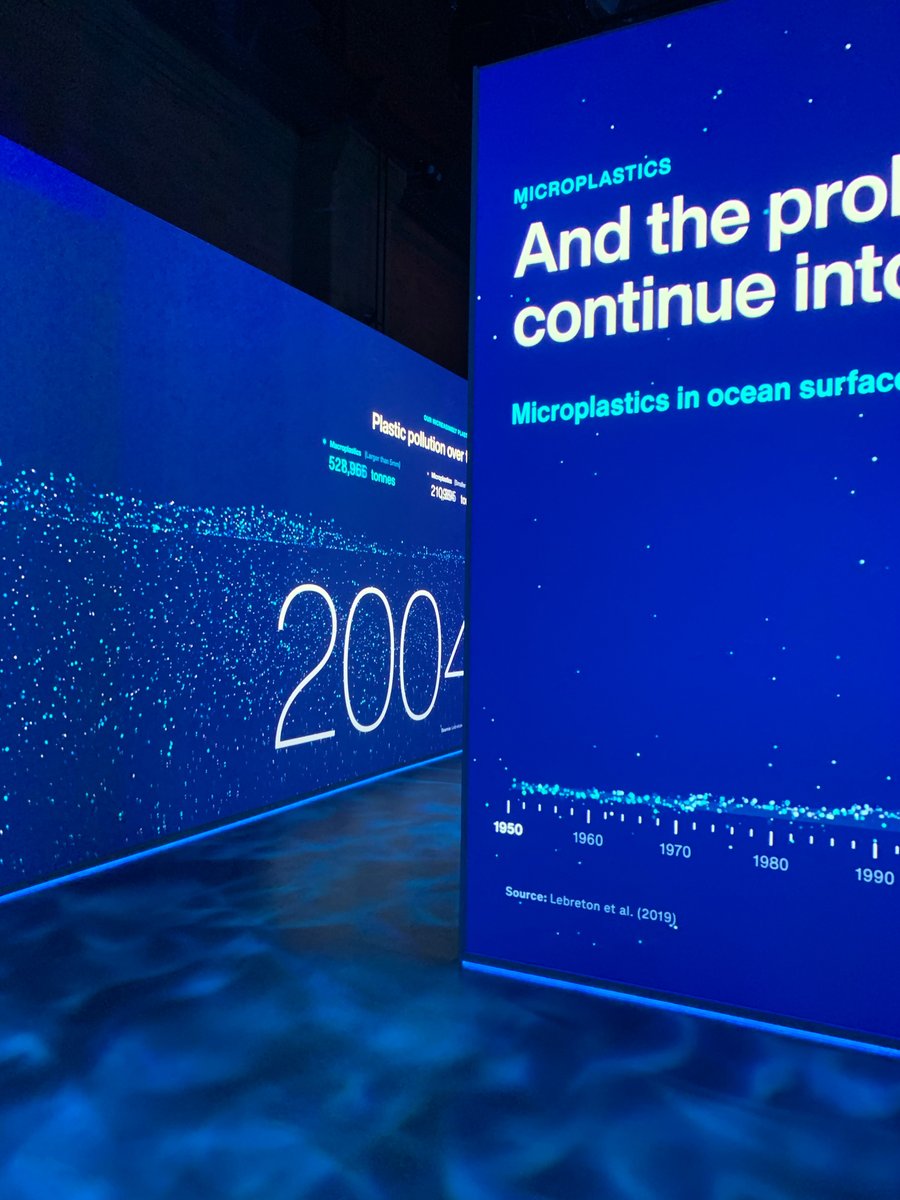
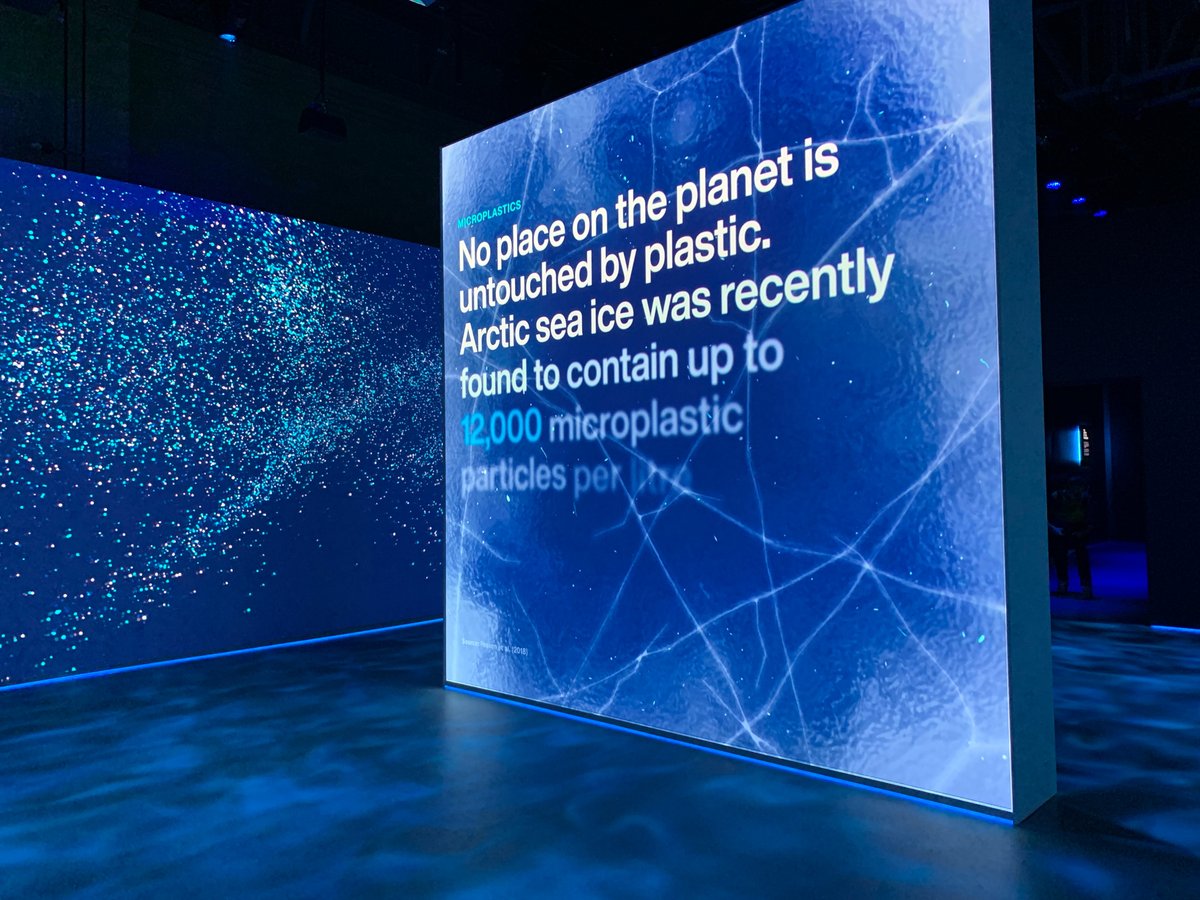
New work: Generative interactive particle display for @theblueparadox exhibition, on show in London for the next week. Each particle represents 100g of plastic entering the ocean right now.
New work: Images of our full room installation for @theblueparadox exhibition. Displaying the true impact of ocean plastic pollution through immersive visualisation and animation. #dataviz#dataart#exhibition
New Work: Framework is a self-initiated project exploring new ways to exhibit and experience physical art in the digital space. Check it out on on the big screen (too hot🔥 for mobile) and see if you spot any familiar faces. https://t.co/wS8hkZkOTD
We designed this double page spread for @sciencefocus to visualise the @IUCNRedList - the world's most in-depth inventory of vulnerable and endangered species.
https://t.co/bgC15rJtav
We created this illustrated microsite for IT security firm CyberArk that highlights the vulnerabilities of critical business applications. We used animated cluster diagrams to show the difference between perceptions and reality.
https://t.co/fLJVwcHRrk
How scary is the workplace? We partnered with @JobsiteUK to create this illustrated article that explores employees' fears and phobias.
https://t.co/26n5NeuSGz
Last year we created this data visualisation for @sciencefocus which explored amateur marathon running. This spread compared the performance levels and gender-split of athletes of over 40 different nationalities.
Check it out here: https://t.co/RsjxRNAdwd
We worked with @sciam to create this data visualisation commemorating the 50th anniversary of Apollo 11. This double-page spread documents the goals, successes and failures in attempting to reach the Moon.
Get a closer look here: https://t.co/O9DUVjysWa
In one of our first projects, we worked with Cytora to create an animated microsite that explains how they're using AI to transform the insurance industry.
More details available here: https://t.co/ztGdCIg2ls
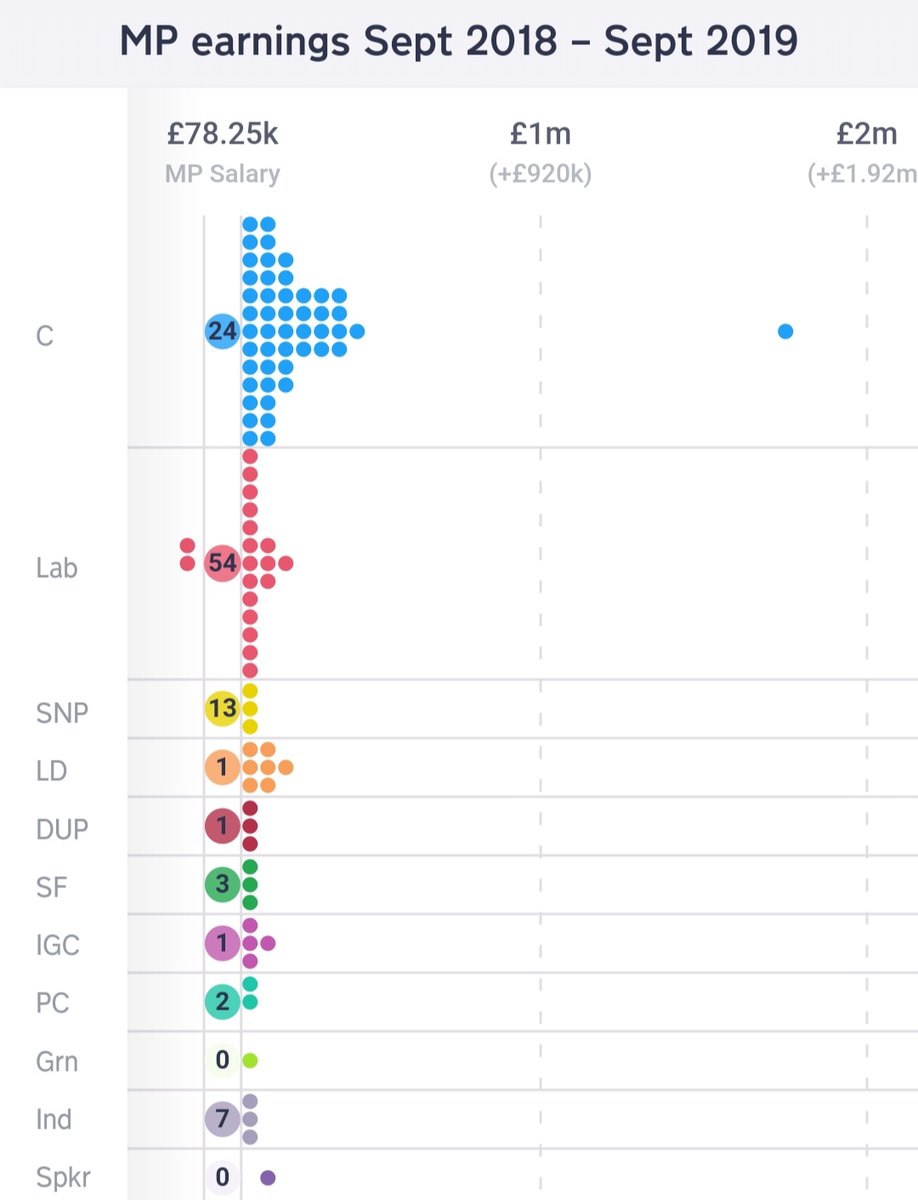
We're now on Behance! We'll be adding projects through the week - first up is Richest MP, our interactive tool that explores how much MPs got paid in the last year of parliament.
Check out our Behance project profile here: https://t.co/Er6TCTC97q
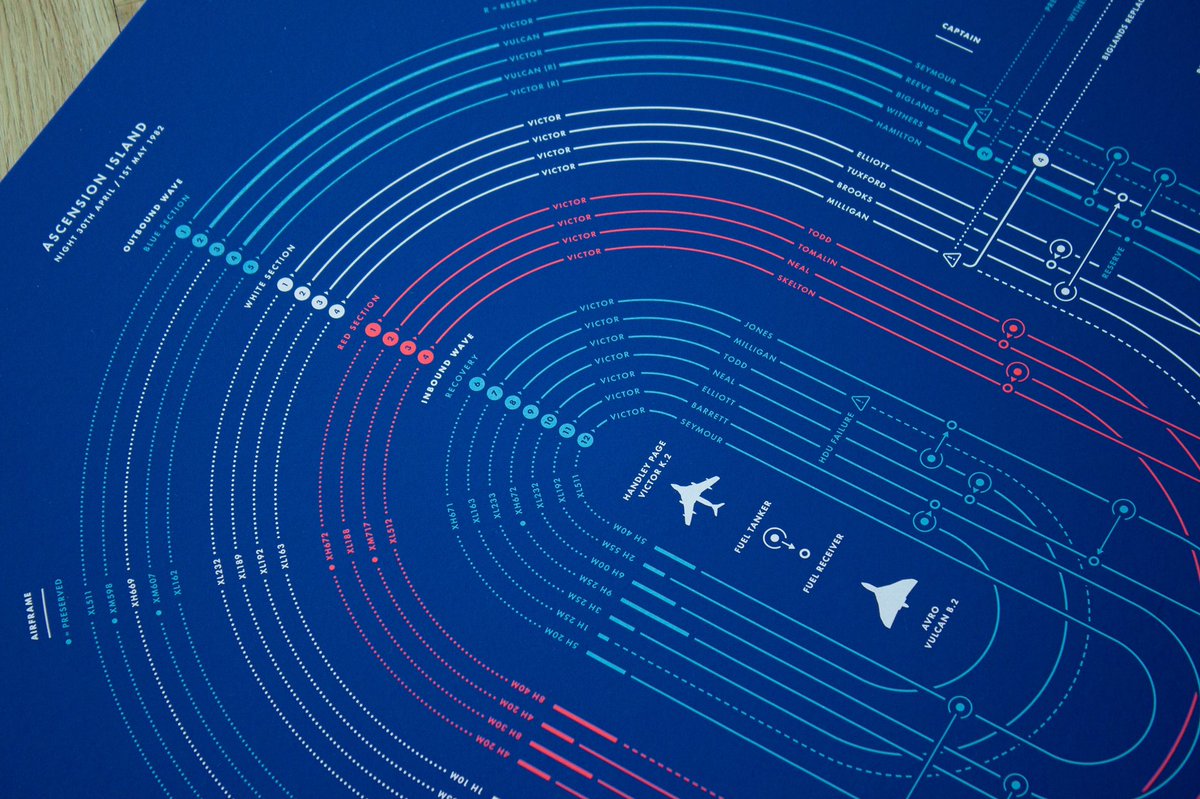
FYI: new Operation Black Buck dataviz screen print will available to buy from 9pm GMT tonight. 3 inks, limited edition of 100 signed and numbered. https://t.co/rmgvw6MwKG
Our project for @JobsiteUK on fears and phobias in the workplace has been nominated in the @Shorthand Choice awards. Check it out and cast your votes here: https://t.co/AjVASdJmNB 🕷️
#dataviz#ddj
With 1 day to go until the election, which MP in the previous parliament earned £94k for a 2 hour talk in NYC?
Check the side gigs of every MP at https://t.co/l45hBEOVog ✈️✈️✈️
#GE19#Vote#Election2019#dataviz#ddj
Which former Environment Secretary picked up £50k p.a. additional salary from an animal feed producer? For 8 hours work a month.
Find out what MPs were really earning: https://t.co/l45hBEOVog
#GeneralElection2019#Elections2019#downonthefarm🐖🐖🐖
Boris Johnson and Jeremy Corbyn are facing off on #BBCLeadersDebate. But how much does each one actually earn? Find out with https://t.co/l45hBEOVog - a #dataviz tool that lets you dig into the income of every (former) MP.