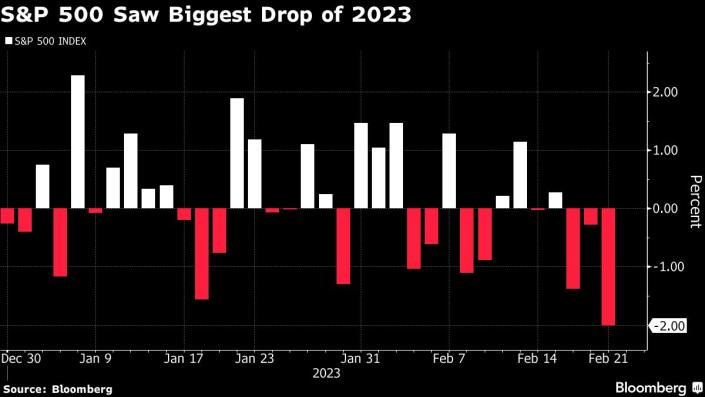
S&P 500 up >5% in January and then down in Feb?
Pretty rare. I see 1976, 1980, 1989, and 2018.
All four are up six months later (9.9% avg).
All four are up 12 months later (8.3% avg).
The S&P 500 closed today at 4147.6, above its 200-day moving average for the 18th session in a row…
No prior S&P 500 bear market in history has made a new low after making 18 consecutive closes above its 200-day average…
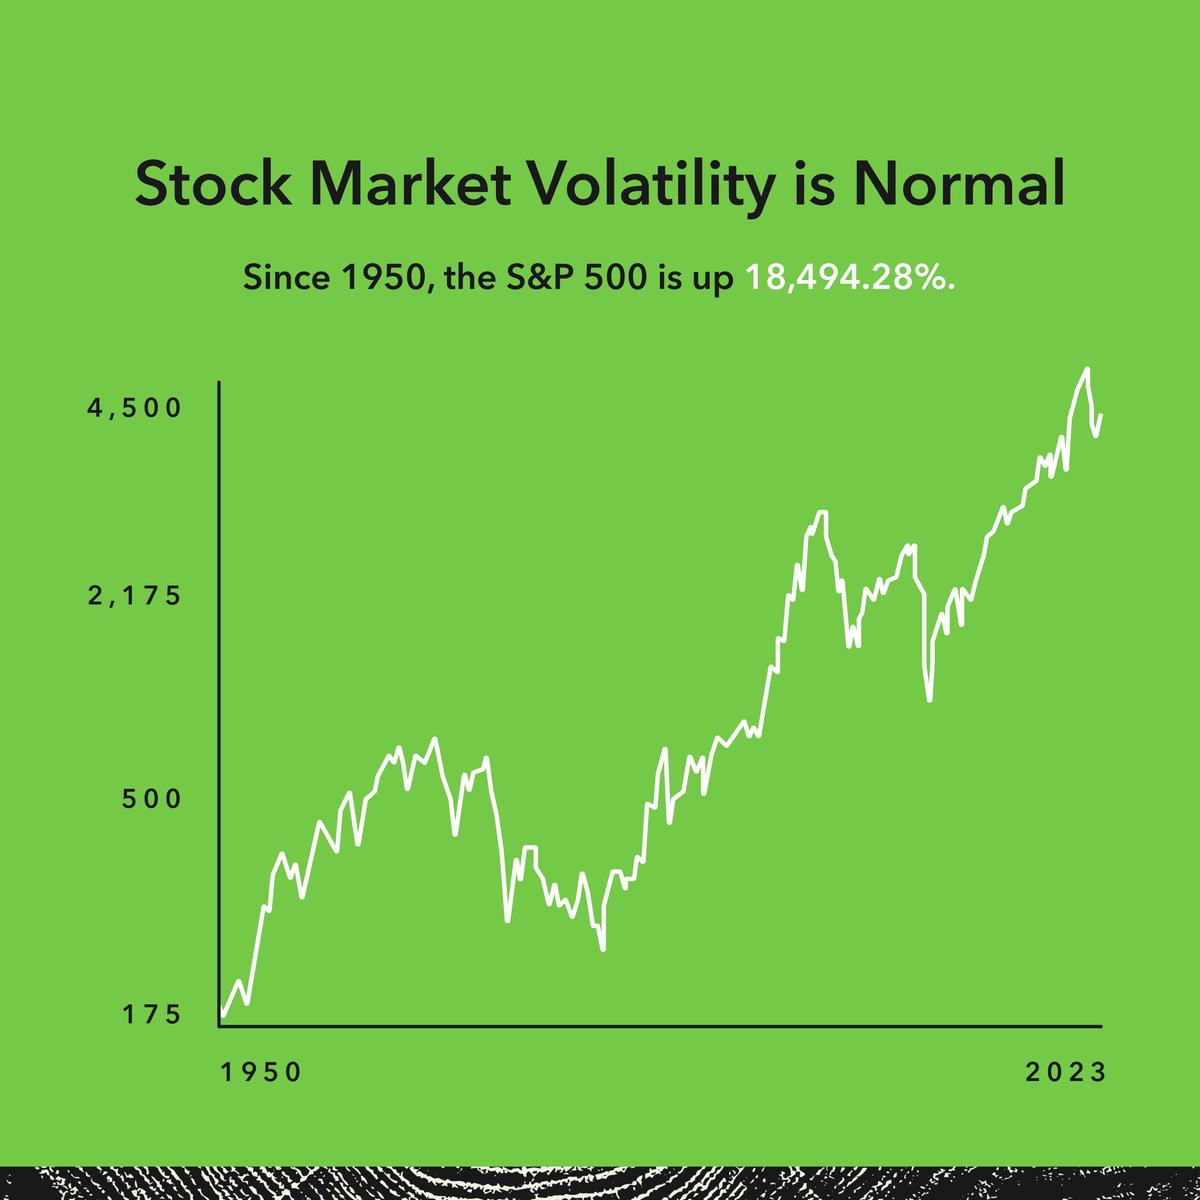
Stock market crashes and volatility are part of investing. But remember every downturn has ended in an upturn. #acorns
For informational purposes only. Investments cannot be made directly in an index.
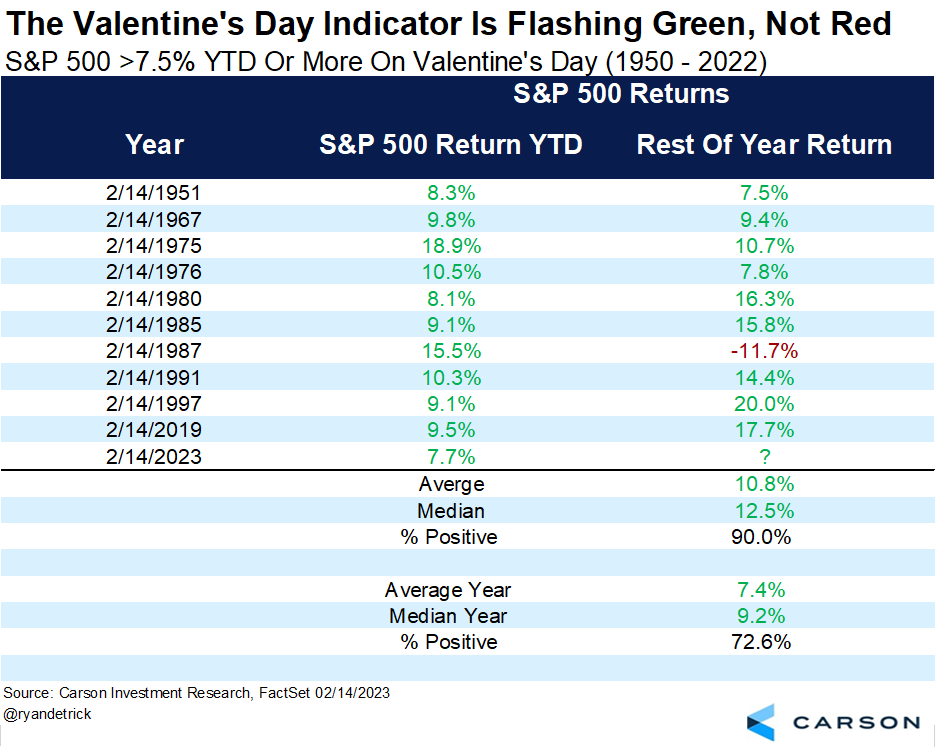
The S&P 500 is up more than 7.5% YTD on #ValentinesDay.
Turns out, this usually leads to more green than red. In fact, the rest of the year was up nearly 11% on avg and higher 90% of the time. Only 1987 saw red returns.
Acorns portfolios were built on time-tested investing principles and are designed to give your money a chance to grow over time. #acorns
Read more here 👉 https://t.co/PjcCoAJ3Xh
S&P 500 daily performance after last six CPI reports:
🟢 August +2.10%
🔴 September -4.35%
🟢 October +2.64%
🟢 November +5.50%
🟢 December +0.76%
🟢 January +0.36%