Bitcoin has two kinds of activity: trading (bets on price) and moving coins (actual transfers on the network). Weekends kill the first - Saturday futures volume is ~34% of a weekday's. The second does not even slow down: transfers keep 107% of weekday pace, all weekend.
Same split hour by hour. Coin transfers peak at 09:00 UTC - before the US even wakes up - and go quietest at 17:00 UTC, the heart of the US trading day. Busy hours run ~2x the quiet ones. The network's day is not the trader's day.
Why care: weekend prices move on thin markets (~34% of normal futures volume) while the network never slows. And it is structural: over the last 365 days Saturday futures run 36% and Sunday 52% of a weekday. We measure both sides ourselves - ask if you want the how.
@follis_ The numbers back you harder than expected. Over the last two years BTC buy-and-hold turned 100 into 109.4; cash at 4.5% turned it into 109.2. Same finish - one of them through a 53% drawdown at 44% vol. Sharpe of holding: 0.00 over 2y, -1.52 over 1y. Sitting still was the trade.
@seth_fin The 2% part is exact - 65,181 to 63,953 on my pull. The OI side is where I land smaller: Binance USDT-M, Bybit and OKX together went $13.68B to $13.06B, so -$0.62B (-4.5%). Reaching $3.83B needs the other venues to carry 84% of it, which is a lot for the smaller books.
@Web3Niels Fair enough as a plan - but that shelf is thin, not thick. 54-55k holds 0.22% of two years of BTC volume and none at all of the last twelve months; price only traded there in 2021 and 2024. Thin shelves get crossed fast. The heavy volume sits 62.7-64.0k.
@cryptogoos The fee half is stronger than you put it: the average ETH fee is $0.056, the 0.2nd percentile of 3,280 days and 27x below the median of history. Transactions are top-1% too, but not an all-time high - 2.91M on 9 Aug against the 3.63M peak on 28 April.
@cryptorover Reclaim checks out at 64,125. On the two venues you named, though, the tape splits: OKX open interest is up (+0.31% 3h, +1.80% 12h) while Bybit is down on every short window (-0.36% 3h, -2.53% 24h). Adding size shows as rising OI, so it is OKX doing it, not both.
@AshCrypto The buy is real and so is the drawdown - ETH is 62% off its high. Worth adding the scale: $24.2M is 12,896 ETH, about 0.34% of today's $7.1B tape, roughly five minutes of trading. It takes ~94 buys that size to move the cap by 1%.
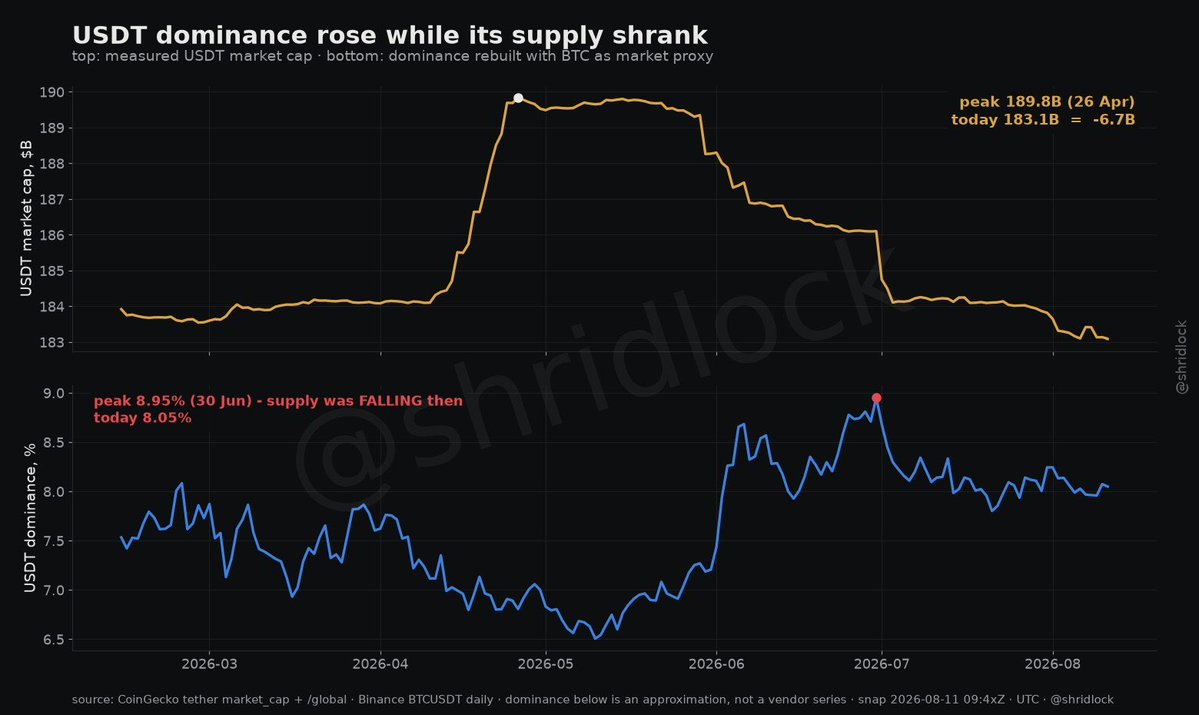
@CryptoTony__ The shape checks out - dominance did run to 8.9% on 30 June and sits at 8.05% now. Worth adding what drove it: tether's cap FELL $6.7B since late April (189.8B to 183.1B), so that leg up was the market shrinking, not stablecoins arriving.
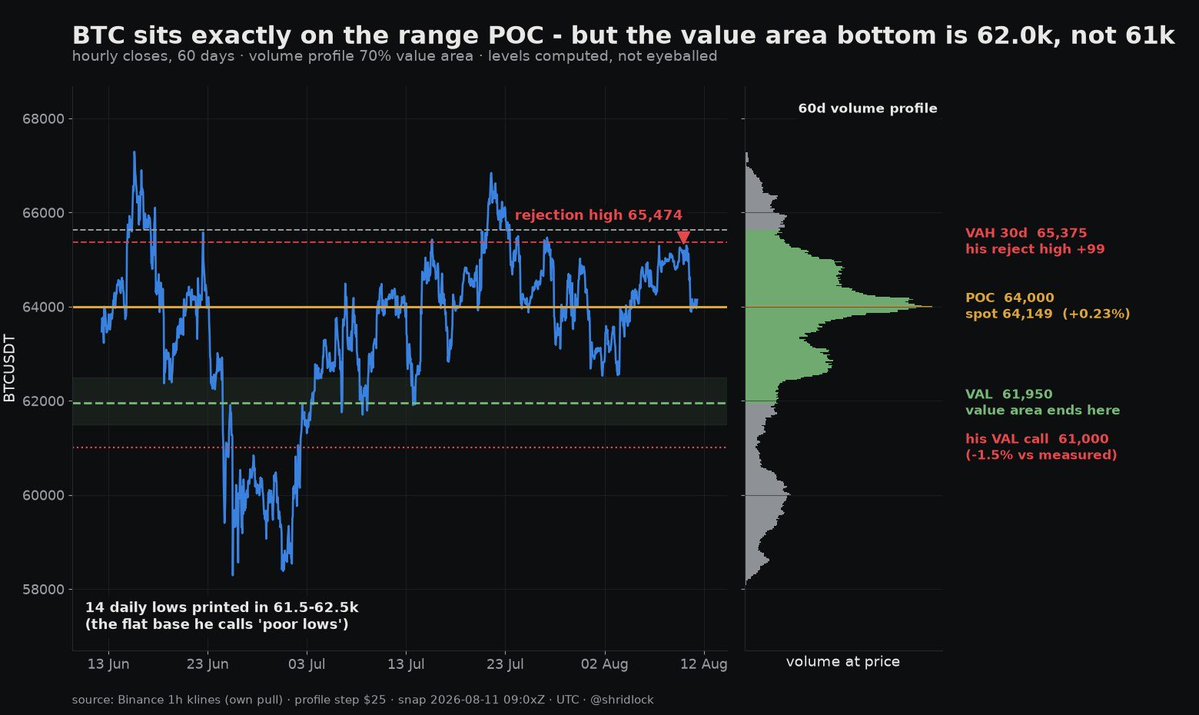
@The_JDK99 Four of your five levels land on my own profile: spot is 0.2% off the 60d POC (64,000), the aVWAP sits just below at 63,737, and the 30d VAH 65,375 got tagged at 65,474 before the reject. One correction: the value area ends at 61,950, not 61,000.
@cryptojack Checks out on the ranking - nothing deeper since 2021 on my pull, and I get -18.27% against Galaxy's -18.5%. Two numbers worth adding: China's was -45.41%, more than twice as deep, and this one has already run 214 days against 196 for that one. Shallower, but longer.
@AdamBLiv Ran all seven numbers and they hold - average error 0.08% on my pull, 10.13x against your 10.1x. Worth adding: that average has never fallen year-on-year, 0 of 3,647 days, so growth is the baseline. The rate is the story - and +21.4% is the 7th percentile of its own history.
@kabukistory Direction checks out, but the chain skips a few. Since the Oct-2025 peak there are nine swing highs, and two printed HIGHER than the one before: 97,939 in Jan (+3.5% on Dec) and 82,833 in May (+9.0% on Mar). 116,381 in Oct is missing too. Lower overall, yes - every rally, no.
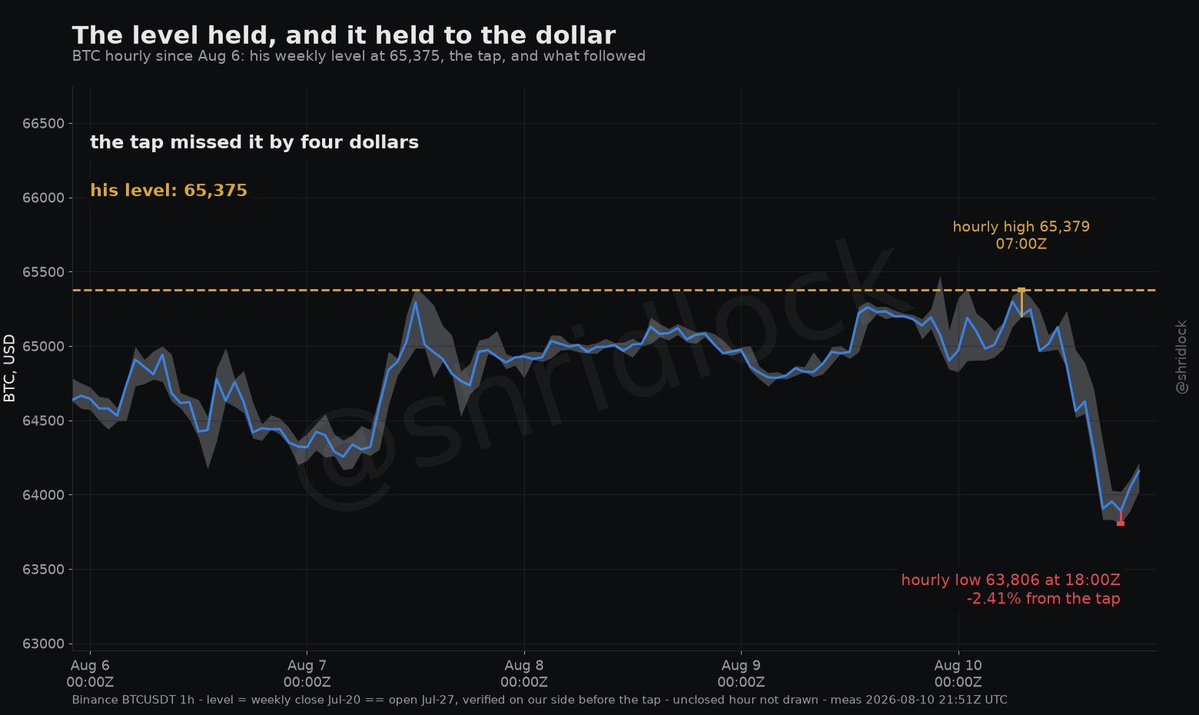
@astronomer_zero Called in advance and it held to the dollar: your 65,375 was tapped at 65,379 this morning at 07:00Z - four dollars of overshoot - and price ran -2.41% from there to 63,806 by 18:00Z. We had the same level on our side from the weekly close, so this one is clean on both rulers.
@QuintenFrancois True - and what came after wasn't one-sided. A month on from the Dec-2022 sale BTC was +35.4%; a month on from the May-2026 one it was -20.4%. Three of the five disclosed sales have a full 30-day window: two up, one down. Today's 1,690 BTC has none yet.
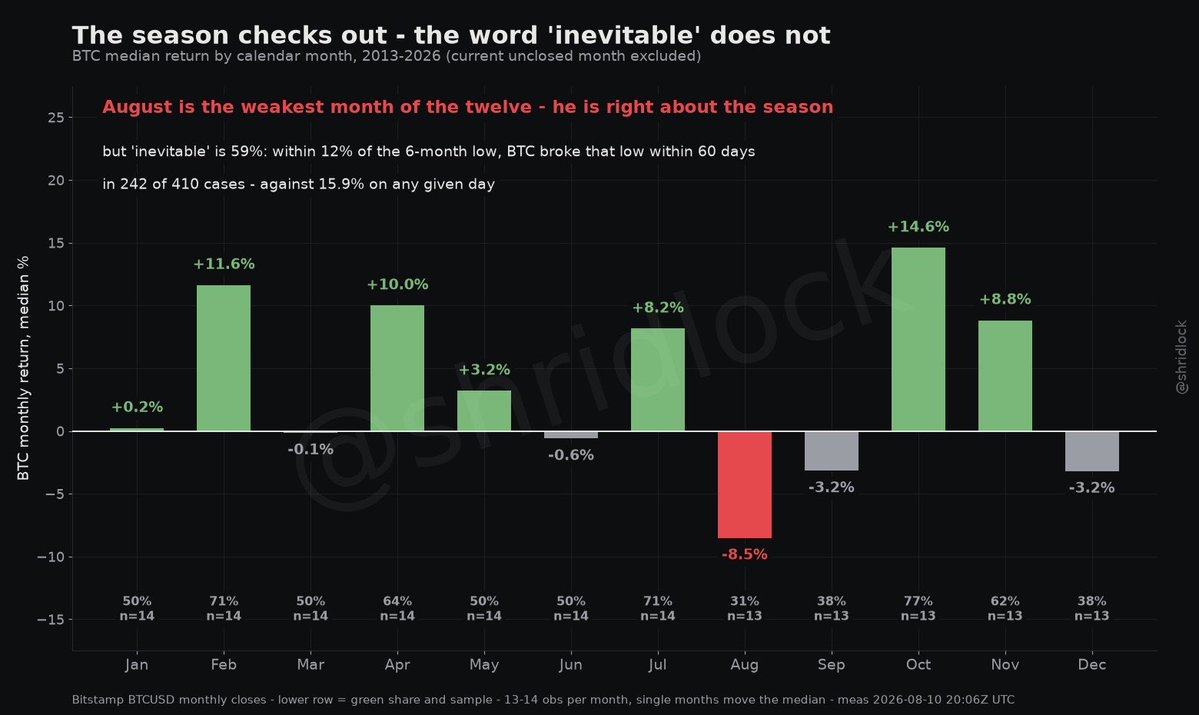
@ArdiNSC You're right about the season - August is the weakest of the twelve: -8.5% median, green in only 31% of years. The +10.87% above the low checks out too. On the last word I'd swap "inevitable" for a number: from setups like this, BTC broke the low inside 60 days 59% of the time.
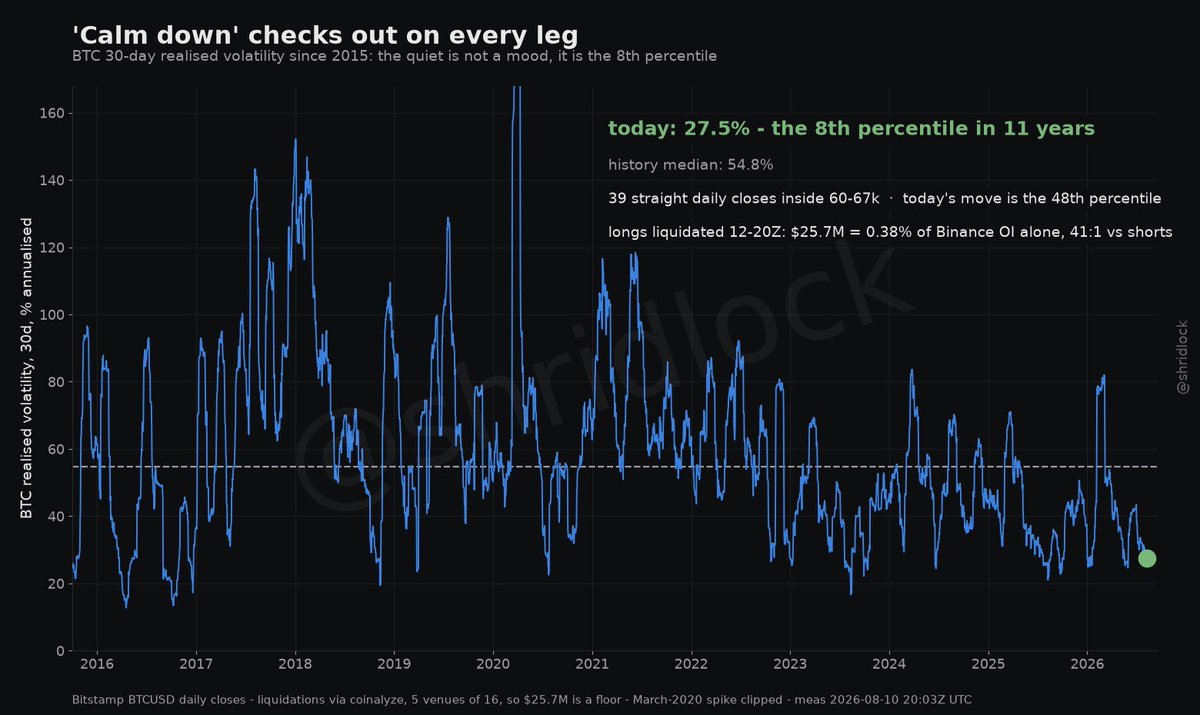
@CryptoMichNL Every leg checks out, and the quiet is bigger than it sounds: 30d realised vol is 27.5% vs a 54.8% history median - the 8th percentile in 11 years. 39 straight closes inside 60-67k, today's move is only the 48th percentile, and the longs flushed 12-20Z were 0.38% of Binance OI.
@joao_wedson@Alphractal Checked the whole record and your count is exact - twice, never more. Worth adding the scale gap: 2021 bottomed at -21.18% YoY, this one sits at -1.51%, about 14x shallower. It has run 56 days against 107 in 2021, and difficulty is 18.3% below its Oct-2025 peak.
@cryptorover The level is real - it held both times. But "every time" does a lot of work: BTC closed 5 weeks above the 21W EMA, 3 of them in Apr-May, one at +4.33%. Both runs did give it all back (-13.7% and -15.1% four weeks later). I print the EMA at 69,342 - spot is 8.6% below it.
@JustinBennettFX You're right it's a real fork - and it's testable. Since 2017, on S&P days <=-1%: BTC same-day median -1.40%, 66% red (n=274), well outside a shuffled-date null. The rotation leg doesn't clear it: +1.02% at 5d, +2.06% at 20d both sit inside the noise. July high is +4.97% away.
@DonWedge Your level is exact - the 6h 200MA prints 63,359 right now. Worth adding what happened the other 13 times price closed under it this year: 48 hours later the median was +0.64%, and price was higher in 62% of them. Losing it has not been the tell.
@CryptoReviewing Held it up against block heights: the lag from bear low to the next halving ran 542, 513 and 528 days for the last three cycles - your 550 is right there. 2011 is the odd one at 376. With the next halving around Apr 2028, that window is Oct 11 - Nov 10, 2026.