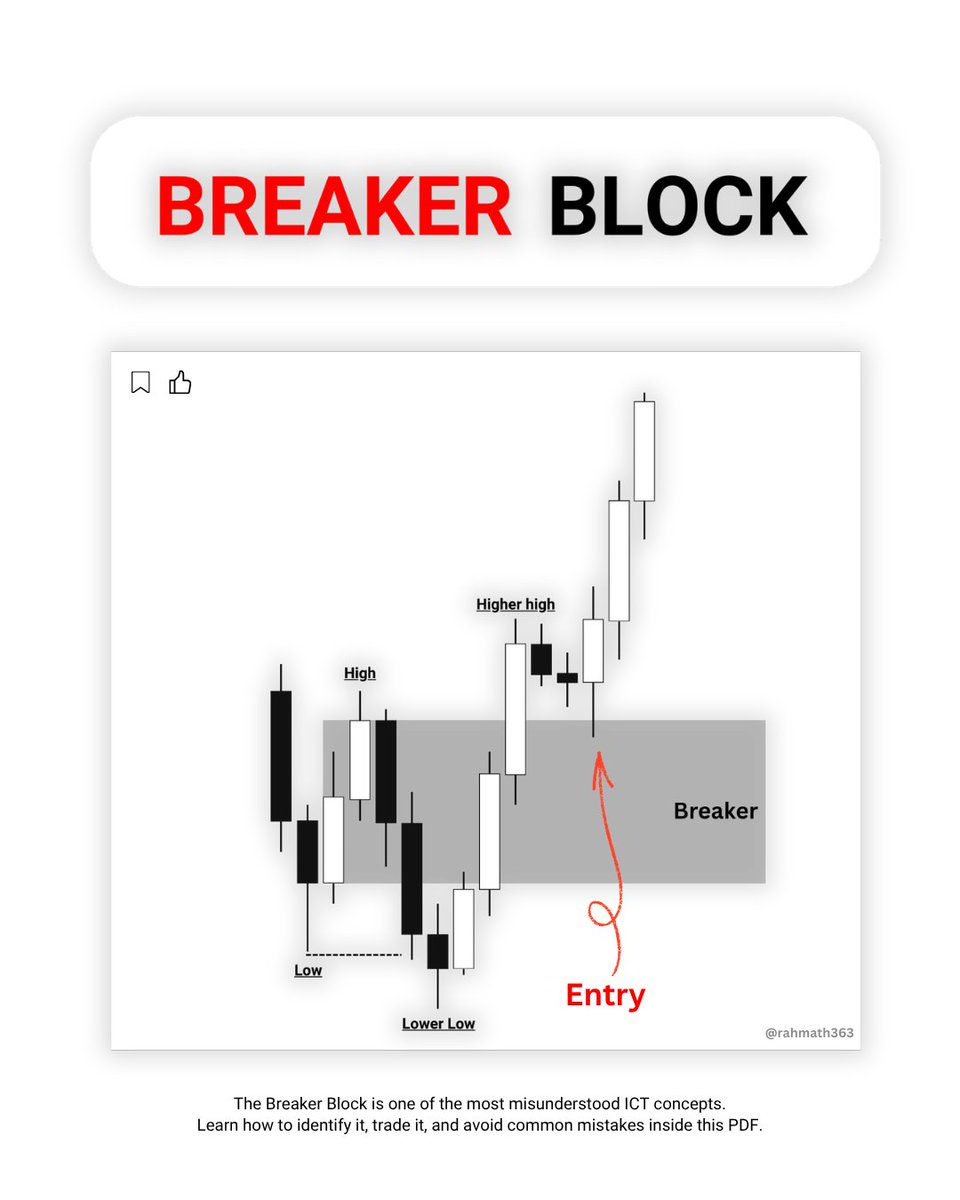
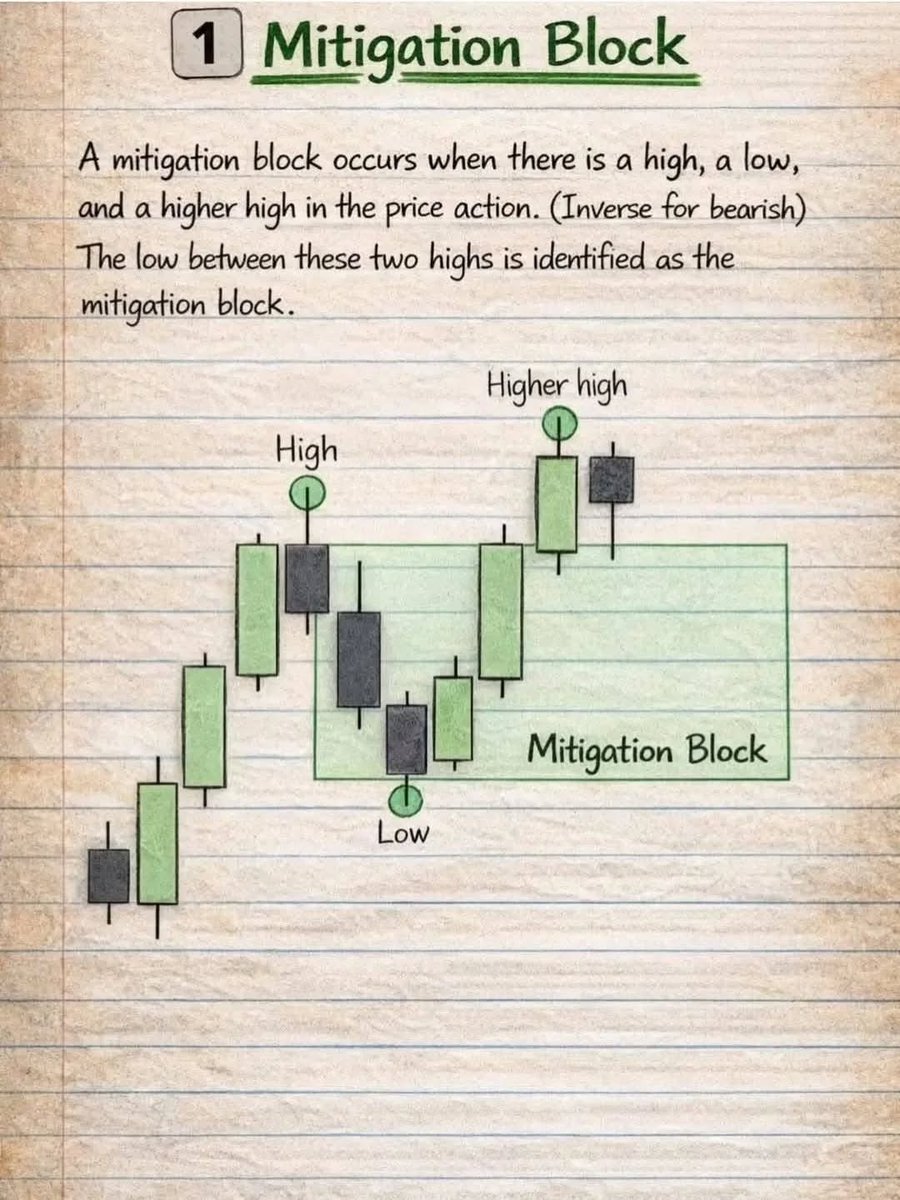
The MSS vs CISD lesson I wish I learned sooner.
This single concept made my PO3 entries significantly cleaner.
Here's a complete breakdown with chart examples🧵
19 kg fazlam vardı, kocaman bir göbeğim ve çift çenem vardı ve yaz bitmeden %13 vücut yağ oranına ulaşmam gerekiyordu. Bunu şu 25 kural ile başardım:
KURAL 1. KOŞMAYI BIRAKIN (dizleriniz için).
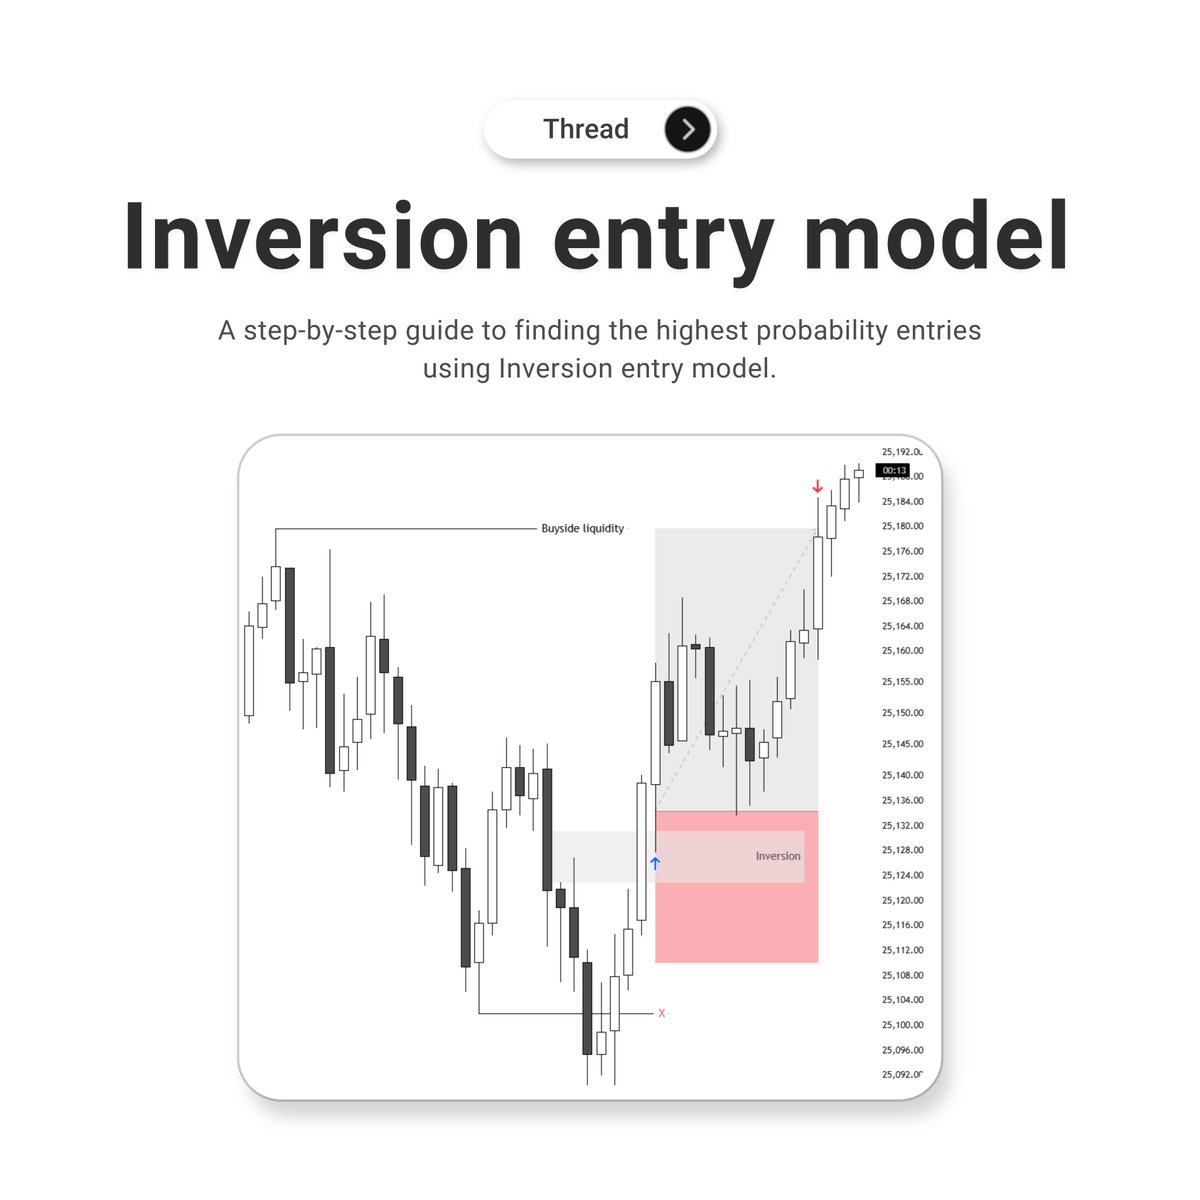
Most ICT traders think MSS and CISD are the same thing.
That's exactly why they keep getting trapped.
This thread will change how you read price forever.
A Thread🧵
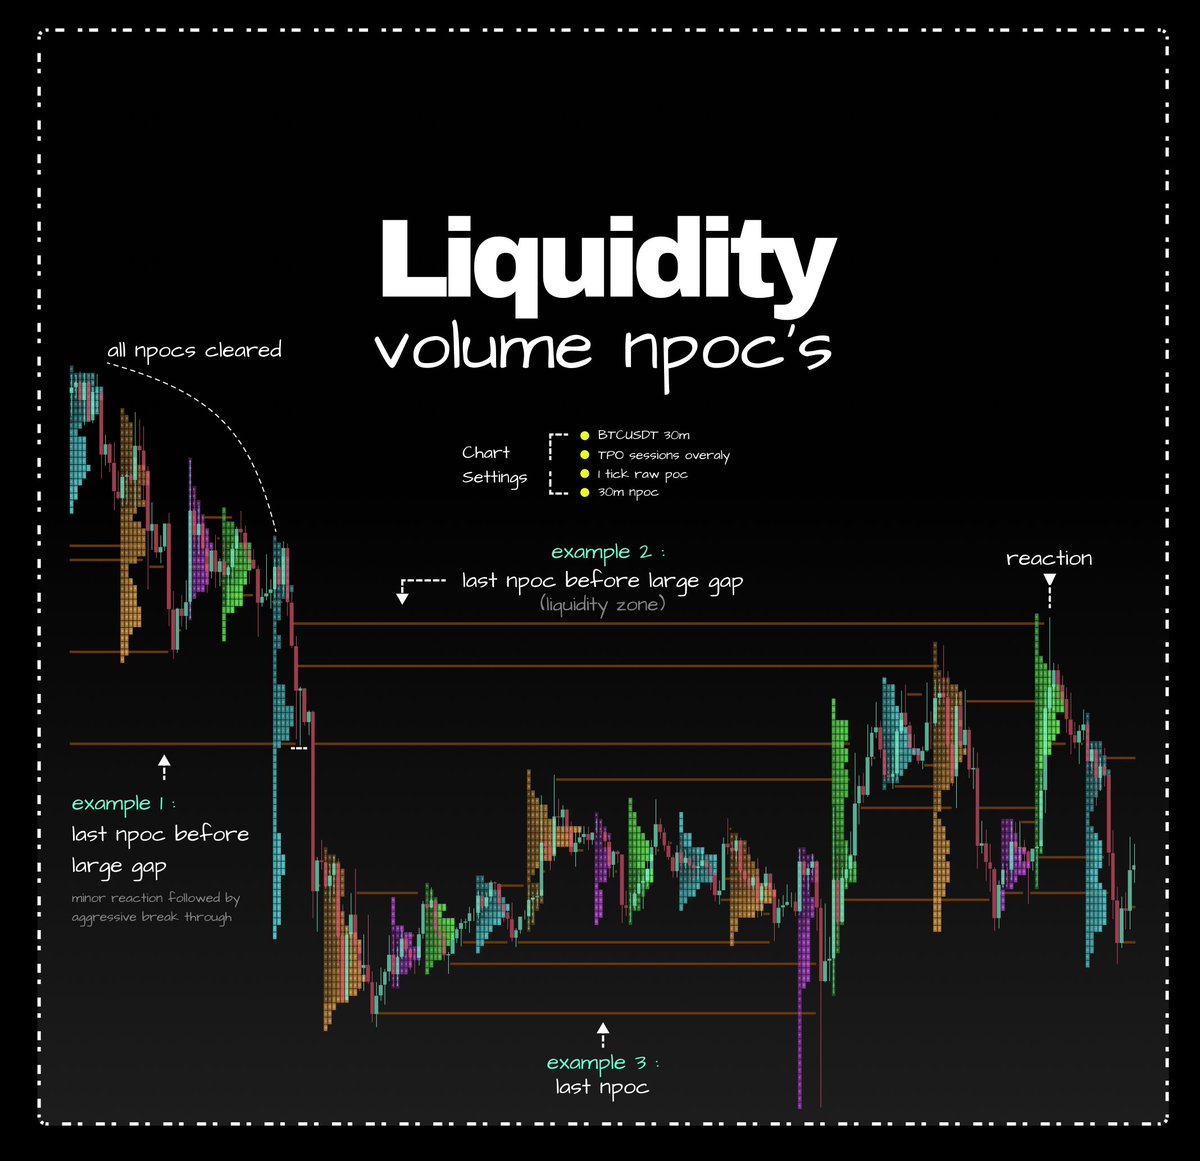
Volume npoc's
Act as good reactionary levels of liquidity.
Using the areas where price has had the most transactions in 30m candles.
Specifically focussing on “last tap” areas.
One of the areas I pay key attention towards.
…detailed breakdown below↓
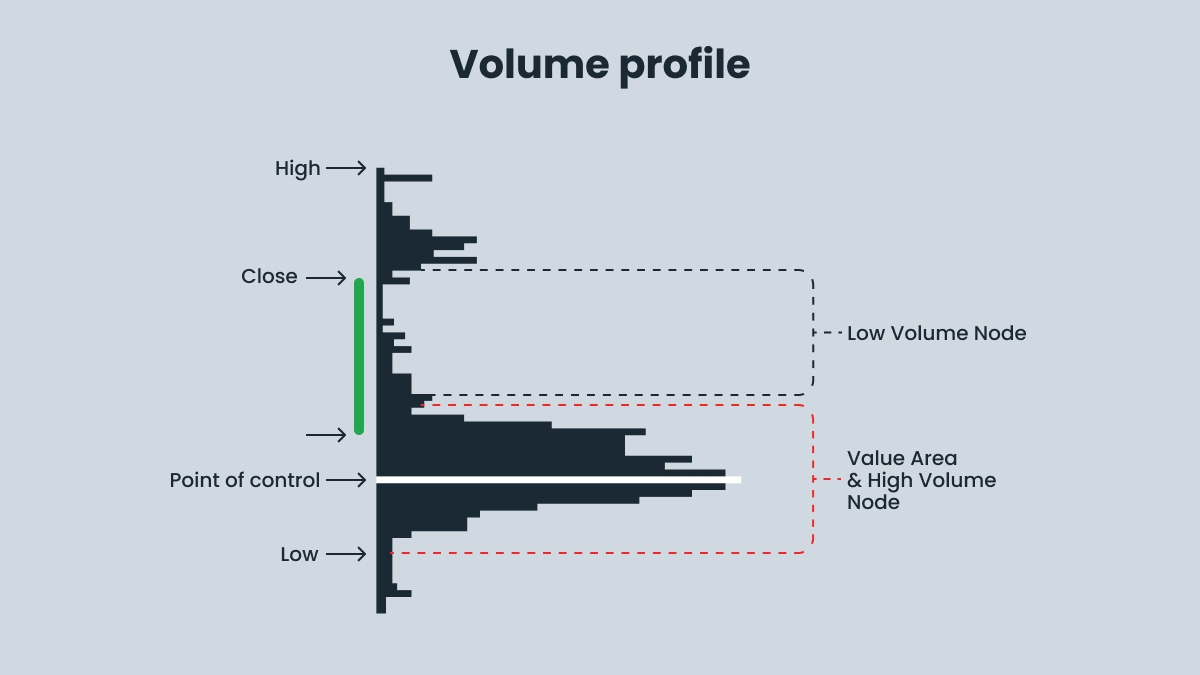
This is the VOLUME PROFILE and it can give you precise SNIPER level entries for your trades.
Most traders don't know about this simple & powerful tool.
But after going through this thread 🧵,
you will know how to add it to your trading arsenal.👇
Winning the entry means nothing
if you don’t know where to exit.
That’s where most traders fail quietly.
They’re right… but still unprofitable.
Let’s fix that.🧵
The Pre-Trade Checklist That Took Me 3 Years to Build.
You voted. You chose. Here it is.
Most traders lose money not because their analysis is wrong — but because they skip steps.
They see a candle move, feel the urgency, and click the button before they've even asked themselves why they're taking the trade.
I used to do the same. Then I started tracking every trade, every mistake, and every time I entered without a plan.
The pattern was obvious: the losses almost always came when I skipped the process.
So I built a checklist:
Four phases.
Every trade.
No exceptions.
Here's how it works:
PHASE 1 — Before you open the chart.
Check the economic calendar. If there's a high-impact event in the next 4 hours, you need to know.
Check the macro context — is the environment risk-on or risk-off?
Then check your correlations: DXY, SPX, Gold, BTC vs Alts, BTC Dominance, USDT.D. They need to tell a coherent story.
And finally — check your current exposure. How many trades are already open? What's your total risk right now? If you're already at 3% deployed, think twice before adding.
PHASE 2 — Before you identify a setup.
What phase is the market in — range or trend? This changes everything about how you trade.
Identify your key levels: VAH, VAL, PoC, previous highs and lows.
Mark the liquidity levels — where are the unspent lows and highs that price is likely targeting?
And mark the higher timeframe trend on the daily and weekly. You need to know if you're trading with or against the current.
PHASE 3 — Before you enter.
Does this match one of your setups? If not, it's not a trade.
Can you explain your thesis in 2-3 sentences? If you can't, you don't have one.
The higher timeframe gives you direction, the lower timeframe gives you the entry — are both aligned?
Where is your trigger? MSB, retest, break of structure — what confirms the entry?
Where is your stop loss? This is defined before you enter, not after.
What's your R:R? Minimum 2R, ideally 3R or more.
Position size at 1% risk, no exceptions.
And is there confluence? You need at least two TA-based reasons to take this trade.
PHASE 4 — Before you click the button.
Am I revenge trading or FOMO-ing?
Am I sized correctly?
Can I walk away from this trade and sleep fine?
And the last one — journal entry started.
Your thesis is written down before you execute. Not after.
This is the difference between trading and gambling.
One has a process.
The other has hope.
Save this. Use it. Every single trade.
Popeye
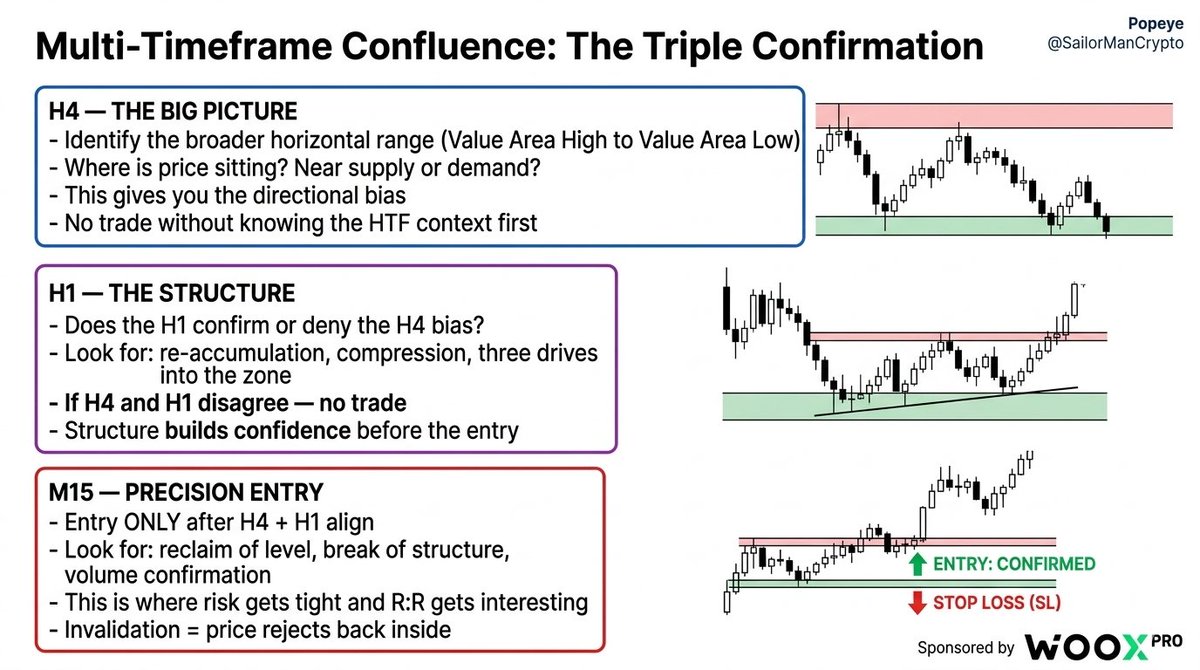
One timeframe is a guess. Three timeframes is a trade.
One of the most common mistakes I see is traders finding a setup on one timeframe and pulling the trigger immediately.
That's not a trade.
That's a coin flip with extra steps.
This educational post is sponsored by @_WOO_X — where I trade crypto with zero fees on spot.
Here's how I actually build a position — and why I need multiple timeframes to agree before I risk anything.
Start with the H4 — the big picture.
Where is price sitting in the broader range?
Is it near a key demand or supply zone?
This gives you the directional bias. Nothing else matters until you know this.
Then drop to the H1 — the structure.
This is where patterns develop.
Re-accumulation, compression, three drives into the zone.
The H1 confirms or denies what the H4 is suggesting. If they disagree, I sit on my hands.
Finally the M15 — precision entry.
You already know the direction.
You already know the zone. Now you're waiting for the trigger — a reclaim, a break of structure, a volume confirmation at the level.
This is where the risk gets tight and the R:R gets interesting.
The magic isn't in any single timeframe.
It's in the overlap.
When the H4 shows demand, the H1 builds a re-accumulation into that demand, and the M15 gives you a confirmed entry — that's when I trade.
Multiple reasons. One position. Tight risk.
Most traders skip the top-down process because it feels slow.
But honestly, this is the part that separates the setups that work from the ones that stop you out right before the move.
I execute these setups on @_WOO_X — zero fees on spot, which matters when you're scaling in and out across timeframes.
One single setup might be wrong. But the process keeps me in the game.
Popeye
#bitcoin #TradingStrategies
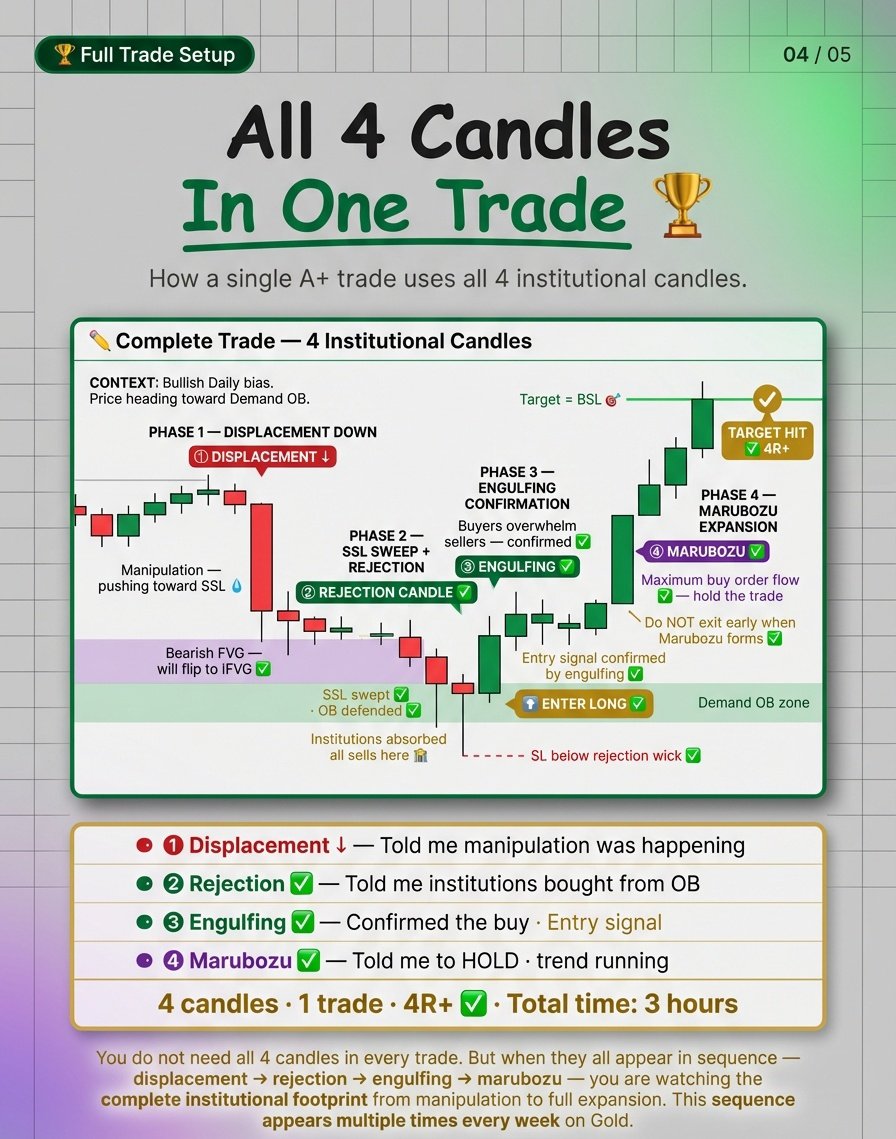
All 4 candles in one trade
1) bullish Candlestick
2) Hammer and Inverted Hammer
3) Engulfing and Morning Star
4) Bullish Pattern bonus in comment
#sharemarket