We track 286 AI companies in the news.
Only 143 of them are public companies in our AI Economy Index.
Yesterday (Nov 5) the Index closed down 8.4%, per Yahoo closes.
Here's every ticker we track in the Index, grouped by sector for you:
This week's AI Power Rankings just dropped.
8 sectors. 40 companies. One board.
Trane Technologies jumped 6 spots in data centers.
Cummins climbed 4 in power.
Schneider Electric slid 3.
And NVIDIA? Still sitting at #1 in AI chips.
We rank every AI company by size and how its latest quarter actually went.
So you can see who's really winning the AI race, not just who's loudest.
Who's missing? Tell us in the comments 👇
Full rankings: link in bio.
Moves compare the Nov 6 board with the Oct 27 board.
This is general information, not investment advice.
The receipts, not just the highlights.
Bubble Watch: https://t.co/04KVktaW00
The Pulse, our weekly read: https://t.co/8SQzNIlVgE
Power Rankings on the homepage: https://t.co/bKWyVJmNEd
Brad's full Summit talk: https://t.co/oBAudFedMA
The Nov 5 reporting: https://t.co/XmF0KvhiYC
Two months ago, Brad Gerstner (@altcap) warned about an opponent that could slow AI.
Regulation.
This week, it showed up.
Two incoming governors want limits on new data centers, including conditional pauses.
Could a permit pop the AI bubble?
That sounds ridiculous.
Until you remember what AI actually runs on.
Not a demo.
Not a keynote.
Buildings full of chips, connected to electricity.
If those buildings can't open, the rest of the schedule starts slipping.
This is why government slowdown has been on our Bubble Watch since September.
It wasn't added after this week's drop.
It's one of the nine checks we follow, built around the conditions Gerstner laid out at the All-In Summit.
The question is simple: do rules make the build more expensive, or do they stop it?
Those are very different games.
WHAT BRAD SAID
In his September Summit talk, Gerstner said: “So regulation's a threat. It's a risk.”
But he wasn't arguing for no rules.
He called for “common sense, pragmatic solutions” and said people need confidence that AI is safe.
That's the part worth remembering.
This isn't just builders against politicians.
The people living next to these projects get a say, too.
THIS WEEK MADE IT REAL
From the Nov 4 close to the Nov 5 close, our AI Economy Index fell 8.4%, per Yahoo daily closes for Nov 5, 2026.
The S&P 500 fell 4.36% over the same period, per Yahoo daily closes for Nov 5, 2026.
Nearly twice the drop.
Axios reported on Nov 5 that Texas and Ohio's incoming governors want limits on new data centers.
Texas's Gina Hinojosa promised a pause until stronger protections are in place.
Ohio's Amy Acton called for conditional pauses tied to utility costs, community benefits and union labor.
Those were reported policy positions.
Not proof that every project has stopped.
And one headline doesn't explain every move in the market.
But the tension is real.
Builders have a schedule.
Voters have concerns.
Neither disappears because the other side has a slide deck.
COULD THIS POP THE BUBBLE?
Here's how it could.
A delayed stadium can still have bills arriving.
If power and permits push opening day back, revenue can arrive later than planned.
If enough projects slip, suppliers could face delayed orders.
Lenders could question the timetable.
Expectations built around a fast rollout could come apart.
AI wouldn't have to stop being useful.
The build could simply arrive too late for the business plans written around it.
AND WHY IT MIGHT NOT
A pause isn't a permanent ban.
Builders could change a project, meet the conditions or find another location.
Slower construction also doesn't automatically mean people stop using AI.
Existing capacity, better software and more efficient chips could still support growth.
Gerstner made that distinction in the same talk.
He thought the compute build would fall short of the forecast he discussed, but still be enough to support the revenue growth he expected.
That was his view, not a guaranteed result.
OUR TAKE
A red card for one stadium isn't the end of the league.
But widespread delays would be a different story.
The test isn't how angry the speeches get.
It's which rules take effect, which projects change and whether the money coming in can support the bills.
That's why we keep separate scoreboards.
Bubble Watch checks the conditions behind the build.
Our AI Economy Index records how the public-company basket moves.
Power Rankings place companies within their divisions using sourced size measures and news.
A rough market day doesn't automatically mean the technology stopped progressing.
A great demo doesn't prove the business works.
Follow Silicon Sideline for Bubble Watch and the AI Power Rankings every Friday.
The tracker and rankings are in the first reply.
Share this with someone who thinks the whole AI story starts and ends with chips.
Rankings and game results describe what already happened. They are not a view on where any share price goes next. This is general information, not investment advice.
Should towns get to call timeout on AI until builders cover the local costs, even if that slows the whole league?
Here’s the definitive guide to using Grok Bot for content creation.
We work with hundreds of creators every month and produce hundreds of pieces of creator and brand-owned content. Grok Bot is how we’re able to do this at scale while maintaining, if not improving, the quality of our content.
I’ll be sharing my full workshop and more clips soon, breaking down how to automate your entire content creation workflow with Grok Bot.
Let me know if there’s anything specific you’d like to see!
Also here's the Bot I use to edit my videos: https://t.co/K4YOfEc1VC
Honestly, without sounding cliche, if you love innovation and business evolution…
What a GREAT time to be alive!!
Do you agree? If you do, we are for sure friends!
BREAKING: @IBM just took the #1 spot in our AI Software Power Rankings.
Yes, IBM.
The 115-year-old company.
It knocked @Siemens down to #2.
Here's why 👇
IBM's last results (21 Oct) showed:
Sales up about 5% vs a year ago.
Profit per share up 25%.
More spare cash than a year ago.
Not flashy.
Just solid.
And this week our rankings started counting results, not just size.
Siemens has no fresh quarterly filing in our data yet, so its results score stayed neutral.
So what's really going on?
I think the boring company that keeps delivering just beat the hype.
Who climbs next? Full rankings 👇
Rankings and game results describe what already happened. They are not a view on where any share price goes next. This is general information, not investment advice.
@Tesla Source: Silicon Sideline, 6 Nov 2026 vs 5 Nov 2026.
https://t.co/ZhHYbne8yU
Free weekly Pulse: https://t.co/gkmQ0XDb9R
Tesla results filing, 22 Oct 2026:
https://t.co/X9LjSDRndj
BREAKING: Tesla (@Tesla) $TSLA just dropped from No. 1 in our Robotics Power Rankings. Its weaker results, reported on 21 Oct, fed the results input that put it second. A familiar name has taken the crown. Who moved ahead of Tesla? Here's the switch on our 6 Nov table:
Meet the new No. 1:
Toyota (@ToyotaMotorCorp) $TM.
Toyota rose from second to first as the size-plus-results calculation reordered the division.
Tesla fell from first to second with lower revenue, diluted earnings per share and free cash flow versus a year earlier in its reported 21 Oct 2026 results input.
Our Power Rankings follow the businesses behind AI, division by division. Size is the main factor, with recent reported results also counting. Think business form, not a contest for the better robot.
Rankings and game results describe what already happened. They are not a view on where any share price goes next. This is general information, not investment advice.
Full Index: https://t.co/m4PqsdrL48
Free weekly Pulse: https://t.co/gkmQ0XDb9R
Source: Yahoo closes, 6 Nov 2026. IREN release: https://t.co/M09mHU2WqV
This is general information, not investment advice.
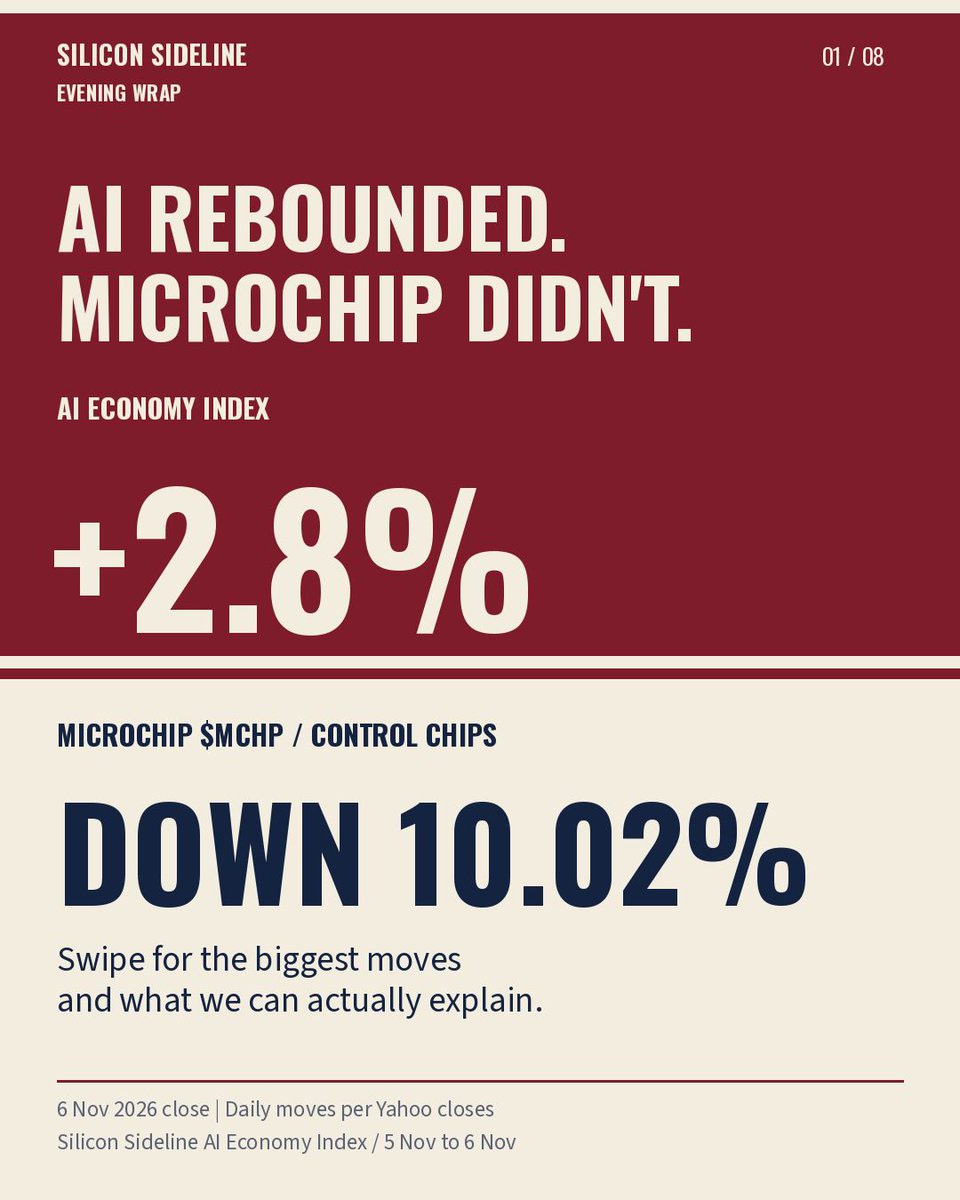
The AI economy bounced, but not everyone joined in. Our AI Economy Index tracks public companies building and running AI. It rose 2.8% from the 5 Nov close to the 6 Nov close, per Yahoo closes. One big name isn't the whole game. A real reset, or one good session?
Source: Silicon Sideline, 5 Nov vs 6 Nov 2026 closes.
https://t.co/kLbz5CXTOR
Free weekly Pulse: https://t.co/gkmQ0XDb9R
This is general information, not investment advice.
Game day: AI just outscored Wall Street's two big scoreboards.
Our AI Economy Index rose 2.85% on 6 Nov, more than 9 times the S&P 500's 0.31% and well past the Nasdaq's 1.09% (Silicon Sideline, 6 Nov).
That snaps 2 sessions behind both.
The catch: it is still 21.2% below its 6 Oct peak (Silicon Sideline, 6 Nov).
One great game or a comeback?
This is general information, not investment advice.
Tesla is now second in our robotics business rankings. Here's what that actually means.
Our Power Rankings are a league table of the businesses behind AI, from electricity to robots. Size still counts. Recent sales, profit per share and spare cash now count too, compared with a year ago. Their effect fades over time.
Spare cash means free cash flow: cash left after running the business and equipment costs.
This is the 6 Nov board versus 5 Nov, not a robot contest.
TOYOTA TOOK FIRST
Toyota $TM, vehicles and robotics: 2 to 1.
Toyota rose because others moved around it, with no sourced quarterly filing in the calculation.
Tesla $TSLA, electric vehicles and robots: 1 to 2.
Sales, profit per share and spare cash all fell from a year ago, moving Tesla down.
That is not proof Toyota built a better robot.
ELEVEN PLACES EACH
MKS $MKSI, tools used to make chips: 34 to 23.
A year on, MKS grew sales, profit per share and spare cash.
Veeco $VECO, chipmaking equipment: 50 to 39.
Veeco climbed with higher sales, profit per share and spare cash than a year ago.
MORE SALES WEREN'T ALWAYS ENOUGH
Honeywell Technologies $HON, industrial automation: 4 to 10 in AI software and apps.
Sales rose, but Honeywell had less profit per share and spare cash than a year ago.
Arm Holdings $ARM, processor designs: 14 to 18 in AI chips and networking.
Arm had more sales, but less profit per share and spare cash than a year ago.
Qualcomm $QCOM, chips and wireless: 6 to 9 in AI chips and networking.
Qualcomm slipped with lower sales and spare cash than a year ago.
THE POWER SWITCH
Caterpillar $CAT, heavy equipment and engines: 2 to 1.
Caterpillar moved up with sales, profit per share and spare cash all growing from a year ago.
GE Vernova $GEV, equipment for generating and moving electricity: 1 to 2.
GE Vernova had higher sales, profit per share and spare cash than a year ago, but Caterpillar moved above it.
THE SOFTWARE SWITCH
IBM $IBM, business computing, software and services: 2 to 1.
More sales, profit per share and spare cash than a year ago lifted IBM.
Siemens $SIEGY, industrial automation and software: 1 to 2.
Others shifted around Siemens, with no sourced quarterly filing in its ranking.
Missing results in the calculation does not mean bad results.
Source: Silicon Sideline Power Rankings, 6 Nov 2026 versus 5 Nov 2026.
Rankings and game results describe what already happened. They are not a view on where any share price goes next. This is general information, not investment advice.
Size or recent results: what should count more in this league table?