Left my job. Living on savings.
I've been working on https://t.co/3Mz0ytju7d for 10 years and hope to do it for at least another 10!
So far $1000/month SaaS.
Not stopping.
SpaceX IPO float unlock timeline:
Initial free float: ~4.9%
Potential float available:
Aug 8: ~11.8%
Aug 20: ~15.2%
Sep 9: ~17.7%
Sep 24: ~20.1%
Oct 9: ~22.6%
Oct 24: ~25.1%
Dec 8: ~40.0%
Mar 18, 2027: ~44.1%
May 17, 2027: ~46.7%
Jun 12, 2027: ~50.8%
Musk’s 46.1% stake becomes eligible after Day 366.
Potential float jumps to ~96.9%.
Aug 2027: ~99.5%
Sep 2027: full unlock, 100%
Eligible to sell does not mean actual selling.
It means those shares become available supply.
Samuel Benner, a farmer from the 1800s, published a book with market analysis on periods of panic, good times to buy, and good times to sell. 150 years later, his analysis has proven to be remarkably accurate.
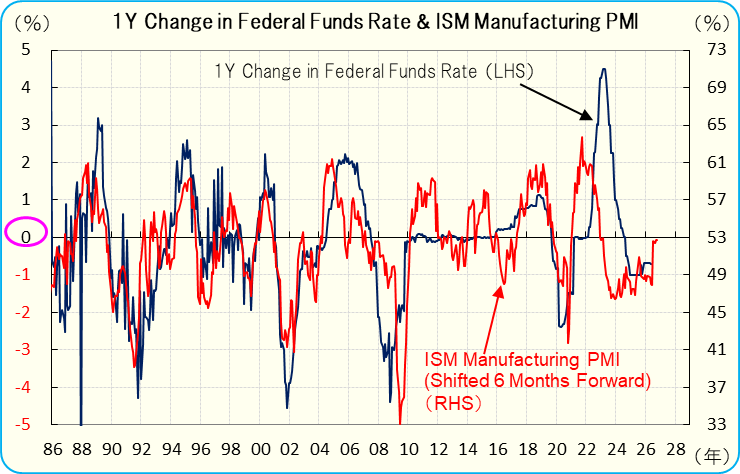
@dailychartbook@IanRHarnett@johnauthers The following chart was once famous, but it lost its audience post-pandemic.
Note that the ISM Manufacturing PMI shares a correlation with the growth rate of corporate profits.
What's going on with $STRC? Let us explain:
$STRC is a product Michael Saylor's Strategy sells to raise cash. You pay $100 for a share, and they pay you back roughly 11.5% a year in cash. Think of it like a high-yield account, not a normal stock. They then use that cash to buy Bitcoin $BTC.
The deal only works if the price stays near $100. That's the promise: park your money here, collect the yield, and your $100 stays worth about $100.
Strategy keeps it near $100 using one lever: the dividend. If the price slips below $100, they raise the payout to attract buyers and lift it back up.
The reason Strategy cares so much? When $STRC sits at $100, Strategy can issue new shares and use the cash to buy more Bitcoin. That's a big part of how the whole machine is funded.
But below $100, the machine stalls. Every $STRC share carries a $100 obligation no matter what it sells for, so issuing at $90 means collecting $90 while still owing dividends on the full $100. They'd be taking on a dollar of obligation to raise ninety cents. So they stop issuing and wait for the price to climb back toward par.
And right now, that machine is breaking. $STRC hit a new low today at ~$82. Bitcoin has been weak, and Strategy's cash pile has dropped from $2.25B to around $1B .
Two problems hit at once: Below $100, Strategy stops selling new shares, so that funding source dries up. And the dividend still has to be paid in cash every couple of weeks no matter what. So they reached into the Bitcoin...
In late May, Saylor sold 32 BTC to cover obligations on $STRC. First bitcoin sale since 2022, and the first sign the system was being truly tested.
That sale is the spark... it told the market Strategy was tapping its bitcoin to make payments, confidence cracked, and buyers started demanding a higher yield to hold $STRC. The price slid, and the loop kicked in.
The loop summarized: Price drops, so they need a higher dividend payout to defend $100. A higher payout means more cash owed to investors. More cash owed means dipping into cash reserves or selling bitcoin. Selling bitcoin pushes its price down and erodes investor confidence in the entire structure. A lower bitcoin price pushes $STRC down again. The death spiral begins.
Each step makes the next one worse. That's why the market is watching $STRC so closely right now.
$MSTR $BTC
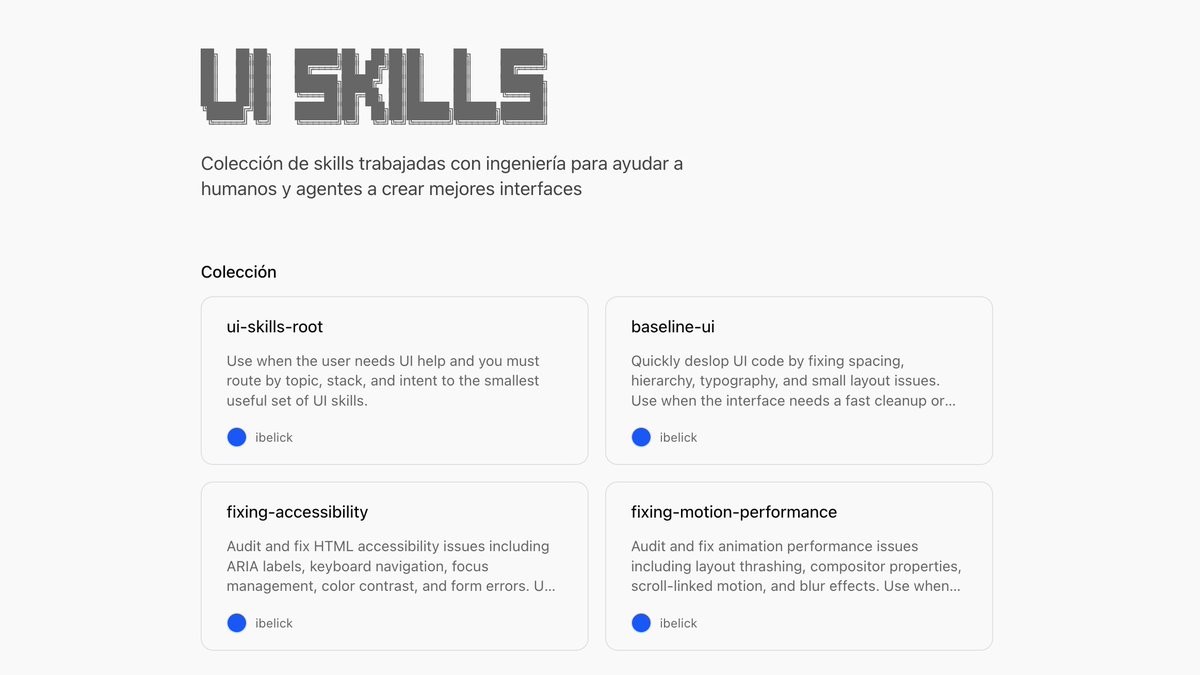
UI Skills es un directorio de skills para tu IA, para que deje de crear diseños genéricos y aburridos.
Seleccionados a mano y con animaciones:
→ https://t.co/eHY4XFWrcs
This model is insane at design.
I asked GLM 5.2 (left) and Opus 4.8 (right) to build me a landing page and you can't even tell the difference.
GLM cost $0.06 while opus cost $0.49. More than 6x cheaper while being faster + more token efficient.
Another win for open source AI.
Copper/Gold Ratio Chart
Copper is an industrial metal. Demand rises when economies are growing and building
Gold is a safe-haven asset. Demand rises during fear, uncertainty, and monetary stress
A rising ratio = copper outperforming gold = economic optimism, growth expectations
A falling ratio = gold outperforming copper = economic pessimism, risk-off sentiment
We Are Near All-Time Lows. Contrarians might watch this level as a potential long-term reversal zone for copper (and risk assets broadly)