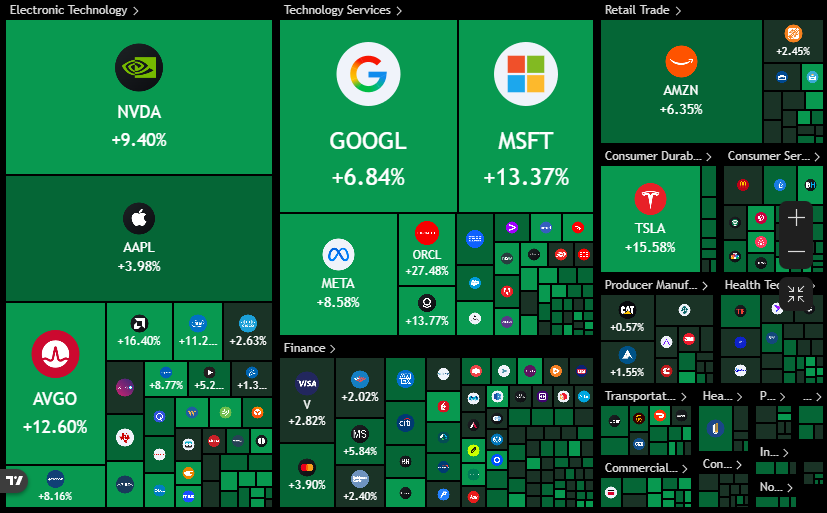
NVIDIA, $NVDA, EARNINGS SUMMARY:
1. Record quarterly revenue of $81.6 billion, above expectations
2. Q1 adjusted EPS of $1.87, above expectations
3. Q2 revenue guidance of $89.2 billion to $92.8 billion, above expectations
4. New $80 billion share buyback authorization
5. Increase in dividend from $0.01/share to $0.25/share
6. Total revenue growth of +1,035% over the last 3 years
Once again, Nvidia has crushed just about every expectation possible.
The AI Revolution is on fire.
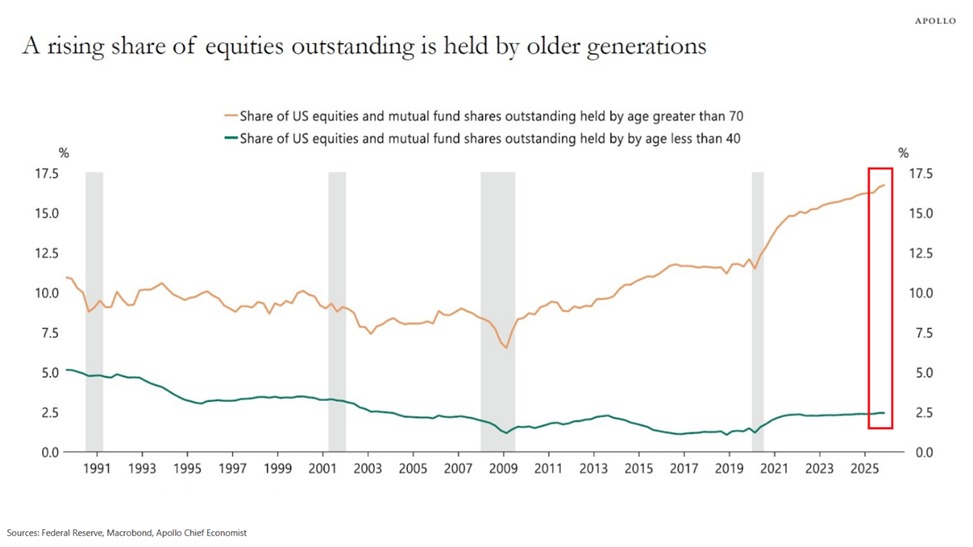
The gap between older and younger equity holders has never been wider:
Americans aged 70+ now hold a record 17% of all US equities and mutual fund shares outstanding.
The percentage has TRIPLED since the 2008 Financial Crisis low.
At the same time, Americans under 40 own just ~3%, in-line with 2003 levels.
This percentage is HALF of what it was in the late 1980s.
As a result, the difference between the two cohorts is now ~14 percentage points, the widest on record.
By comparison, the gap stood at ~6 percentage points at the start of the 1990s.
The wealth gap is widening.
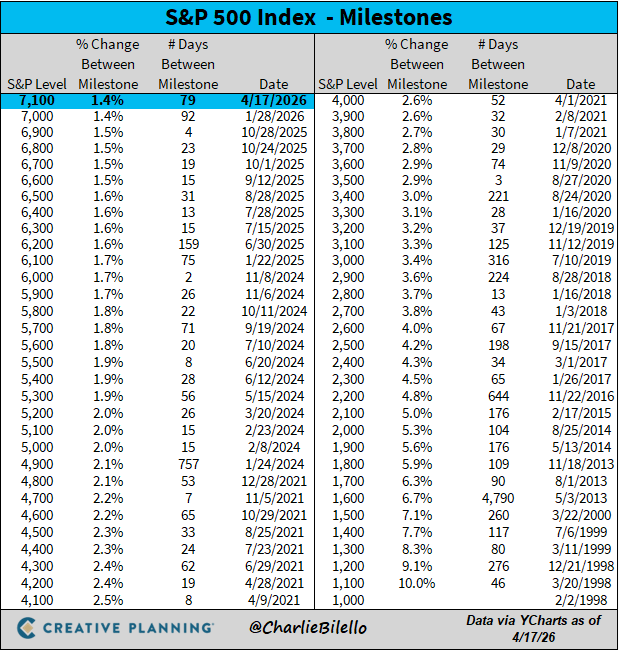
BREAKING: The S&P 500 closes at its highest level on record and officially posts its fastest recovery since 1982.
The S&P 500 has now added +$7.3 TRILLION since its low on March 30th.
The S&P 500 just crossed above 7,100 for the first time. A year ago it was at 5,300. 5 years ago it was at 4,200. 10 years ago it was at 2,100. $SPX
🚨 Cuando el S&P 500 marca máximos históricos en abril, el año acaba en positivo el 95% de las veces.
Ha ocurrido 21 veces desde 1950. En 20 de ellas, el índice cerró el año en verde.
📊 Rentabilidad media anual en esos casos: +18,3%.
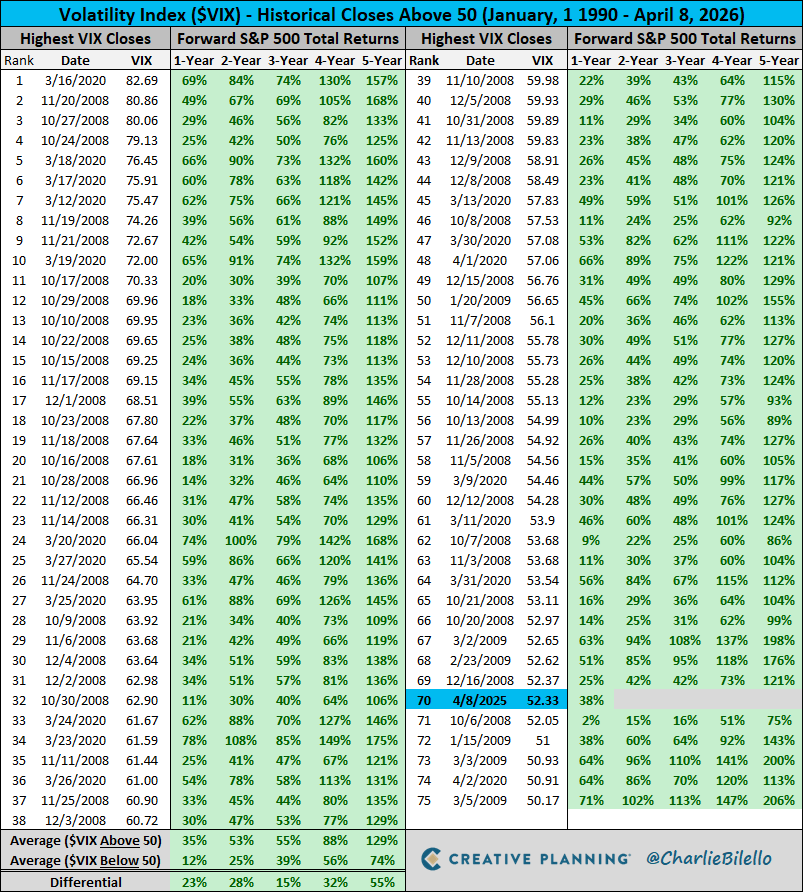
Update: one year ago today the $VIX closed above 50, a signal with a 100% win rate over the following year and an average S&P 500 return of 35%. The S&P 500 has gained 38% since then, adding to the list of times when it paid to be greedy when others were fearful. $SPX
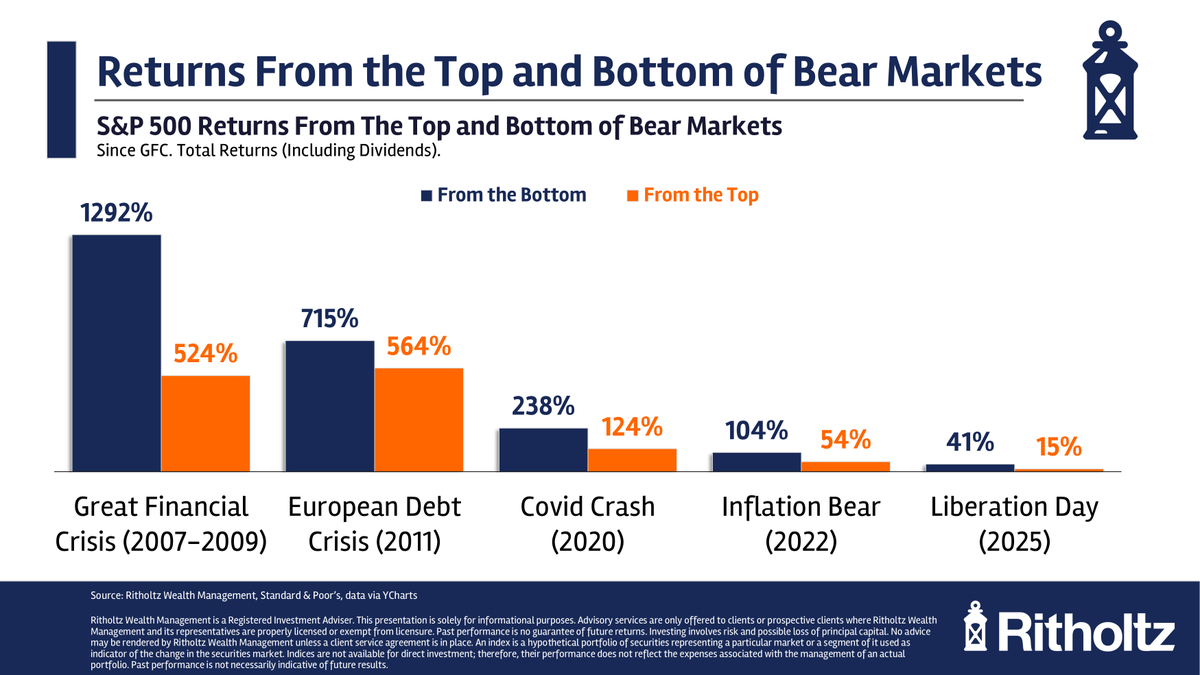
Every correction is different, but investor behavior doesn’t change.
Bad investors panic and sell.
Good investors get nervous but hold.
The Best investors get excited about potential opportunities.
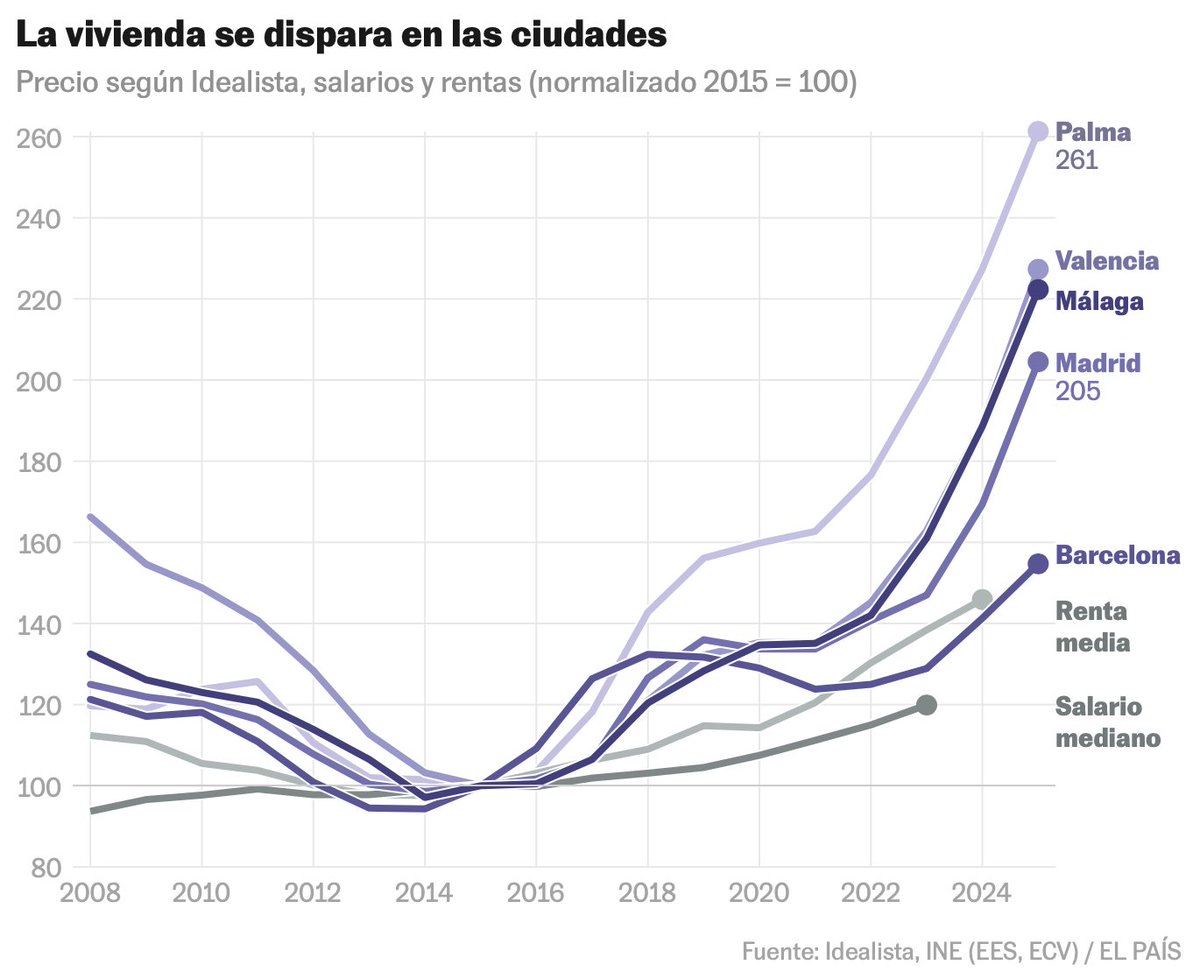
🏠 8. El precio disparado de la vivienda.
Salarios: +20% nominal entre 2015 y 2023.
Ingresos: +46% entre 2015 y 2024.
Casas: en Barcelona (+55%), el doble en Madrid (+105%), más en Málaga (+120%) y Valencia (+130%), y triple en Palma (+161%).
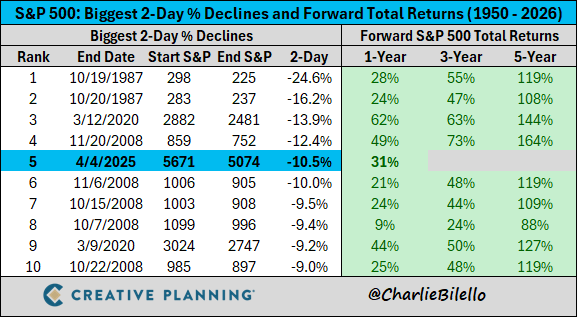
The S&P 500 gained 2.9% today, its biggest up day since last May (China tariff pause rally). Important for investors to remember: volatility cuts both ways and is not linear over time. Big down days and big up days often occur near each other. $SPX
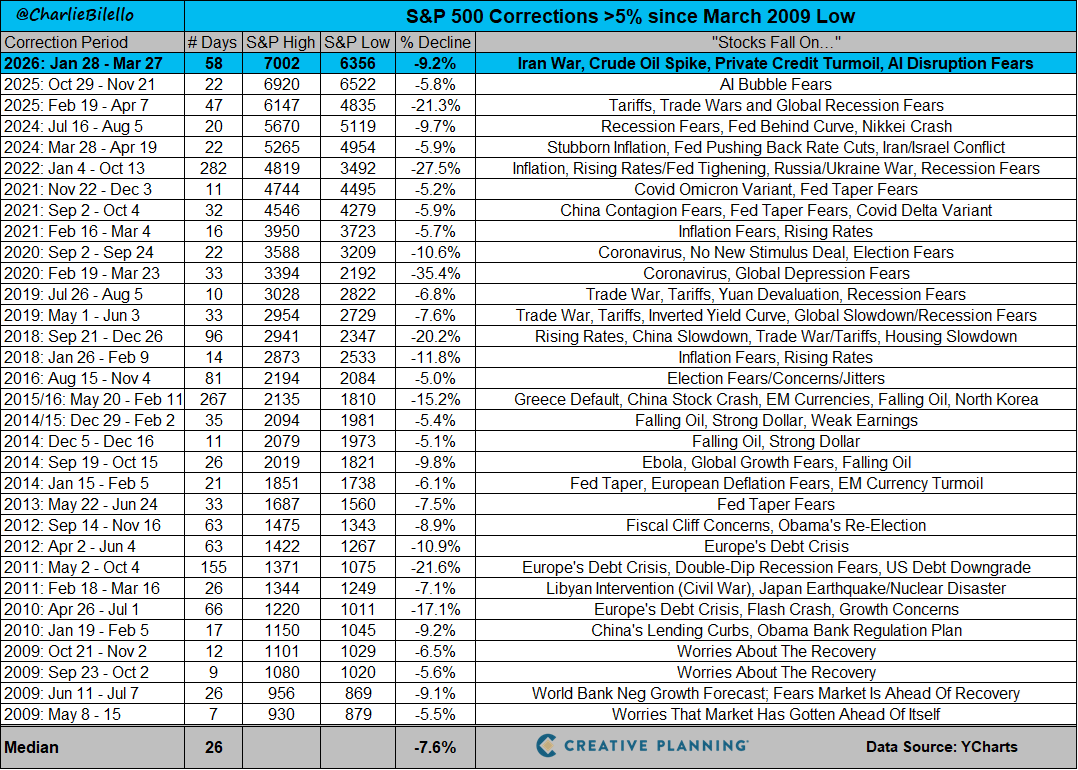
The S&P 500 is now down 9% from its January peak. This is the biggest correction since the tariff tantrum last April and the longest since the 2022 bear market. $SPX
A stunning 53% spread between the best and worst performing S&P 500 sectors so far this year:
-Energy $XLE: +41%
-Financials $XLF: -12%
This is what stagflation looks like...
📉 Desde 1955 el S&P 500 ha caído un 14% de media cada año. Y aun así ha cerrado en positivo el 73% de las veces.
📊 Frecuencia histórica de caídas desde 1955:
⚠️ Caída del 5% o más: cada 10,6 meses
🔴 Caída del 10% o más: cada 2,6 años
🔴 Caída del 15% o más: cada 5 años
🔴 Caída del 20% o más: cada 5,4 años
70 años de datos. 51 de esos años cerraron en positivo.
⚡ Lo que está pasando ahora no es una anomalía.
Es exactamente lo que lleva ocurriendo desde 1955. La geopolítica asusta, los titulares alarman, las carteras duelen. Y el mercado, con el tiempo, sigue su camino.
💡 La caída intraanual media es del -13,9%.
Estamos ahí. En territorio completamente normal según 70 años de historia.
El problema no es la caída. Es que cada vez que ocurre, parece la primera vez. Y eso lleva a tomar decisiones que el inversor paciente nunca tomaría.
🎯 Las correcciones no son el enemigo del inversor a largo plazo.
Son el precio de entrada por las rentabilidades futuras.
Siempre lo han sido.
Fuente: Capital Group / American Funds / S&P Dow Jones Indices
#QualityFinance #SP500 #Inversión #LargoPlazo #Mercados #PsicologíaDelInversor #Bolsa
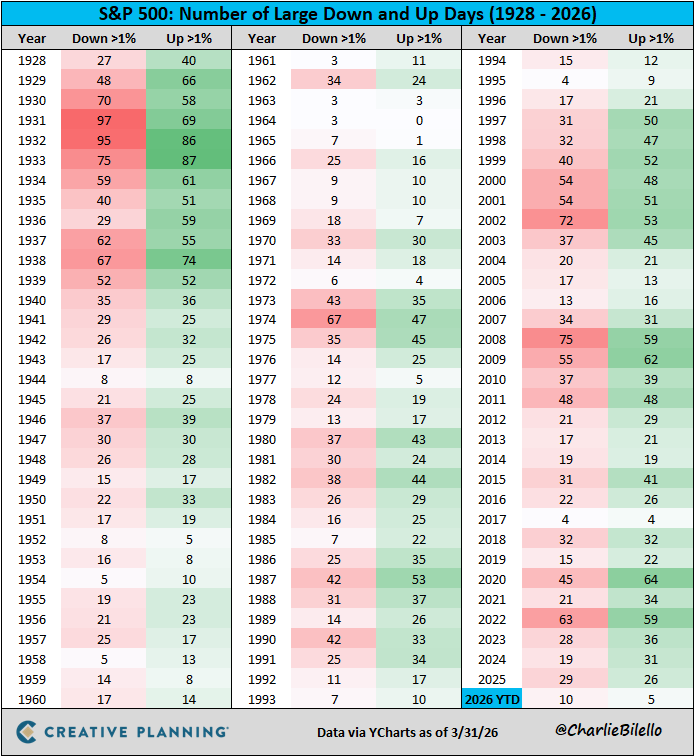
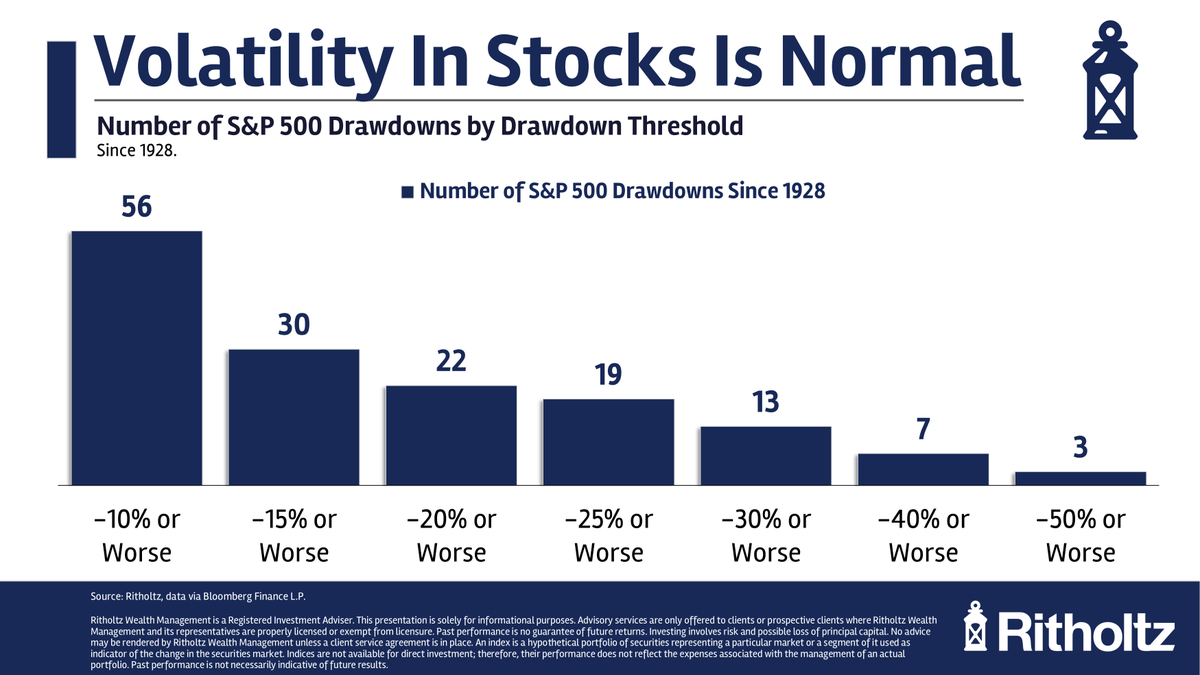
The S&P 500 fell 1.5% today, its 8th daily decline so far this year with a loss above 1%. Expect to see many more of these days in the coming weeks/months - the average year since 1928 has 29 large declines. This is the price of admission. $SPX
Video: https://t.co/Mc9NspX1s0
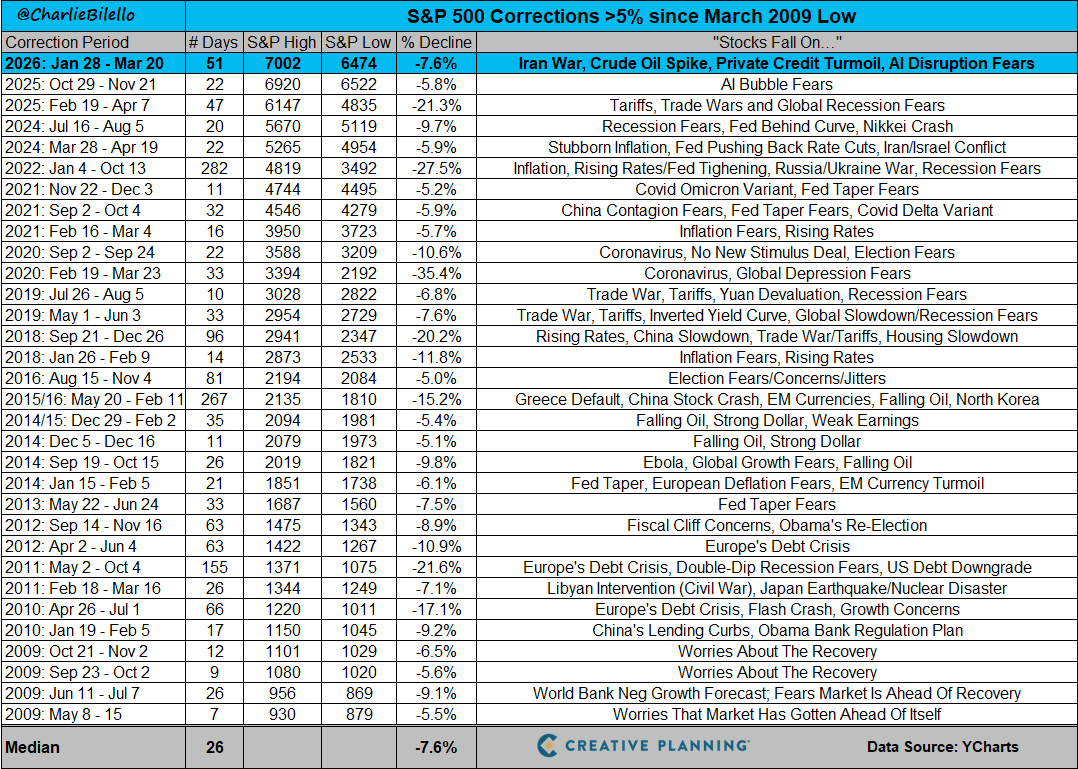
The S&P 500 is now down 7.6% from its January peak.
Is that a lot? Not at all.
This is right in line with the median correction off an all-time high since the March 2009 low.
We see a decline of this amount or more during most calendar years. That's the price of admission.
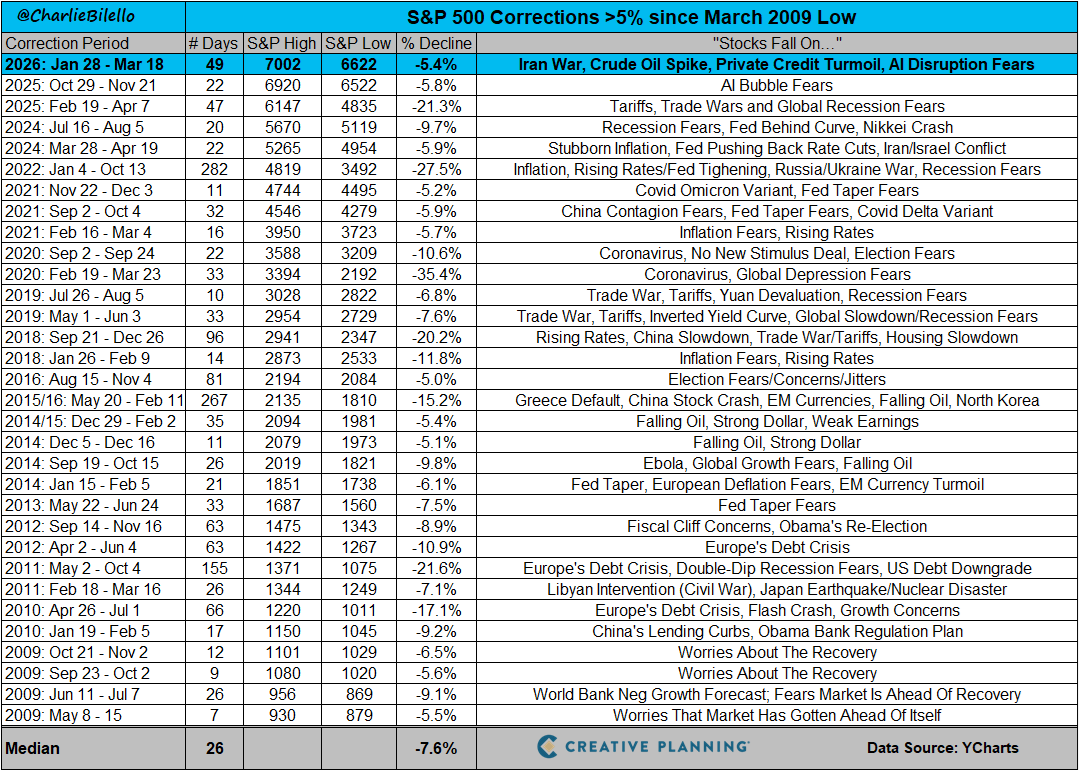
The S&P 500 ended the day at its lowest level since last November, down 5.4% from the January peak. This the 32nd correction >5% since the March 2009 low. $SPX
Video: https://t.co/kTI1OlpTdF