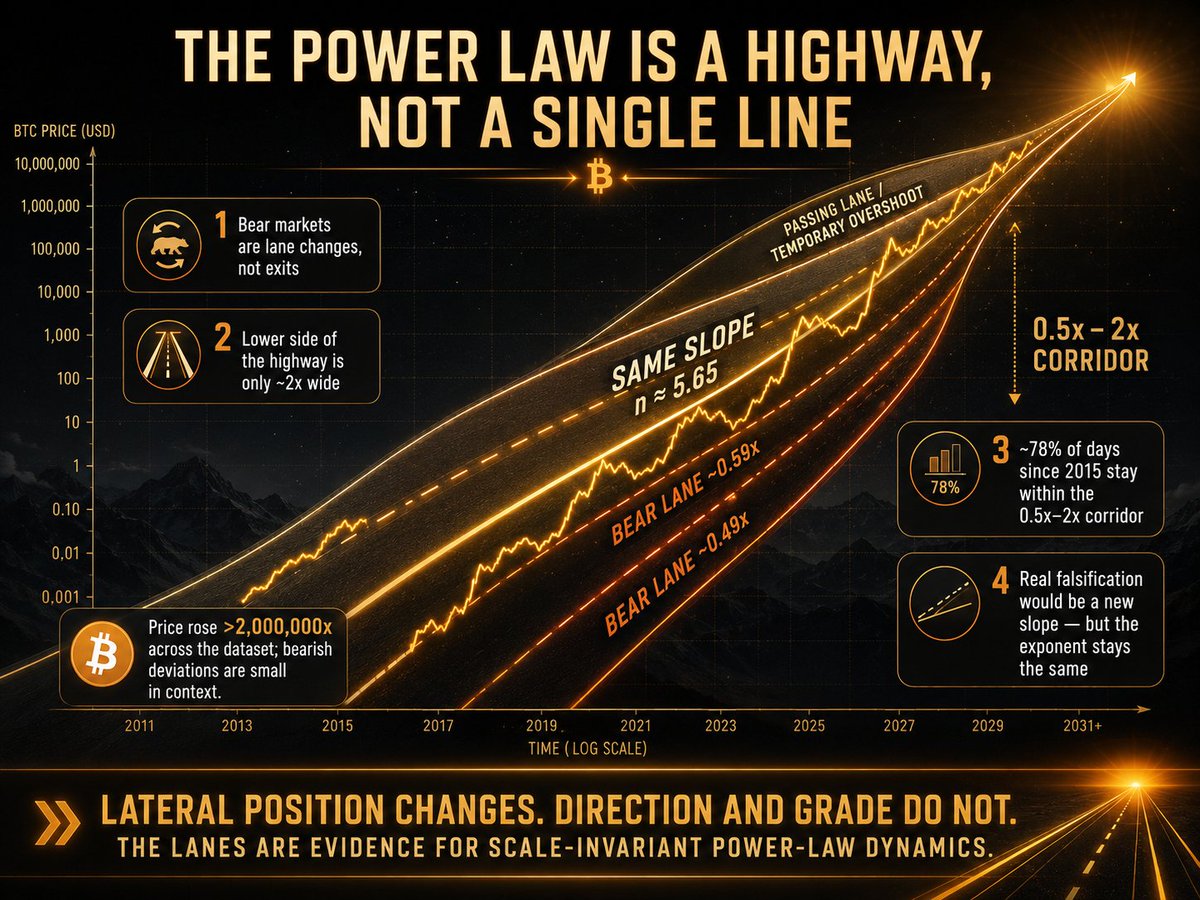
The gist: The power law should be read as a highway, not a single line. Deviations from the average path aren't violations of the model, because price doesn't drift randomly when it leaves the center — it settles into "lanes" that run parallel to the road, with the same slope (n ≈ 5.65).
The evidence:
Bear markets are lane changes, not exits: 2015–2017 ran at ~0.49× the fit and 2022–2024 at ~0.59×, both for over a year, both with locally measured exponents of 5.6–5.9 — identical to the road itself.
The bearish deviations are small in context: the entire lower side of the highway is only about a factor of 2 wide (worst single dip ~2.6× below, in August 2015), against a price that climbed over 2,000,000× across the dataset. About 78% of days since 2015 stay within the 0.5×–2× corridor.
Upside overshoots are bigger but temporary — a passing lane that always decays back, never a new road with a different slope.
The real falsification test would be the local exponent drifting to a new value, and it doesn't: the median slope is the same in every era (2014→2026) and at every measurement scale.
Bottom line: lateral position (the intercept) varies; the direction and grade of the road (the exponent) don't.
The lanes are evidence for scale-invariant power-law dynamics, not against them.
@ChartsBtc Interestingly, Bitcoin’s 4-year CAGR hit a record low of around 7–8%, roughly in line with the average M2 money supply growth over the past 10 years.
Metcalfe’s Law postulates the Value of a communications network goes as N*(N-1)/2 where N is the number of users.
In practice one sees something less than a square exponential due to internal geometry of the network with a few nodes much more important, more connections and holding more value, etc.
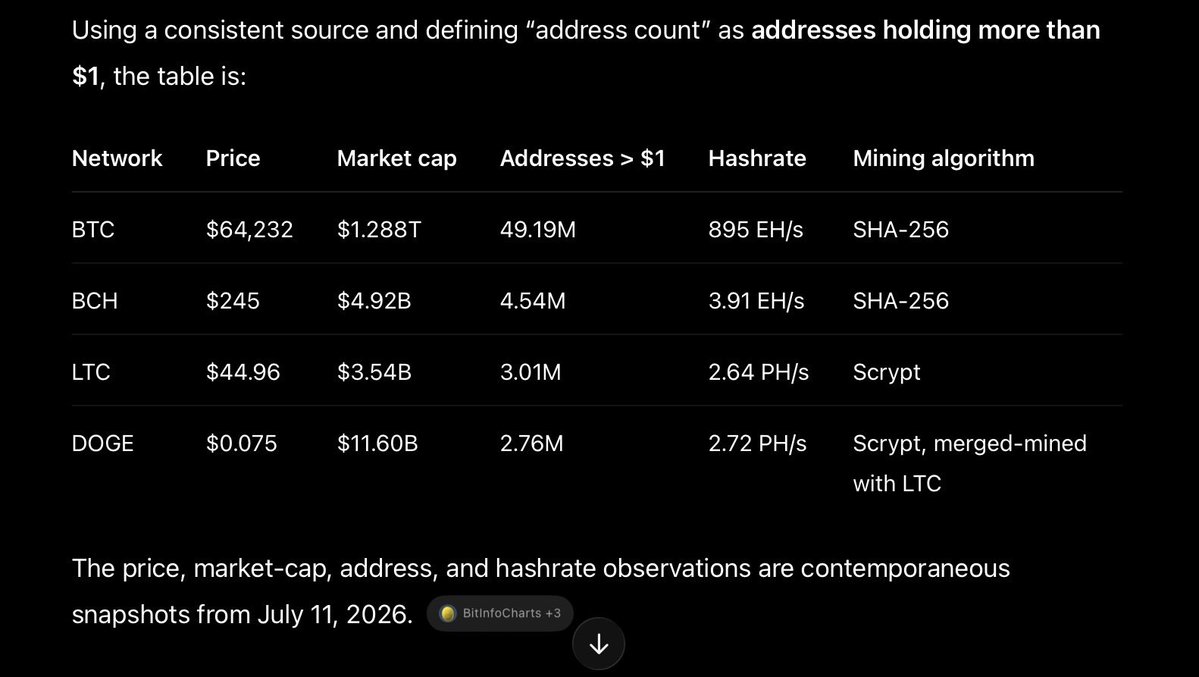
I fit a generalized Metcalfe’s law to the > $1 address counts and market cap for Bitcoin, Dogecoin, BCH, Litecoin.
ChatGPT gathered the data and I ran regressions with both Chat and Claude.
They agree on N^γ, γ = 1.93 and they both found R^2 = 0.92.
This is close to the 1.84 generalized Metcalfe exponent that the Santostasi and Perrenod (2026) paper found with a large data set for the Bitcoin network over its history, using non-zero addresses.
“Generalized Metcalfe fit: Market cap = A · N^γ, where N = addresses holding >$1
Result (log-log OLS, 4 points):
•γ ≈ 1.93 (network-value exponent — close to classic Metcalfe’s γ=2)
•A ≈ 1.51 × 10⁻³
•R² ≈ 0.92
So: MC ≈ 0.0015 · N^1.93”
Doge was the most overvalued of the four relative to the fit.
@SdcintificBTC
What Happens When a Power Law Learns to Flow?
For fifteen years, one number has quietly governed Bitcoin.
Plot price against time since the genesis block on log-log axes and the whole history collapses onto a straight line: price ∝ time^5.65.
We usually draw that line and stop there. But a line is a frozen thing, and Bitcoin is not frozen. So let's do what Kolmogorov did to Markov in 1931 — stop asking where the line sits, and watch the entire distribution move.
Change coordinates. Let x = log price and let the clock be τ = log t. In this frame the power law is no longer a curve; it is a constant-velocity drift. The cloud of every possible price — the probability law p — keeps a fixed width (the corridor) while its center glides upward at a constant speed. And that speed is the exponent itself.
So 5.65 is not a slope. It is a velocity — the rate at which probability streams up the corridor. Written as motion:
∂p/∂τ = −b·∂ₓp + D·∂²ₓp, with net current J = b·p.
The bright layer is that current. The fog is the evolving law. The particles are sample paths of the very same law. And the gold line is the real Bitcoin — one realized path, one draw from the fog, spiking and crashing but never leaving the channel the current carries it through.
How was the flow built? Not invented — measured.
From real daily prices, 2010 to 2026. The fit gives b ≈ 5.65. The jitter around the trend has heavy, Student-t tails (that's where the violent moves live), and its volatility decays like ~1/time — which is exactly what cancels the growth and holds the corridor's width constant in log-time. The animated paths are simulated from that fitted generator; the fog is its law; the arrows are J = b·p.
Here is why it matters for the theory. Bitcoin never relaxes to a fixed "fair price." The fog holds its shape while flowing, forever.
Physicists have a name for stable-and-moving-at-once: a nonequilibrium steady state. Detailed balance is broken; a permanent probability current flows. In that light the power law is not a lucky curve-fit — it is the signature of a steady current.
And the quantity I call the local slope, n = log(P₂/P₁)/log(t₂/t₁), is simply the pathwise velocity of that current: n = b + noise. Its distribution has stayed stationary for years.
That stationarity is the fingerprint of a constant flux — the macroscopic law and the microscopic wiggle turning out to be the same object.
One law. Two lenses. Microscopic paths and macroscopic flow — the Power Law is probability itself, moving.
For the 3 months April 6 to July 6, 2026, we increased our Bitcoin holdings 10% to 843,775 Bitcoin, increased our USD reserve 13% to $2.55B, and more than doubled YTD BTC Yield from 3.7% to 7.8%. $MSTR $BTC
https://t.co/3SqgyK5mwu