Google just released a free 1-hour AI engineering course.
How to build agents in 2026:
00:00 - Context engineering
10:00 - Building AI agents
31:52 - Agentic loops
43:22 - Building an MCP server
51:20 - Prompt engineering
59:10 - The future of AI development
Most people learn how to use AI.
This shows how to build the systems behind it.
Worth more than most $300 AI courses.
Bookmark and watch it today
Then read the article below
AI-generated code can look correct and still fail on edge cases, security, or reliability.
In this guide, @manishmshiva explains how to evaluate it with tests, golden datasets, repeated runs, and human review.
You’ll learn a practical workflow for catching regressions and shipping AI-assisted code with more confidence.
https://t.co/naw1ccruXS
Anthropic's Claude Certified Architect exam focuses on practical AI engineering, not just theory.
In this course, Andrew helps you prepare by building real-world agent workflows with Claude, MCP, and the Claude Agent SDK.
You'll learn about agent orchestration, tool design, prompt engineering, context management, and multi-agent architecture.
https://t.co/zA9wWu6puu
One of the biggest mistakes developers make is learning everything randomly
Instead,
pick one topic and go deep until you're comfortable building with it.
A roadmap that never disappoints:
• Learn the fundamentals.
• Build small projects.
• Read official documentation.
• Study production-ready open-source code.
• Watch conference talks from engineers who've built it at scale.
• Write about what you learn.
• Repeat.
Some of the best free resources:
• roadmap. sh
• ByteByteGo
• Microsoft Learn
• AWS Skill Builder
• Google Cloud Skills Boost
• System Design Primer (GitHub)
• Awesome Open Source (GitHub)
Depth beats breadth.
One skill mastered is worth more than ten half-learned ones.
Client-server communication involves more than just sending requests and receiving JSON responses.
In this handbook, @devseyi explains how HTTP, REST, WebSockets, GraphQL, gRPC, and Protocol Buffers work under the hood.
You’ll also learn about their tradeoffs and how to choose the right communication approach for your system.
https://t.co/rCe7kfBr2A
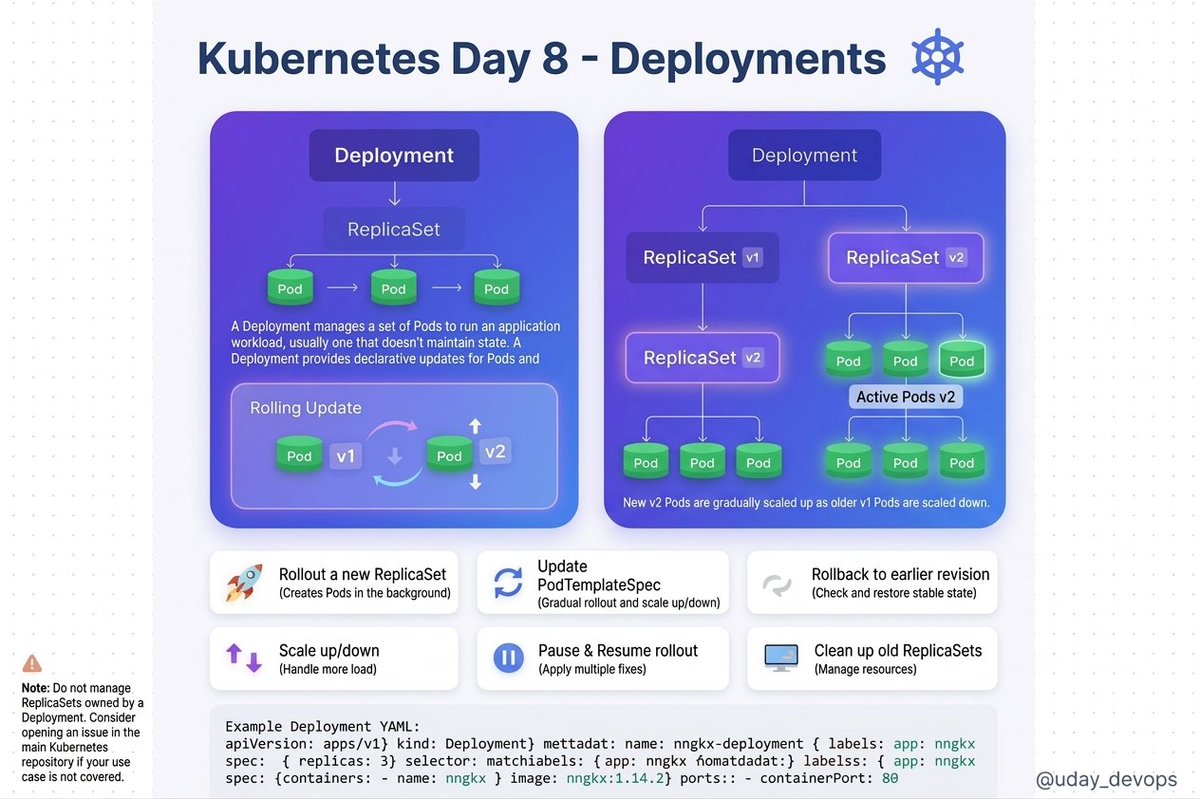
🚀 Kubernetes Day 8: Deployments
Kubernetes Deployments are used to manage and automate the lifecycle of containerized applications. Here's what they do:
Core purposes:
✔️Run & maintain pods - ensures a specified number of pod replicas are always running.
✔️Rolling updates - deploy new versions of your app with zero downtime.
✔️Rollbacks - instantly revert to a previous version if something breaks.
✔️Self-healing - automatically restarts crashed or unresponsive containers.
✔️Scaling - scale your app up or down with a single command.
This article explains how to build cost-efficient microservices on AKS by classifying state as irreplaceable or regenerable, using managed PostgreSQL for critical data while self-hosting Redis, RabbitMQ, and observability tools in Kubernetes
➜ https://t.co/4Kk6imvMcw
sk8r is a modern open source Kubernetes dashboard built with Svelte and TypeScript that provides a user-friendly interface to visualize and manage cluster resources, stream pod logs in real time, and monitor metrics through Prometheus integration
➤ https://t.co/GbifN8NFUt
Container crashes are easy to miss until they've already been failing for hours.
In this tutorial, Balajee shows you how to build an AI agent that monitors Docker containers, reads logs, diagnoses errors with Claude, and applies safe auto-fixes.
You'll also learn how to add Slack alerts, rate limiting, a health endpoint, and guardrails so you can run it more safely in production.
https://t.co/5sh8QwIyQe
This tutorial teaches how to implement production-grade health monitoring in Kubernetes using liveness, readiness, and startup probes with lifecycle hooks for self-healing systems
➤ https://t.co/rQfZqlAtPS
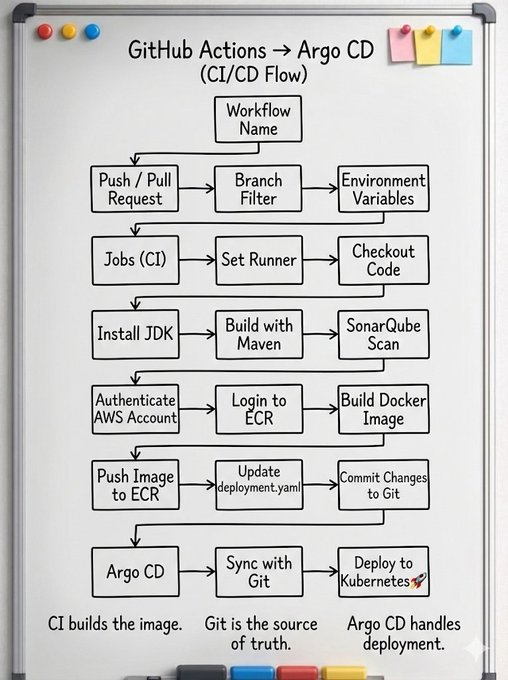
HOW TO IMPLEMENT GITOPS ON KUBERNETES USING ARGO CD
You define your Kubernetes manifests (YAML files) and store them in a Git repository as the single source of truth.
Argo CD continuously monitors this repository and ensures your Kubernetes cluster matches the desired state defined in Git. (Argo CD)
To implement GitOps:
→ Install Argo CD in your Kubernetes cluster by creating a namespace and applying the installation manifests. (Codefresh)
→ Access the Argo CD API server using port-forwarding, LoadBalancer, or Ingress to interact with the UI or CLI. (Argo CD)
→ Log in to Argo CD using the CLI or web interface with the initial admin credentials stored in a Kubernetes secret. (Argo CD)
→ Connect your Git repository containing Kubernetes manifests (Helm, Kustomize, or plain YAML).
→ Create an Argo CD Application that points to your Git repo, branch, and target cluster/namespace.
→ Enable auto-sync so Argo CD continuously pulls changes from Git and applies them to the cluster. (Codefresh)
At runtime:
→ Argo CD compares the live cluster state with the desired state in Git (declarative model).
→ If differences (drift) are detected, it automatically syncs and updates the cluster.
→ Rollbacks are simple , revert a commit in Git and Argo CD restores the previous state. (Medium)
→ The system follows a pull-based model where the cluster fetches updates instead of external systems pushing changes. (Devtron)
The result: Kubernetes deployments become automated, version-controlled, auditable, and consistent ,with Git acting as the single source of truth and Argo CD ensuring continuous synchronization.
→ Want to master Kubernetes and GitOps in depth? Check out this ebook:
Kubernetes: The Complete Handbook
https://t.co/98CfS3B9HB
Secrets management in GitOps finally has a clear path forward 🔐
Kostis Kapelonis is breaking down the new Argo CD 3.x recommendation for handling secrets in Kubernetes — and comparing all the popular solutions: sealed-secrets, SOPS, External Secrets Operator, CSI drivers, and more.
"GitOps and Secrets: State of the Union" — happening now at #KubeConEU in G102-103.
🔍 What is Observability?
Most people think it’s just monitoring.
It’s not.
Observability = knowing what’s happening inside your system without guessing.
It answers 3 simple questions:
1. What is happening?
2. Why is it happening?
3. How is it happening?
1. Metrics:
→ What’s happening
(CPU, memory, latency, traffic)
2. Logs
→ Why it happened
(Errors, events, debug info)
3. Traces
→ How it happened
(Request flow across services)
Metrics = What
Logs = Why
Traces = How
If you don’t have observability,
you’re just guessing in production.
KubeDiagrams is a tool that automatically generates visual architecture diagrams from Kubernetes manifests, Helm charts, and live clusters
It supports 47+ resource types, customizable clustering by namespace and labels, and can handle custom resources
➜ https://t.co/GDPGOk8IBd
If you've worked with Kubernetes long enough, you've stared at a pod stuck in Pending and wondered what went wrong. It's a common issue, but it isn't always clear how to proceed. Seeing a good approach to diagnosing these makes all the difference between guessing and actually fixing the problem quickly.
The article below describes the usual suspects: insufficient resources, node selector mismatches, PVC binding failures, taints, and resource quotas. Each one gets a practical breakdown with kubectl commands you can run right away, plus real-world scenarios that map closely to what you'd actually encounter.
Ben Riemer has put together a good reference that works well as both a learning resource and guide. Check it out if you spend any amount of time #troubleshooting #Kubernetes scheduling issues or want to get ahead of it before these problems happen to you.
https://t.co/Q7qOy1pyF5
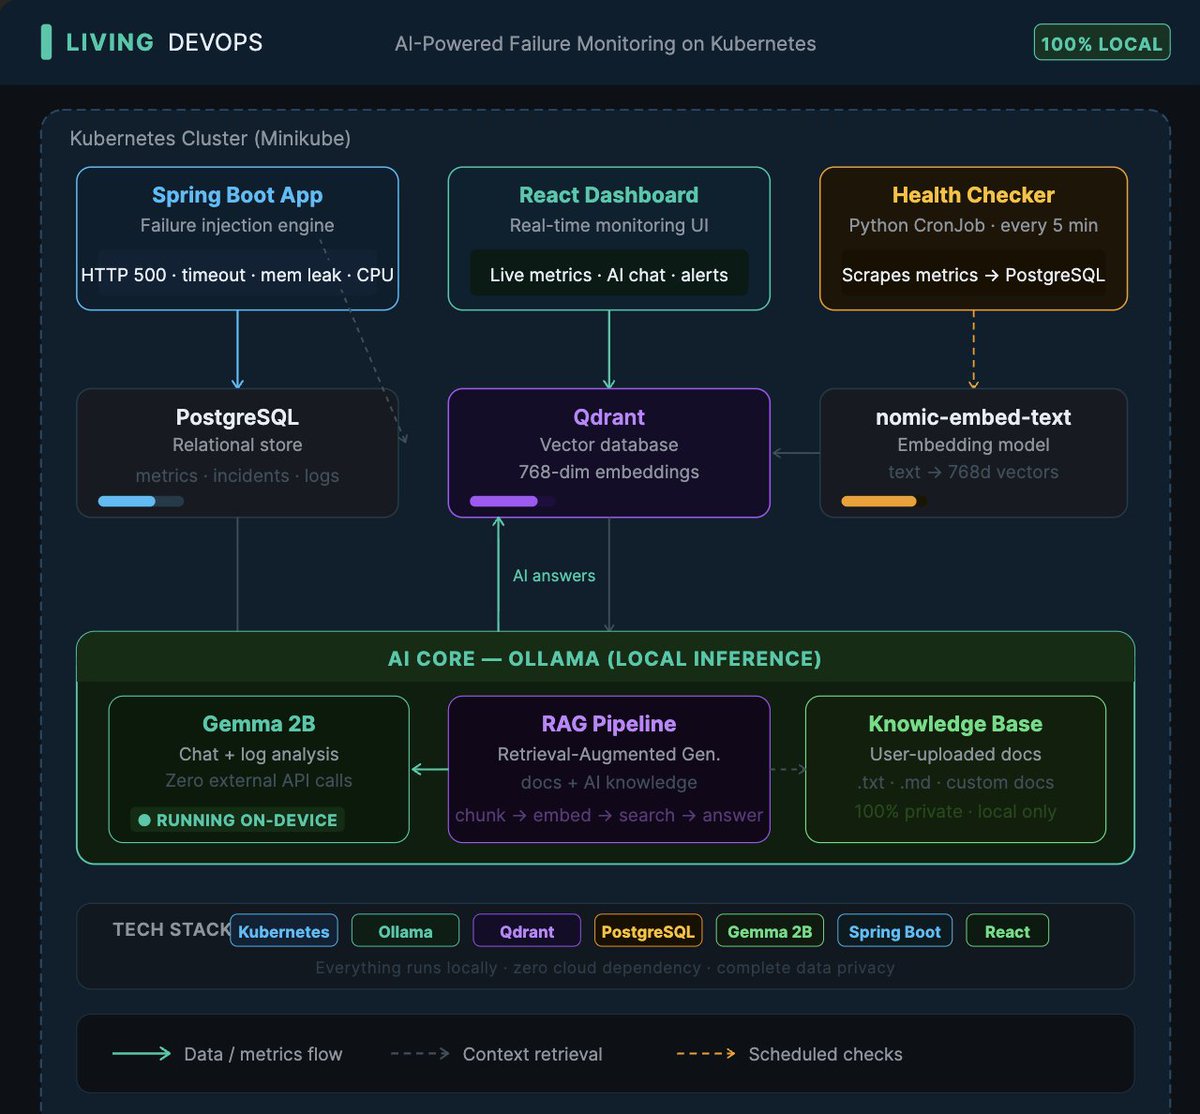
Today in my DevOps bootcamp, we built a complete AI-powered failure monitoring system on Kubernetes!
We Built:
- Spring Boot app with controllable failure injection (HTTP 500s, timeouts, memory leaks, CPU spikes)
- Python-based health checker (CronJob running every 5 minutes)
- Local AI with Ollama + Gemma 2B for log analysis
- React dashboard for real-time monitoring
- Full RAG (Retrieval-Augmented Generation) system with Qdrant vector database
The AI chat can learn from documents you upload.
We built a complete knowledge base where you can:
- Upload documentation (.txt, .md files)
- Documents get chunked & converted to 768-dimensional vectors
- Semantic search retrieves relevant context
- AI answers using YOUR docs + general knowledge
100% local. 100% private. Zero external API calls.
Tech stack:
- Kubernetes (Minikube)
- PostgreSQL (relational data)
- Qdrant (vector database)
- Ollama (local AI inference)
- nomic-embed-text (embeddings)
- Gemma 2B (chat/analysis)
Everything runs in a local cluster.
All AI processing happens on your machine(MacBook Air).
Complete data privacy.
The RAG system intelligently combines uploaded documentation with the AI's general knowledge to provide context-aware answers about your infrastructure.
.
.
.
.
Learn real-world DevOps by building projects like these in my upcoming Devops Bootcamp
https://t.co/iCC7VHpz5r
These days, applications can get pretty complex - and this can cause compatibility issues across OSs/environments.
This is where Docker containers can help.
In this guide, @Oluwato25390240 explains how Docker works & walks you through containerizing a Node.js app.
https://t.co/n4xQMmwyP6
If you manage #Kubernetes resources with Terraform, you've probably hit the point where you need #Terraform to track something it didn't create. Importing existing manifests into state is a practical step that keeps you from tearing things down just to rebuild them the "right" way.
The example below walks through importing both kubernetes_manifest and kubectl_manifest resources with examples. It covers CRDs, operator-managed objects, and the specific syntax each resource type expects. Rafael Medeiros has provided some good guidance on working at the intersection of Terraform and Kubernetes.
https://t.co/cLc1BF1AHQ