Following Price Action. Ideas I present or talk about are ONLY my own, never meant to be an investment advice, please do your own Research and general DD.
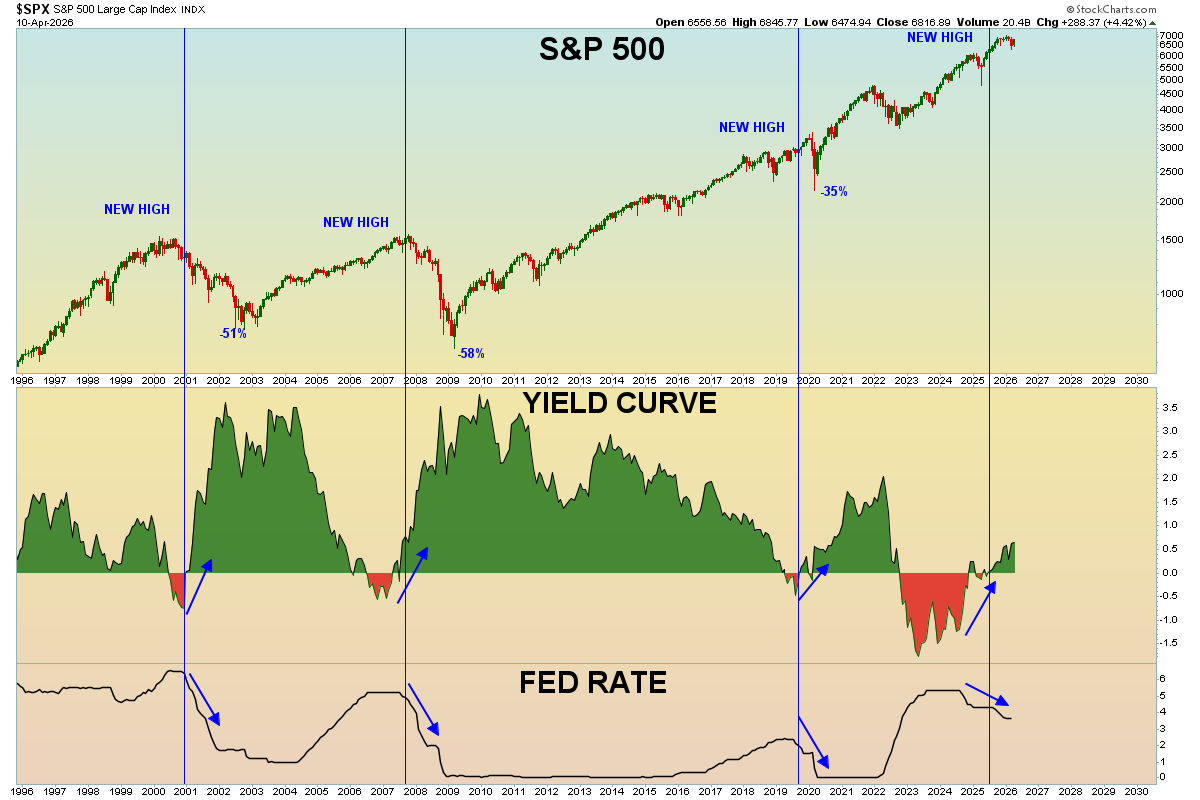
This might be the most important chart nobody is paying attention to right now.
S&P 500 on top, yield curve in the middle, Fed Funds rate on the bottom. Nearly 30 years of data.
Before every major decline over the last three decades, the same pattern played out. New all-time highs. The yield curve inverts and then un-inverts. The Fed starts cutting rates.
The Dot Com bubble. The Great Financial Crisis. The Pandemic.
Currently, S&P 500 is near all-time highs. Yield curve recently came out of an incredibly long and deep inversion. Fed cutting rates from the highest level since 2007.
I don't pretend to know what's going to happen. I just find interesting patterns in the market. As Mark Twain once said, history doesn't always repeat, but it often rhymes.
But if something bigger does play out, we're all going to look back at this chart and wonder how it was so obvious.
Then again… I know, I know. "This time is different." It always is, right?
JUST IN: Maine is about to become the first US state to ban new data centers.
And 10 other states are right behind it.
Maine wants to freeze massive construction projects until late 2027.
The bill passed the Democratic-controlled House (with Republican support). The Senate is expected to follow. Gov. Janet Mills backs it.
And right now, at least 10 states are advancing similar bans.
AI runs on electricity. MASSIVE amounts of it.
One large data center uses at least 20 megawatts of power. That's enough to light up 15,000+ homes.
And someone always pays for that power.
Right now? You do.
When data centers flood a state, power demand spikes. Utilities raise rates. Homeowners get the bill.
Data centers need land. They need water. They need MASSIVE amounts of electricity.
What happens next will affect AI development timelines.
The next 18 months will decide whether the AI energy problem gets solved or gets worse.
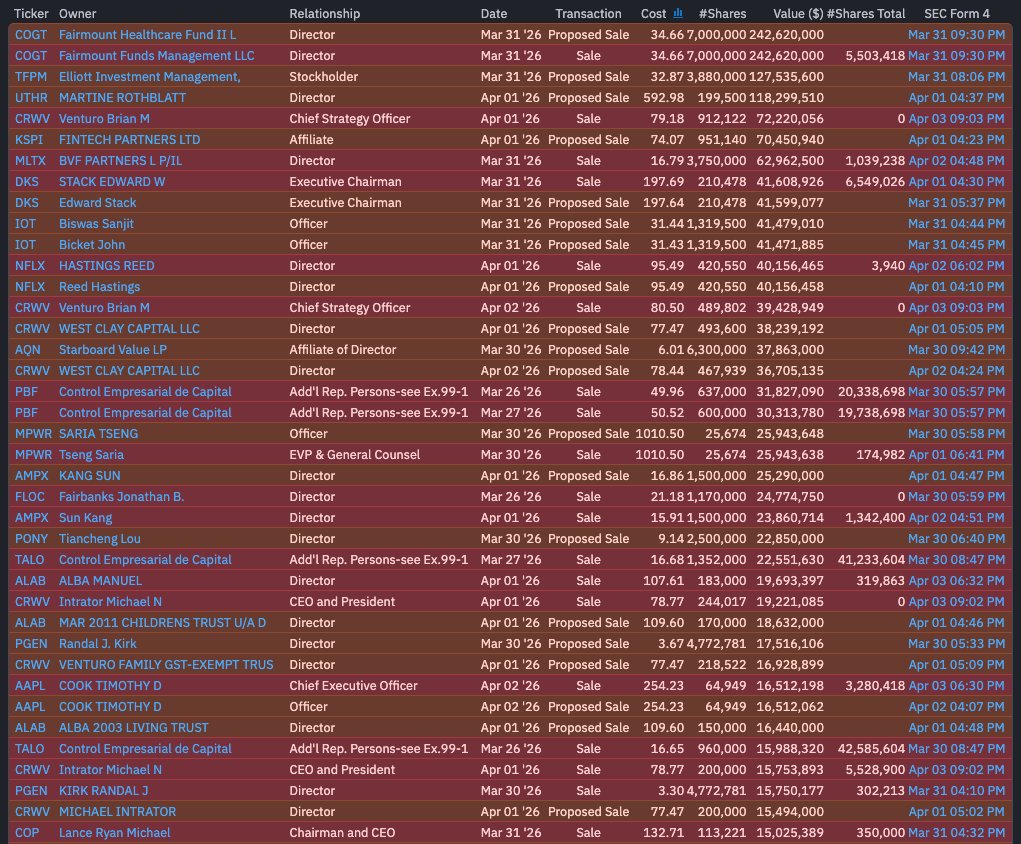
@CheddarFlow Just fake setup by institutions to fool people to buy back now, just that insiders and institutions large investors can sell and continue dumping their shares to the masses of retail sector. We have seen this scenario millions of times over the last over 100 years
🚨 BREAKING
INSIDERS JUST STARTED AGGRESSIVELY DUMPING ALL ASSETS AHEAD OF THE U.S. MARKET OPEN.
EVERY SINGLE INSIDER IS SELLING BILLIONS RIGHT NOW: 0 BUYS, 152 SELLS.
THIS IS NOT LOOKING GOOD FOR THE MARKETS...
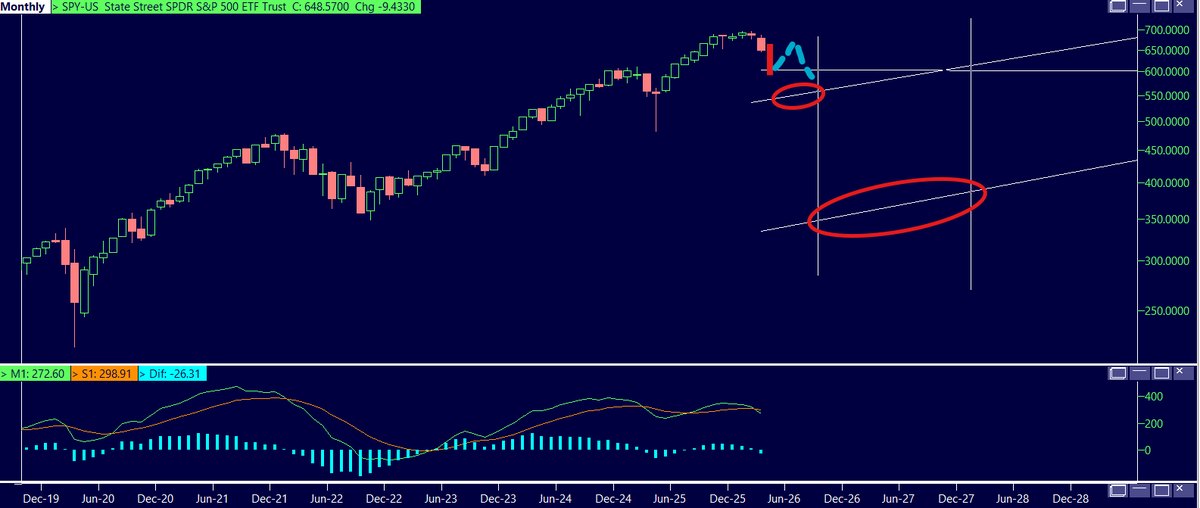
In my view, the S&P 500 is likely to remain pinned in the 650–655 range into March month‑end, supported by the heavy concentration of options open interest around 6475. A decisive break below that level (unlikely but still possible) would shift the risk toward a more disorderly move, potentially triggering circuit‑breaker, crash‑type dynamics. That is not my base case.
Once those options expire, I expect the next leg lower to develop, targeting the 580–600 area into mid‑April. After reaching roughly 600 in April, the market likely stages a reflexive rally back toward the highs (as shown by the dashed blue path).
If we see a monthly close below roughly 650, that would open the door to a move toward the first highlighted zone around 545–560 at any point into year‑end (regardless of reflexive rally to old highs).
Conversely, if the market can sustain monthly closes above 650, the current bull cycle remains viable -- onwards and upwards.
A monthly close materially below the 545–560 zone would signal risk of transitioning into a larger, structural bear market. That broader macro path will depend heavily on fiscal response to an economic contraction and the extent of a potential slowdown in loan growth. If both deteriorate meaningfully, the probability of a deeper structural bear market rises, with the potential for prices to ultimately fall by as much as 50% from peak levels. Given the current trajectory of key economic measures, such an outcome is entirely possible, but I do not have high conviction at this time in any specific scenario for 2027.
Remember: we deal in probabilities, not certainties. Conditions, not catalysts. Plumbing and flow, not narratives and memes.
Jensen Huang just called out every CEO who’s been firing people “because of AI.”
Jim Cramer asked him why companies are laying people off if AI is supposed to make everyone MORE productive.
Jensen's answer:
"For companies with imagination, you will do more with more. For companies where the leadership is just out of ideas, they have nothing else to do. They have no reason to imagine greater than they are. When they have more capability, they don't do more."
Read that again.
The man who built the most important tech company on Earth just told you that if your CEO is using AI to cut headcount, it means one thing:
They have no imagination.
They have no vision for what comes next.
They got handed the most powerful tool in human history and their FIRST instinct was to fire people.
This is the CEO of NVIDIA. The company whose chips power every AI system on the planet.
If anyone on Earth has the right to say "AI replaces workers," it's Jensen Huang.
And he said the OPPOSITE.
He said every carpenter could become an architect. Every plumber could become an architect. AI elevates capability. It doesn't eliminate it.
But here's where it gets really interesting...
During the same interview, Jensen revealed something nobody's talking about:
He said AI startups like OpenAI and Anthropic are seeing their revenues increase by one to two billion dollars a WEEK. And he wishes these companies were public so the world could see what he sees.
One to two billion per week.
That's a $50 to $100 BILLION annualized run rate.
For companies that most people think are burning cash and making nothing.
The entire Wall Street narrative that "AI companies aren't profitable" might be completely wrong.
Jensen sees their numbers. He sees their compute orders. He sees their growth. And he's saying the revenue is real.
So if the money IS real, why are other companies firing people?
Because they're not building AI products. They're not creating new revenue streams. They're not using AI to expand into new markets.
They're using AI as an EXCUSE to cut costs because they ran out of ideas 3 years ago and need something to tell the board.
Jensen's company added $500 billion in new orders in 5 months. He expects $1 trillion in cumulative revenue through 2027 from just two product lines.
That number doesn't include the new chips, systems, or partnerships announced this week.
And he's not cutting people. He's hiring.
Because when you have imagination, more capability means MORE opportunity. Not less headcount.
Meanwhile Salesforce cut thousands. Meta cut thousands. Amazon cut thousands. All blaming "AI efficiency."
Jensen's response: You're out of imagination.
He also said something that stuck with me.
Cramer asked if he ever thought he'd build a $10 to $20 trillion company while waiting tables at Denny's.
His answer: "I was just trying to make it through the shift."
Biggest tip he ever got? Two, three dollars.
Now he's building tech that increased computing demand by one million times in two years.
He announced OpenClaw, which he says is as big as ChatGPT.
And he's got 21 months of new business that isn't even counted in the trillion dollar figure yet.
When asked how long he plans to keep working?
"I'm hoping to die on the job. And I'm not hoping to die anytime soon."
This is a man who believes every single thing he's building.
And his message to every CEO using AI to justify layoffs is simple...
You're not innovating. You're surrendering.
The technology wasn't built to shrink companies.
It was built to make them limitless.
If your leadership can't see that, the problem isn't AI.
It's THEM.
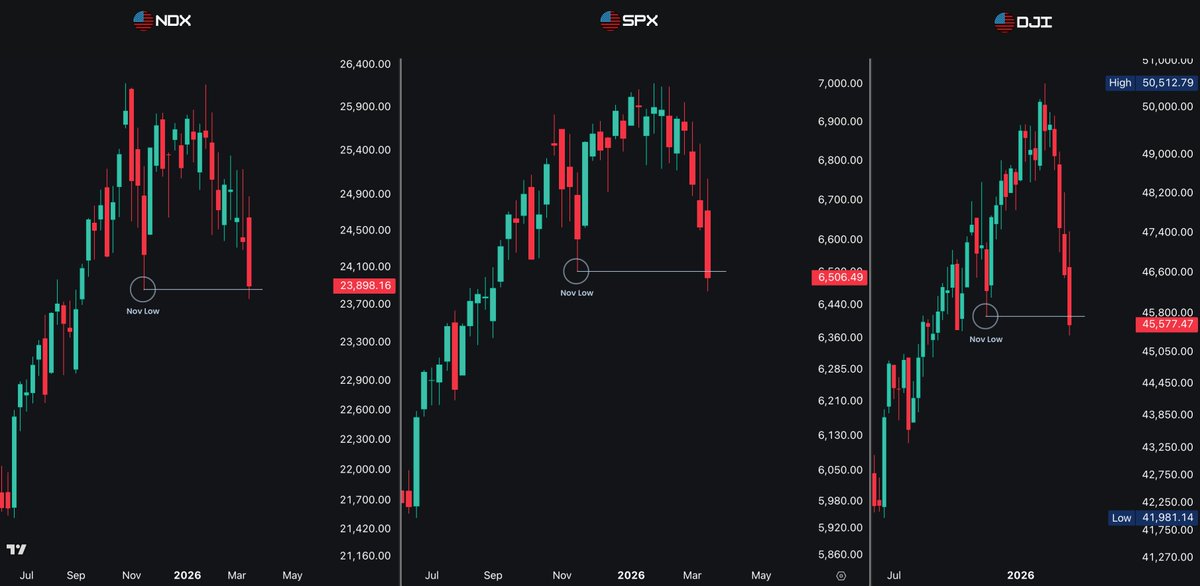
For a bounce, I needed to see at least one index hold the November lows while the others broke them.
That's an SMT divergence — it warns that momentum is fading and a reversal is setting up.
Instead, $NDX, $SPX, and $DJI all broke those lows together.
No divergence. No warning sign. FULL SYNC.
When correlated assets move together like this, it confirms the trend — not a reversal.
Bearish until a divergence develops.
Ryan highlighted the S&P 500 closing below its 200 day moving average after 214 days above it.
This breach typically prompts portfolio managers to trim growth exposure and shift toward defensive areas putting downward pressure on multiples for big tech and cyclical names while lifting relative performance in staples healthcare and utilities.
The same signal flashed in 2022 and ushered in a sharp correction phase before any lasting bottom formed. When that moving average flips it forces even the biggest bulls to respect the tape in a hurry.
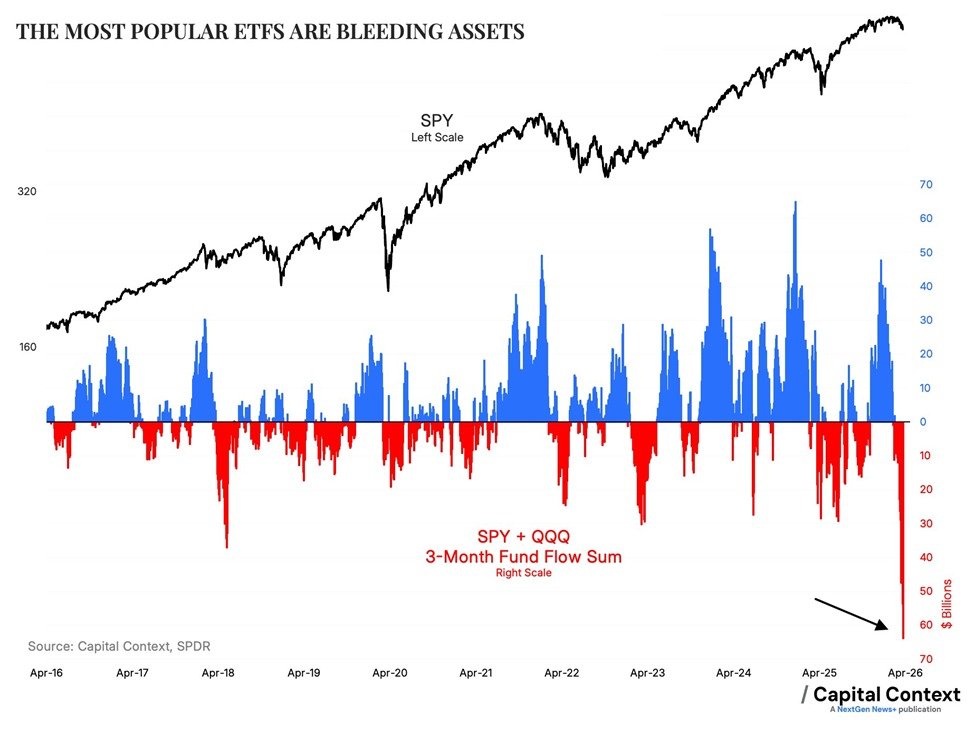
BREAKING: The S&P 500 ETF, $SPY, and the Nasdaq 100 ETF, $QQQ, have seen combined outflows of -$64 billion over the last 3 months, the most on record.
This marks a sharp reversal from +$50 billion in 3-month inflows posted in November.
This is also almost DOUBLE the previous decade high set in 2018.
Not even the 2020 pandemic and the March-April 2025 sell-off saw such significant outflows.
As a % of assets under management, the 3-month outflow is up to -5%, the biggest since Q1 2023.
By comparison, the largest percentage outflow over the last decade was -8% in April 2018.
Investors are have rushed to the sidelines.
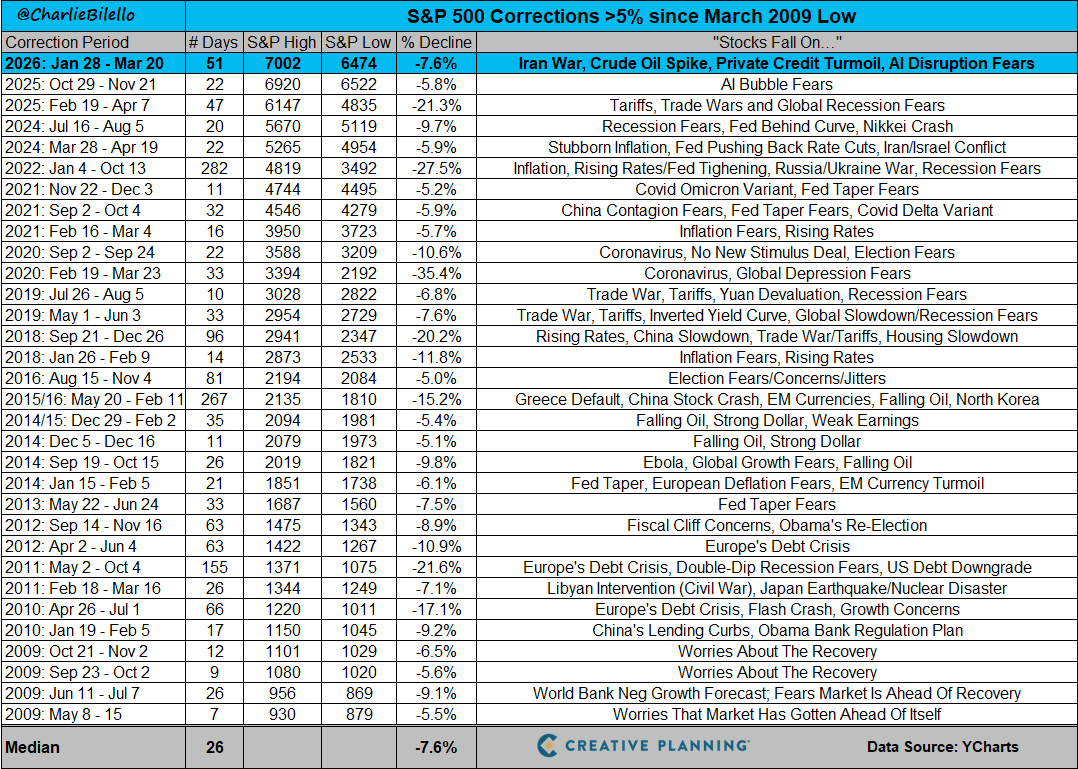
The S&P 500 is now down 7.6% from its January peak.
Is that a lot? Not at all.
This is right in line with the median correction off an all-time high since the March 2009 low.
We see a decline of this amount or more during most calendar years. That's the price of admission.
After 214 trading days, the S&P 500 closed beneath it's 200-day MA this week.
Since 1950, when the S&P 500 closes above this trendline the annualized return is 21.1%.
When it closes beneath? -22.2%.
Proving once again that bad things tend to happen beneath this trendline.
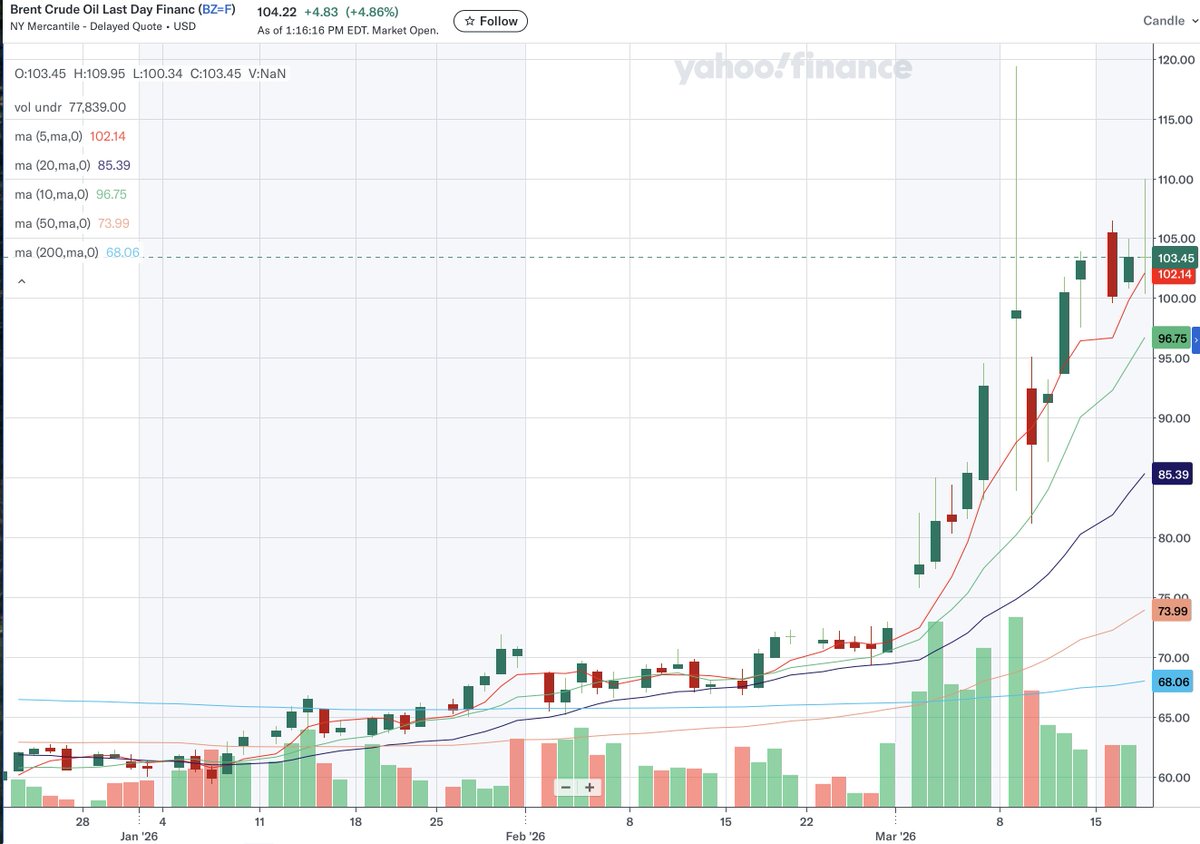
For those in the back . . . 🛢️⬇️
When oil stops going up the market will go up
When oil stops going up the market will go up
When oil stops going up the market will go up
When oil stops going up the market will go up
When oil stops going up the market will go up
When oil stops going up the market will go up
When oil stops going up the market will go up
When oil stops going up the market will go up
When oil stops going up the market will go up
When oil stops going up the market will go up
Retaliation attacks against Gulf States that are happening NOW will drive OIL prices up to the moon and crash the stock market. I don't see any other scenario here. 🤷
This chart has perfectly predicted the current Bitcoin bull trap.
It's the same pattern we saw in 2022, and $BTC will dump to $45,000 in a few weeks.
A lot of people are going to regret ignoring this chart.
Most traders will lose money this month because they ignored this signal.
The "Double Bear Cloud" on the weekly chart.
What it means in simple terms:
• Red cloud = stock prices going down
• 2 red cloud combo = slow, medium, or fast
What it means:
This isn't a dip. It's a reversal.
What to do:
1. Close bullish trades
2. Raise cash to 50%+
3. Don't buy the dip
4. Wait for green clouds to return
Your bias must flip with the market—or you'll get destroyed.
Are you watching the clouds?
Bulls dropped the ball.
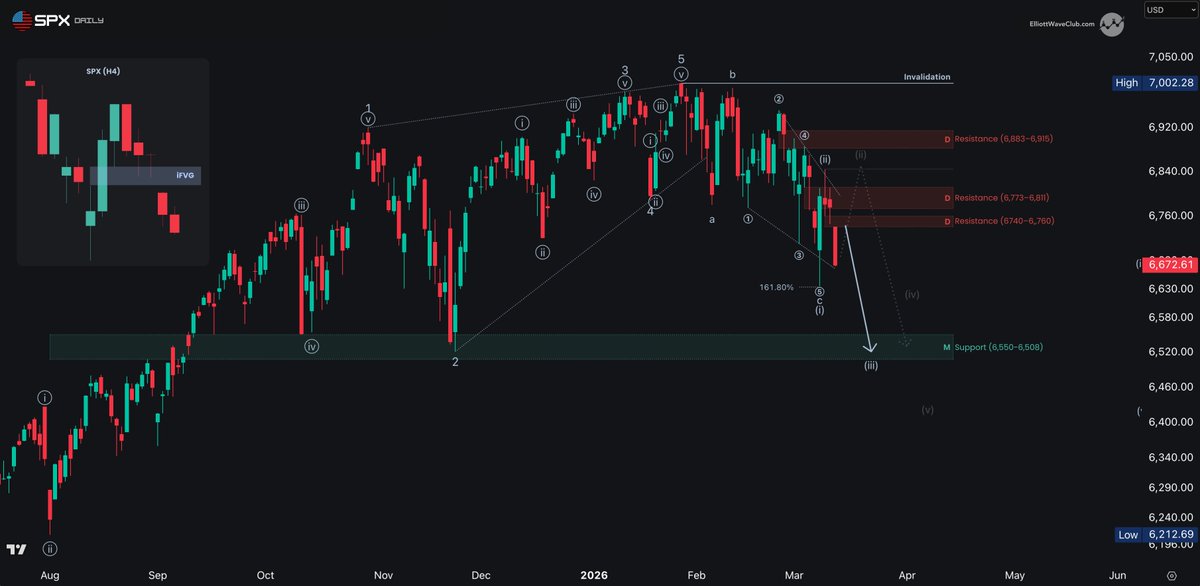
$SPX inverted its H4 FVG support and formed a new bearish Daily FVG at 6,740–6,760.
The 3rd wave decline is now PRIMARY.
A bounce into the Daily FVG that rejects? That's the trigger.
Targets: 6,550-6500
Only a Daily close above 6,760 changes the picture.
The window is closing.
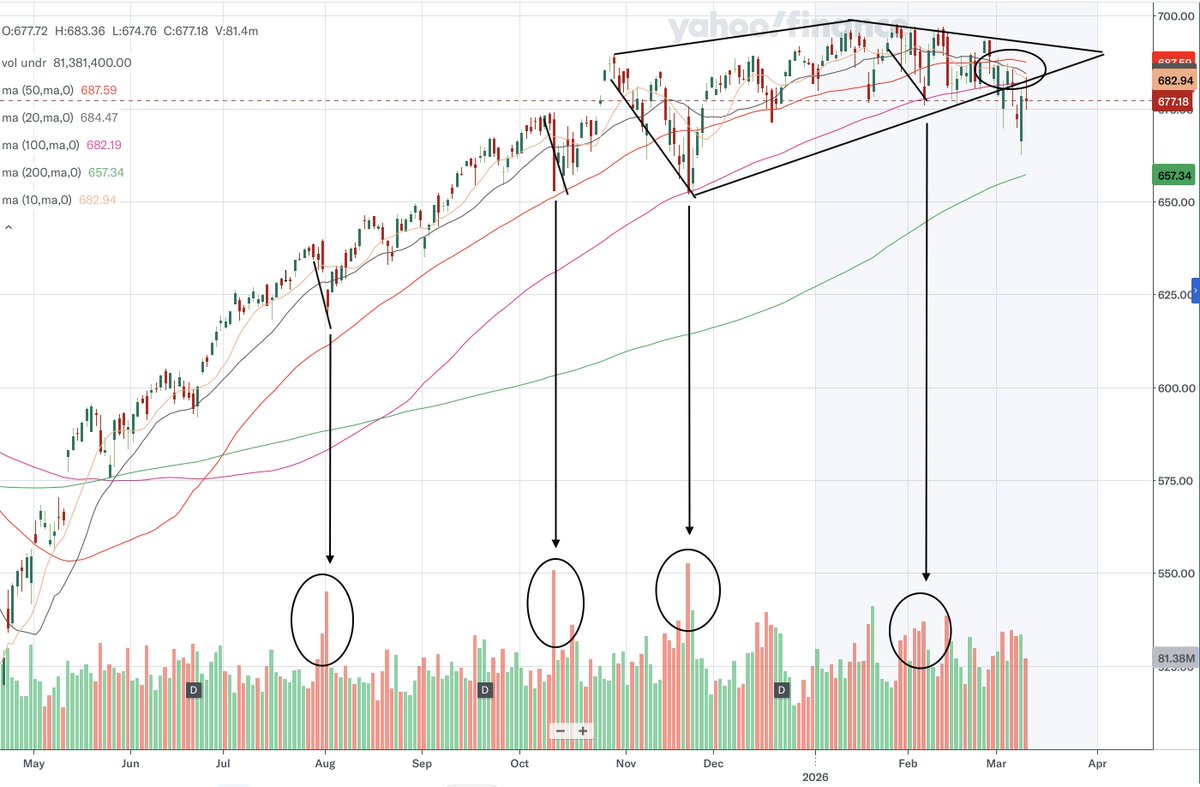
On Feb 27, I posted that the 20 / 50 dma cross has been a reliable bearish indicator in my toolbox for over 3 decades. (That was the day the cross occurred). Now both the 20 and 50 are downward sloping. That's a death cross. Good Night!