I've started working on a new side-project which I'm planning to build 'in the open'. In the past I've lost motivation for side-projects too quickly so I'm hoping this will give me some accountability.
@gorydev I don't think it ever completed using Promise.all! Think I maybe left it for an hour or so before it failed or I cancelled it. Too much at once for my laptop to handle. Using the batching did it in 15 mins. Let me know if you have any other questions! 👍
Built a little side-project a few weeks ago - while watching TV shows on catch-up, it lets you follow the hashtag and feeds you the tweets in real-time - so you avoid spoilers. Check it out https://t.co/kIyzzeg1aT #buildinpublic#webdev#ionic#Twitter
💡Chrome Dev Tools tip (#30!): You can copy an image as a data URI by opening it in the Sources panel, right-clicking it and choosing the 'Copy image as data URI' option. Easy! #chromedevtools#javascript
💡Chrome Dev Tools tips: If you're jumping around a JS file in the Sources tab, you can use ALT and - or + to move back and forward through your previous positions in the file. Really useful in long files! #chromedevtools#javascript
@_devtoolstips Note that the Network tab gets a yellow 'warning' icon when it's being throttled. Handy for avoiding hours trying to figure out why everything's loading slow! 😄
💡Chrome Dev Tools tip: You can simulate various hardware sensors by going to the Sensors section (3 dots -> More Tools -> Sensors). Great for testing! #chromedevtools#javascript
💡Chrome Dev Tools tip: You can enable code-folding in the code view, by clicking the cog in the top-right and checking the 'Code folding' box under the Sources heading. #chromedevtools#javascript
💡Chrome Dev Tools tip: See how an element is represented in the browser's accessibility tree by selecting the element in the Elements tab then opening the Accessibility sub-section. #a11y#chromedevtools#javascript
💡Chrome Dev Tools tip: You can check your colour contrast directly in the colour picker for a 'color' style rule. Click the swatch to see the AA and AAA contrast ratio pass/fail. The lines show you the minimum ratio for each standard. #a11y#devtools#javascript
💡Chrome Dev Tools tips: Select a network request and open the Initiator tab to see the stack trace that led to the request starting. #chromedevtools#javascript
When you've applied throttling a wee warning icon will appear beside the Network tab - that should stop you spending ages debugging why everything's running slow. Not that I've done that or anything.... 😆
💡Chrome Dev Tools tip: You can test how your sites perform on slower networks but throttling the connection in the Network Conditions tab. Choose a preset or set up your own throttle speed. #chromedevtools#javascript
💡Chrome Dev Tools tip: You can copy a network request as a 'fetch' or 'cURL' snippet by right-clicking it and sliding the Copy menu. You can then paste it elsewhere and run again. Very handy for debugging! #chromedevtools#javascript
💡Chrome Dev Tools Tip: Use console.count to output how many times a piece of code is executed. You can reset the counter with console.countReset. #devtools#javascript
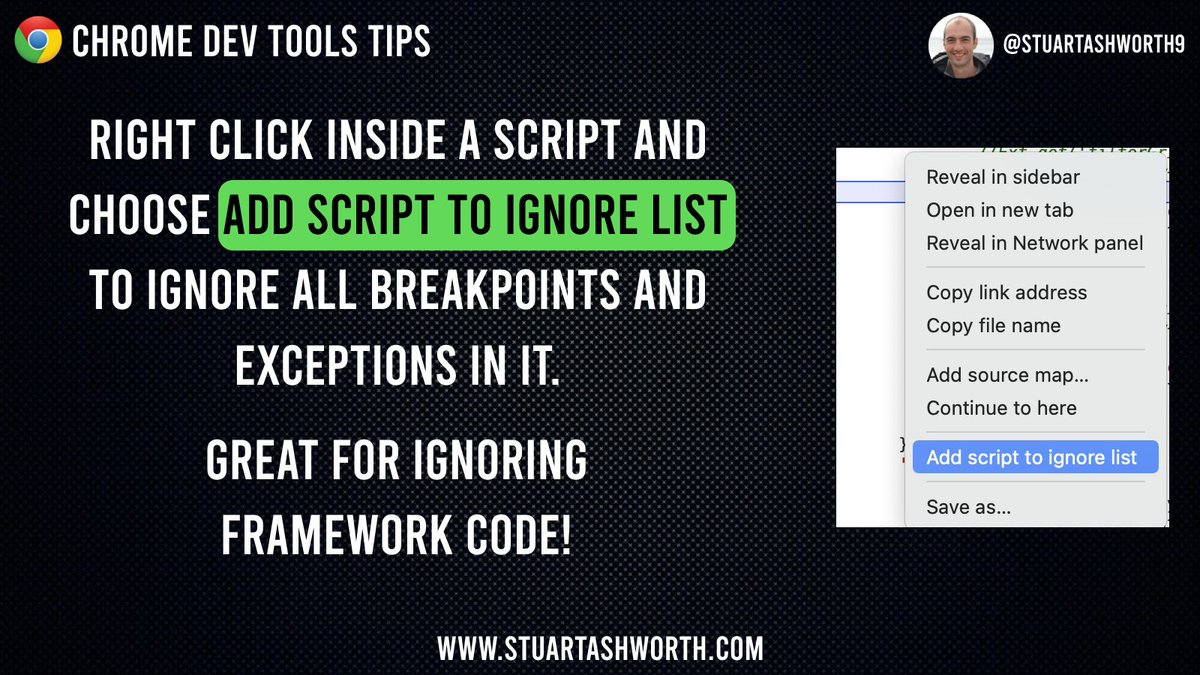
💡Chrome Dev Tools tip: Ignore all breakpoints and exceptions in a file by right-clicking in it when open in Sources and choose 'Add script to ignore list'. This is great for ignoring framework files. #chromedevtools#javascript#webdevelopment
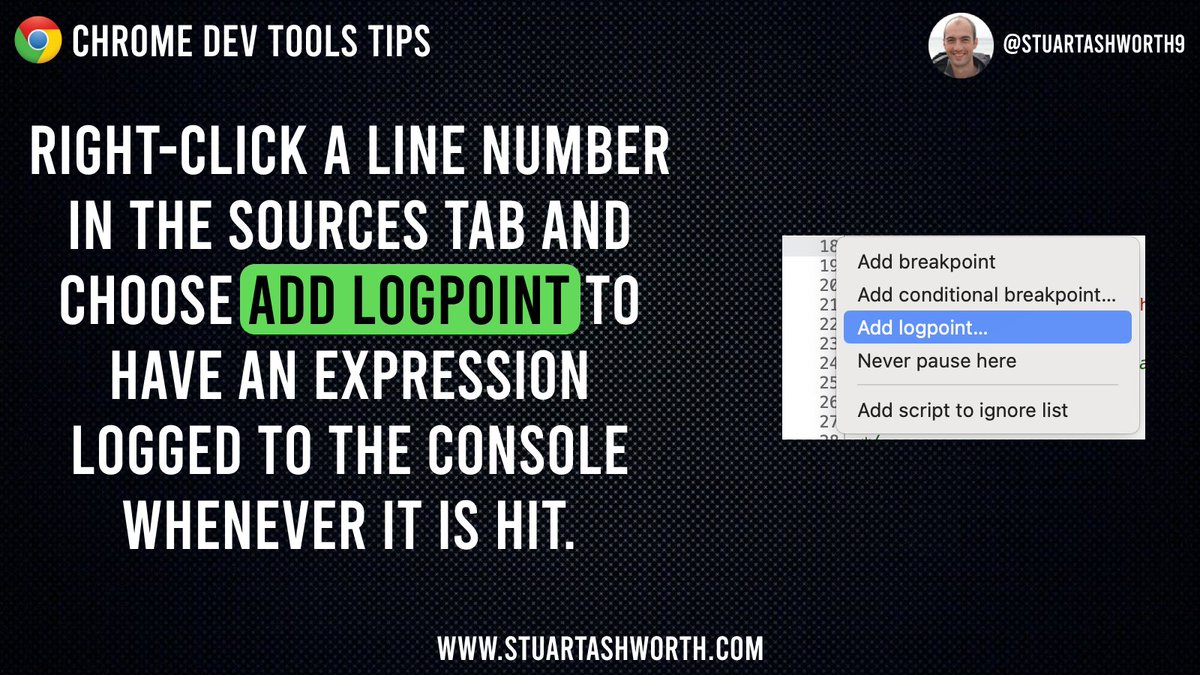
💡Chrome Dev Tools tip: Add a logpoint to have an expression logged to the console at a specific line of code to get insight into what's going on without adding console.logs explicitly. Right click a line number and click 'Add logpoint...' #devtools#javascript
💡Chrome Dev Tools tip: Click the eye in the Console tab to add a Live Expression. This will display the output of it and constantly update. Really useful alternative to using tons of console.logs #devtools#webdevelopment