Good morning!!!
The weekly price movement of $BTC is shown in red, with the week's high-probability setup located within the shaded area.
Core CPI data will be released on June 10th, followed by PPI on June 11th. These are high-profile news events.
There have also been discussions of a ceasefire, but nothing is clear and reliable enough to make trade judgments.
Hope you have a great week ahead and a happy morning!
$BTC short plan.
Time for some relief to 66k after weeks of trending down.
HTF trend stays bearish so lets see if we get a clean short setup in our short POI.
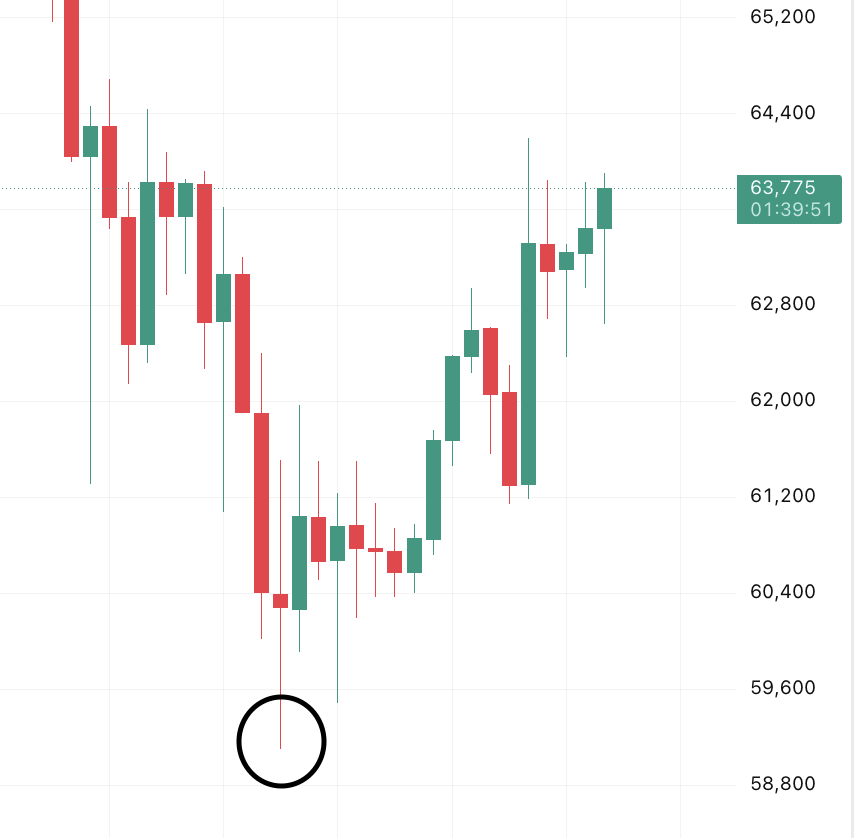
Bitcoin 1H setup:
Resistance: $63-64K.
Support: $61.5-62.2K.
Key level: $61,049.
Long scenario:
Bounce from support and reclaim resistance.
Target: $64,912.
Short scenario:
Close below $61,049 is short trigger.
Target: $59K.
One level decides.
$BTC Bullish Push Towards Resistance
Bitcoin showing strength, after leaving unfilled FVG's below.
This push towards 64k feels more like a buyside liquidity grab.
Doesn't make a ton of sense longing into resistance.
Recommend waiting a little longer before taking any trades.
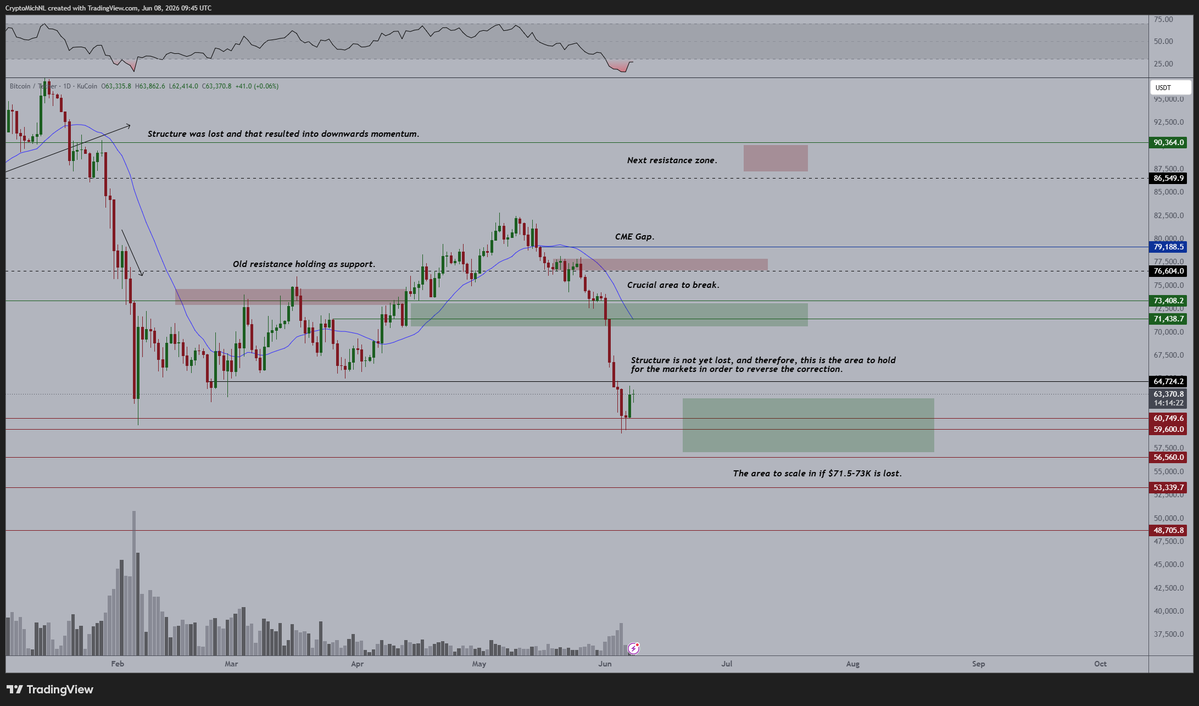
#Bitcoin acting at a higher timeframe support and it bounced upwards from the 200-Week MA.
Very likely that price doesn't cascade down today if indices are turning green, yields fall and $STRC doesn't continue to depeg.
Even better: If Michael Saylor has been buying, the entire thesis fades away.
Regardless of that, the crucial level to break is the $64,000-65,000 area.
If that breaks, there's nothing stopping Bitcoin from running all the way towards $71,500-73,000 and potentially even as high as the CME gap at $79,000.
It's an ideal area to accumulate positions.
#Bitcoin
Still a lot of time left until monthly close...
I think this close will be more important than any daily or weekly. If we close below yellow line we have a new lower low and then seems likely we'd fade lower.
If we wick and close above then likely more chop
A 700 $BTC sell wall sits at 64-64.2K.
Either it's baiting shorts or suppressing price because demand isn't strong enough to absorb it here.
If it gets absorbed, watch the reaction closely, we haven't seen a sell wall this large during the entire drop.
Total crypto market cap has a resistance line to break
It just made a sweep of the lows, bullish divergence on the 1W is loading
This is a rare signal
I will give you the signal for the breakout and it will be insane for the crypto market and altcoins
$BTC / $USD - Update
I remain long for now. Taking more profit at $64,800 - $65,000 as i expect a rejection to come in for the corrective wave to come.
Spot is still supporting $BTC move here.
Late shorts are also getting wiped out.
As long as spot demand stays, Bitcoin will continue its short-term uptrend.
$ETH has only done this once before in its entire history.
Back in June 2022, ETH broke through every support level and crashed to $880. Everyone gave up on it. That turned out to be the exact bottom of the whole bear market.
Now it's June 2026, the same month, same breakdown, and same chart structure.
ETH peaked at $4,953 in August 2025. Today it's at $1,593. That's a 68% crash in just 10 months.
Its weekly 200 MA sits at $2,471, and price has fallen straight through it. The next support level to watch is $1,500.
Two ways this plays out:
If ETH holds $1,500, this could play out exactly like June 2022. The people who bought that bottom made 5x over the next 18 months.
If ETH falls below $1,500 on a weekly close, the next support is all the way down near $1,000. Nothing to stop the fall in between.
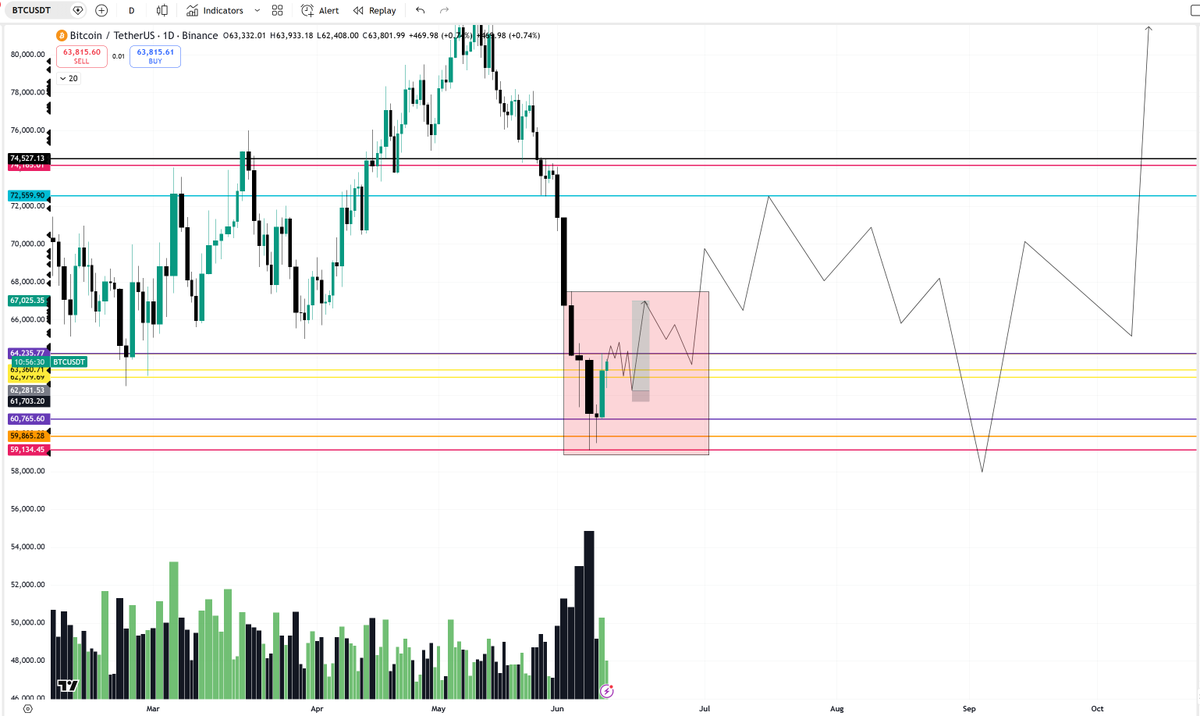
Bitcoin's roadmap for the next 12 months:
Q1 2026: initial drop ✅
Q2 2026: bull trap rally to $82K ✅
Q3 2026: final flush to $54K.
Q4 2026: recovery rally.
Q1 2027: new ATH loading.
Two quarters down.
Two quarters to go before the markup begins.
The bottom isn't here. But it's getting closer.