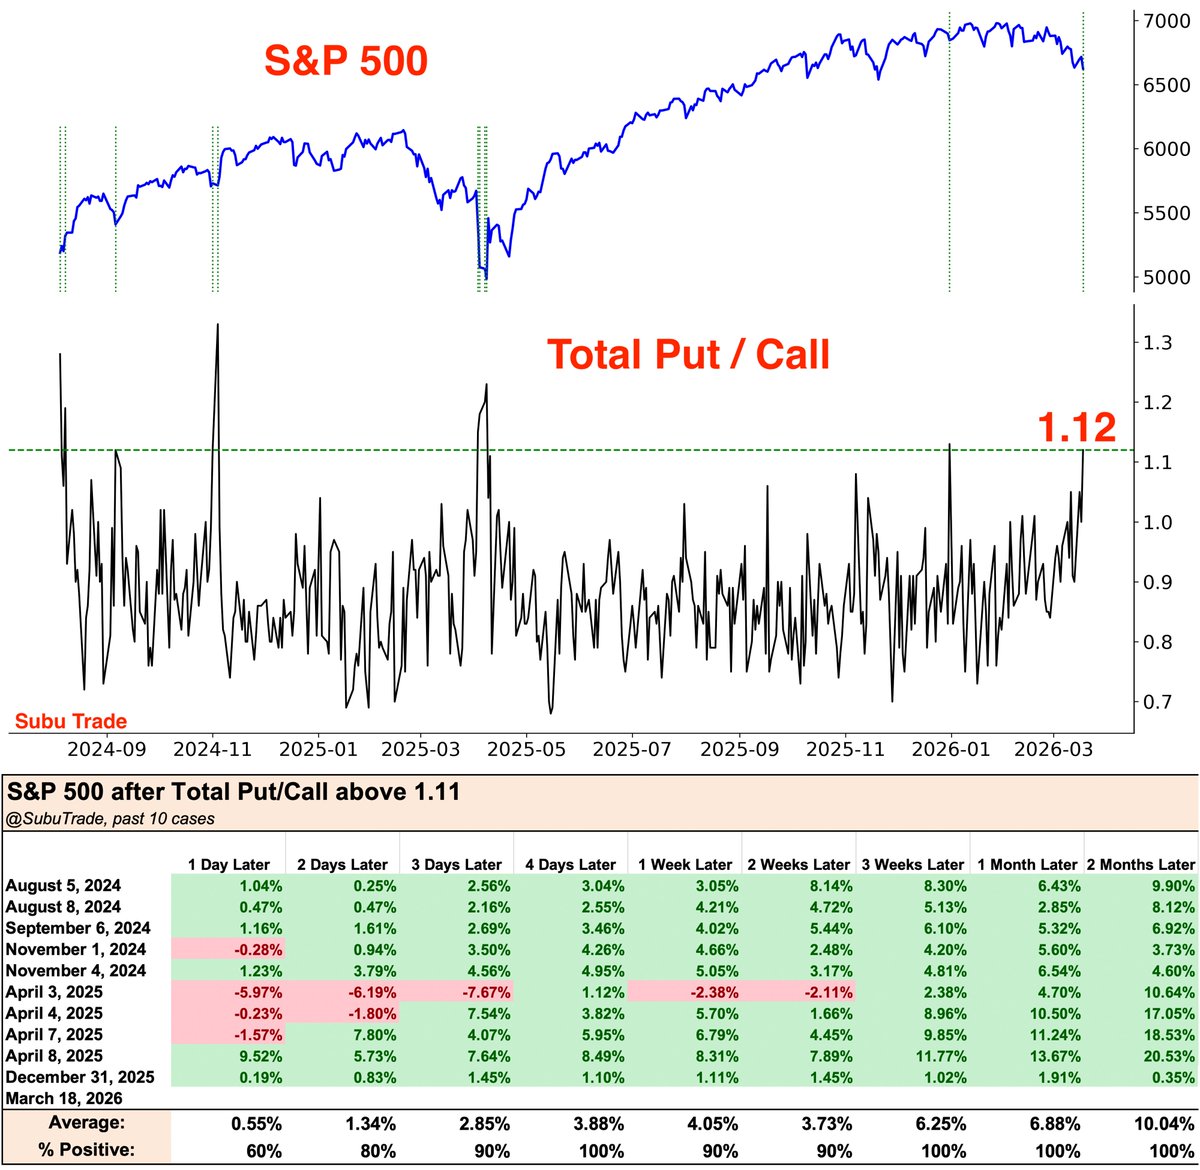
Since 1957, any random day for $SPX has been higher:
• 1 year later: 72.8% of the time (+8.8% average)
• 6 months later: 68.9% of the time (+4.3% average)
• 3 months later: 66.1% of the time (+2.1% average)
• 1 month later: 61.6% of the time (+0.7% average)
• 1 week later: 56.7% of the time (+0.2% average)
This is the baseline.
Without this benchmark, forward-return statistics are meaningless. They tell you nothing about how bullish or bearish a signal really is.
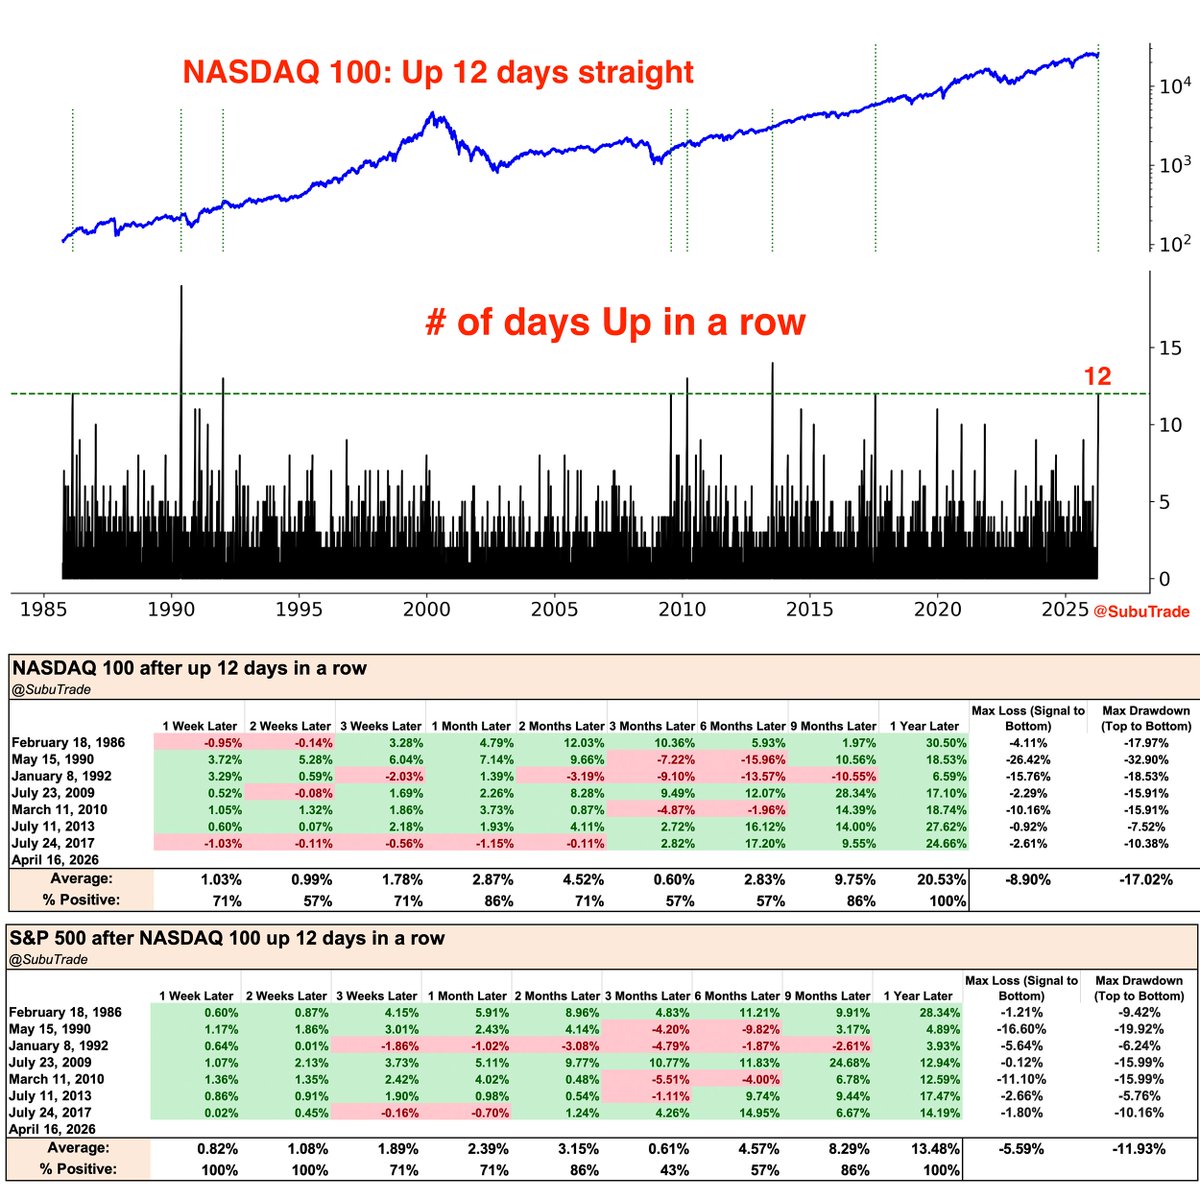
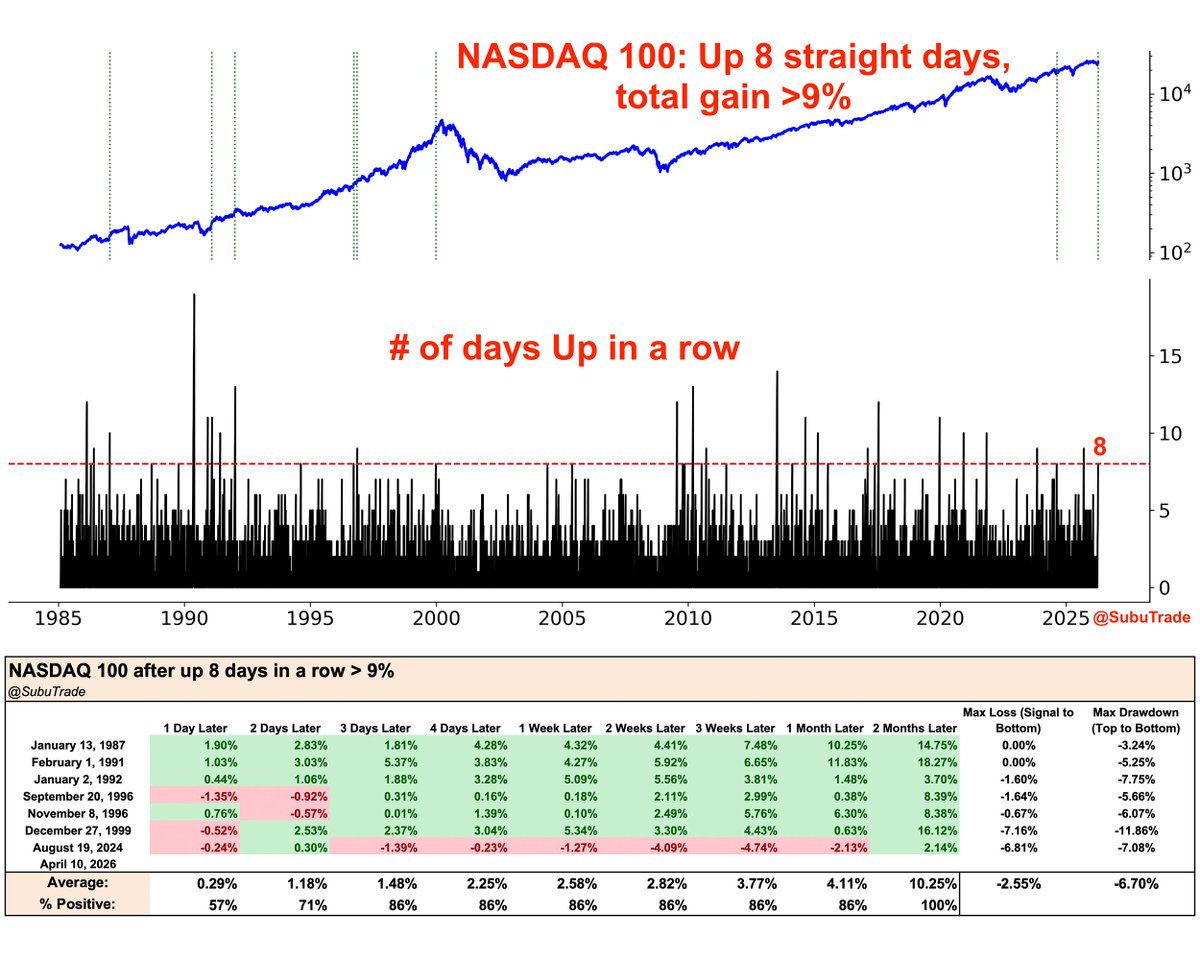
NASDAQ 100 is up 8 days in a row, with a total gain of 9.4%!
Momentum is strong, and this is bullish for the NASDAQ in the next few days and weeks
$NDX $QQQ
Market breadth jumped.
For the first time in 4 months, the S&P 500's McClellan Oscillator is above 50
We've seen 11 similar cases before, and 10 of those 11 saw $SPX higher a month later. Average gain +3.2%
H/T @TheMarketStats
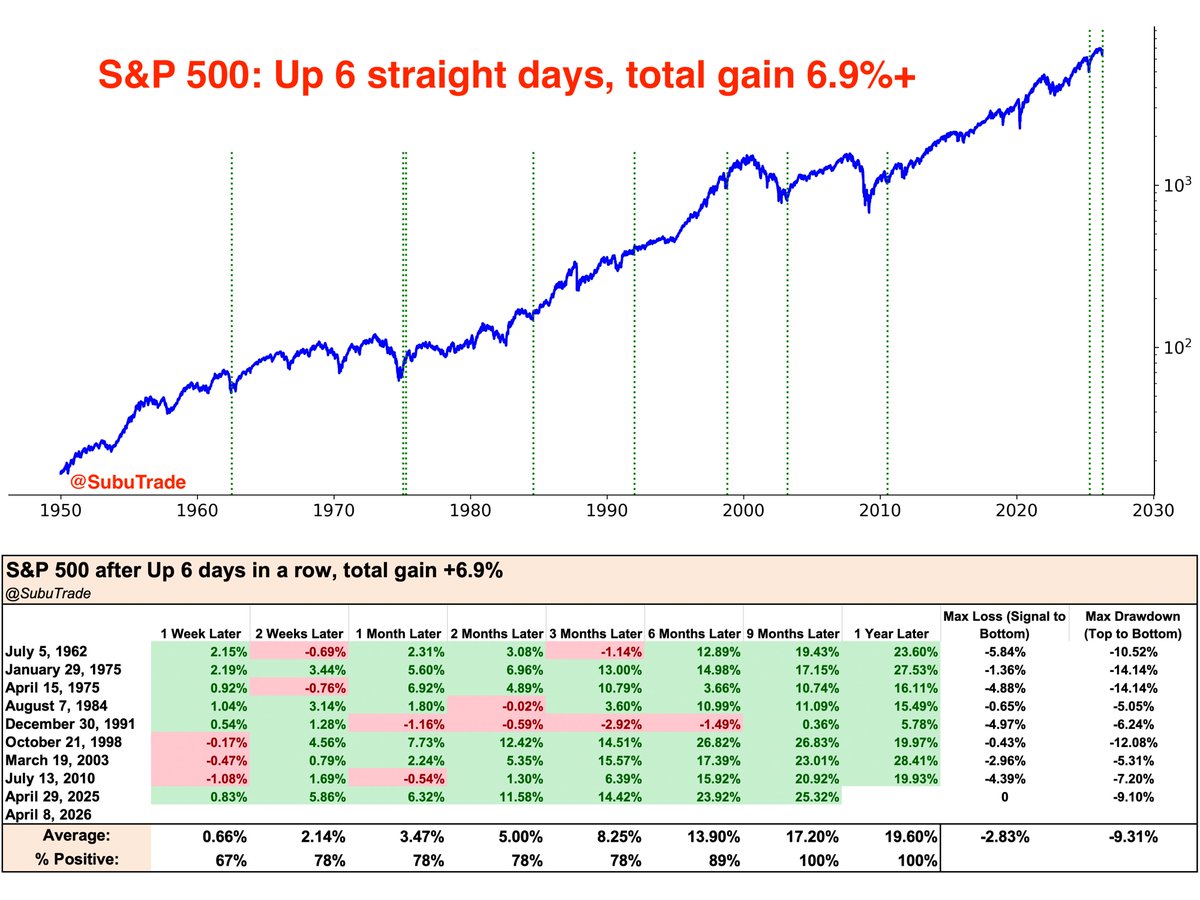
S&P 500 is up 6 days in a row, with a total gain of +6.9%
This only happened 9 other times, and $SPX was consistently higher 6-12 months later.
Average maximum drawdown in the next year was 9.3%
h/t @Norseman1@RyanDetrick
S&P 500's Daily Sentiment Index is at 22, the lowest since last April's crash.
Similar depressed sentiment readings came close to marking bottoms for $SPX
From the AAII Sentiment Survey:
Cash Allocations is at 14.19%. Investors are holding the least cash in 4 years.
This happened 3 times in the past 20 years: late-2017, Jan 2020, late-2021.
Each case preceded significant market volatility and losses for $SPX
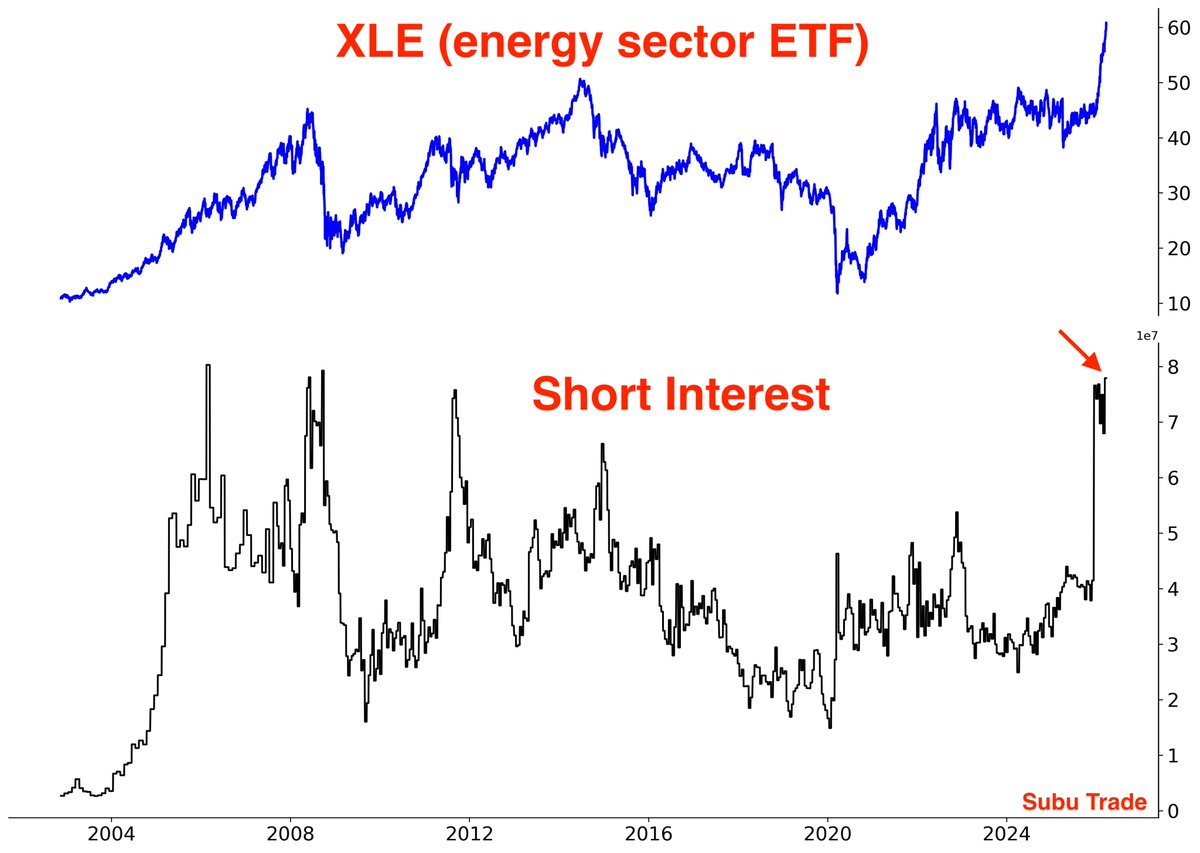
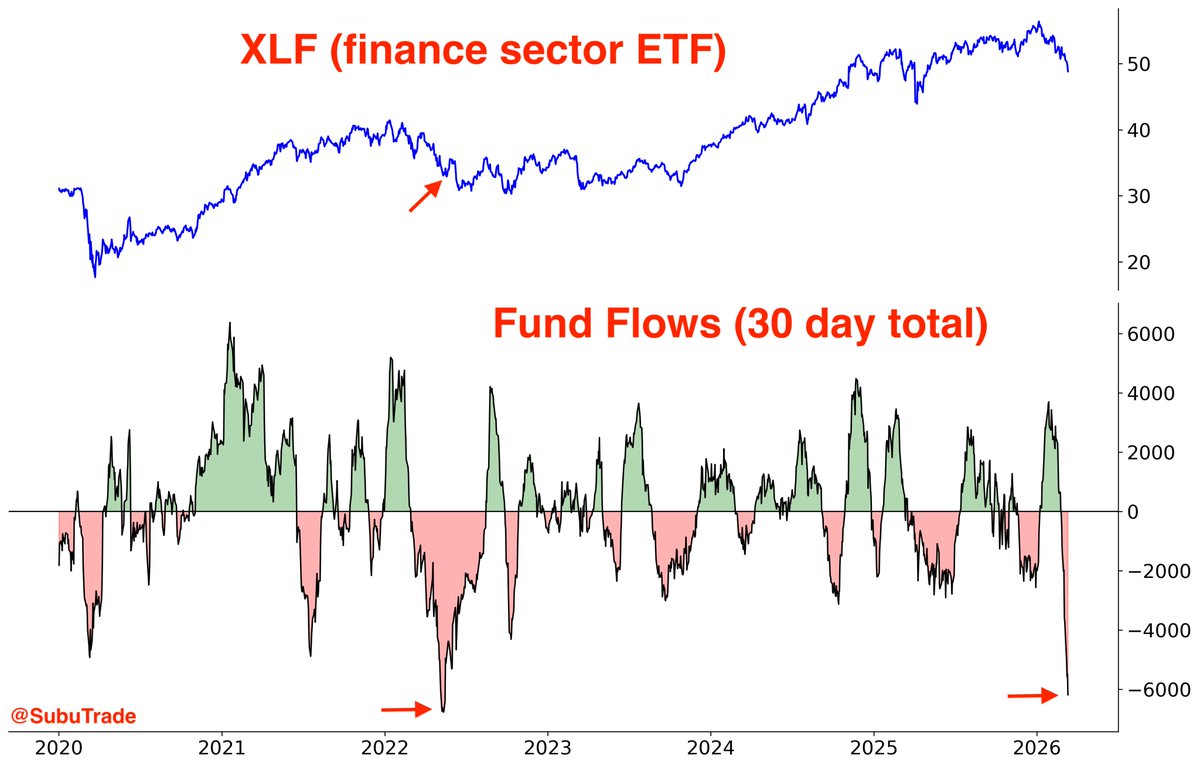
The past 30 trading days have seen massive outflows from financials.
$XLF outflows are now on par with May 2022.
Even in the middle of the 2022 bear market, $XLF first bounced, before heading lower.