My first ever submission to the #makeovermonday project! COVID-19 Keeps American Tourists Away from New York City. 2021 Week 16.
Link to the dashboard in Tableau Public: https://t.co/PMWne6Anrd
#dataviz
@mikiebarb @amychozick Looks like Amy believed her a bit too much. Might have thought to mention that Holmes didn’t really fail; she decided to fake the data she wanted to have and sold it to people to use to make critical health decisions. @amychozick was played for a fool or thinks fraud isn’t so bad
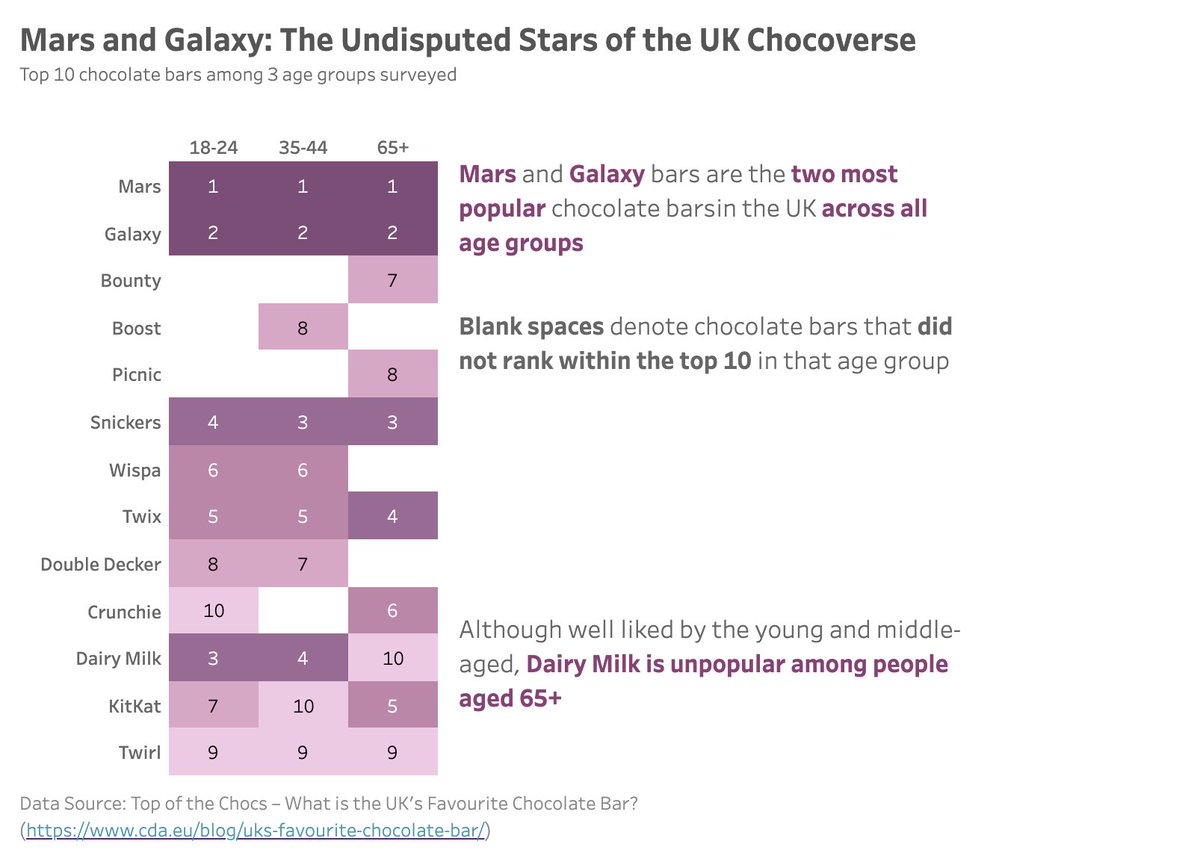
Top 10 chocolate bars in the UK in 2018 by age group.
Link to viz on Tableau Public: https://t.co/l1Azla3sae
Dataset: 2018 Week 13
#MakeoverMondayCoursera
@okidoki_boki If you haven’t read them, the Thursday Next series by Jasper Fford is, I think, would be something you would enjoy. Thursday Next (she, detective) lives in a literature-crazy England. She enters the original Jane Eyre manuscript to stop a criminal from killing Jane.
@okidoki_boki It totally does suck. I had one while I was in grad school — in 2014. The feelings were overwhelming and complicated…and we didn’t even want a baby originally. Allow yourself to feel all the feelings. And be kind to yourself. Lots of hugs!
@epistemographer If no one has responded yet, perhaps we can chat? I sent you a message on LinkedIn. Would love to tell you all about our framework for creating highly engaging learning at scale online. The holy grail!
Check out "Project Ianos - Past, Present & Future of Human Spaceflight" https://t.co/9lOZ3GUljd #STEMvideohall. My friend, @DegreeofFree is involved in its creation and it's awesome! It has my vote for Public Choice.
Meet our #MemberMonday@swatibcarr
She is a microbiology (MS) and a bioengineer (Ph.D.)
She joined WiD to find other women that are also interested in becoming proficient at using data to tell impactful stories.
Fun Fact: When I was 6 years old, I was run over by an ostrich.
"As designers and thought leaders in digital learning design, what can we do to ensure the needs of all learners are addressed?" @swatibcarr explores #accessibility with learning experience design experts. https://t.co/BllTewFmg0
Thank you, @TriMyData for pointing the discussion in Viz Review towards the complexity of the 2021, Week 16 dataset. I struggled with choice paralysis quite a bit — there were so many possibilities. Choice paralysis and being a novice Tableau user don’t mix well. 🤣
My first ever submission to the #makeovermonday project! COVID-19 Keeps American Tourists Away from New York City. 2021 Week 16.
Link to the dashboard in Tableau Public: https://t.co/PMWne6Anrd
#dataviz
@VizWizBI@TriMyData I FIGURED IT OUT! All my trouble was because I was setting my “before” and “after” categories as discrete and not continuous. I am not going to win any prizes with my viz, but I am determined to turn my small little story in. Thank you both for taking the time to reply to me. ❤️
@TriMyData what do I do when I have taken the time to understand and explore my data, have a story I want to tell, but am limited by my beginner-level Tableau skills? I ranked US travel hubs in 2020 before and after a date and want to create a slope graph but am stuck. :(
Bit ironic to create so much cognitive load on a question about reducing cognitive load in data visualisations. I had to draw each of these out to pick an answer, and the answer is still “it depends on the data” #wtfdataviz
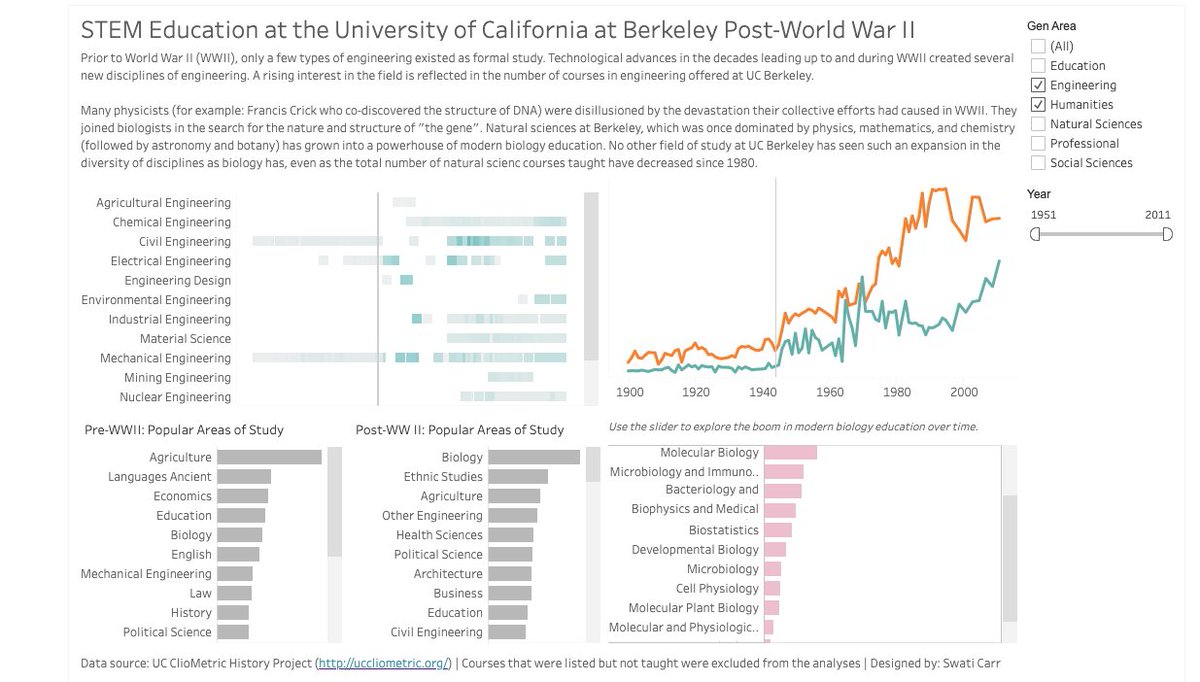
Dataset: Week 12 (2020)
Dashboard: https://t.co/x2uwEwAayJ
Even with the explosion of STEM courses at UC Berkeley, there are far more courses taught in the humanities than engineering or natural sciences.
#makeovermondaycoursera
@DCBPhDV2 I hear you. It’s cat vomit for me. Usually still warm. And right at the spot where my feet land when I first step out from bed. Wonder if the cats thinks of it as a present from him to me.