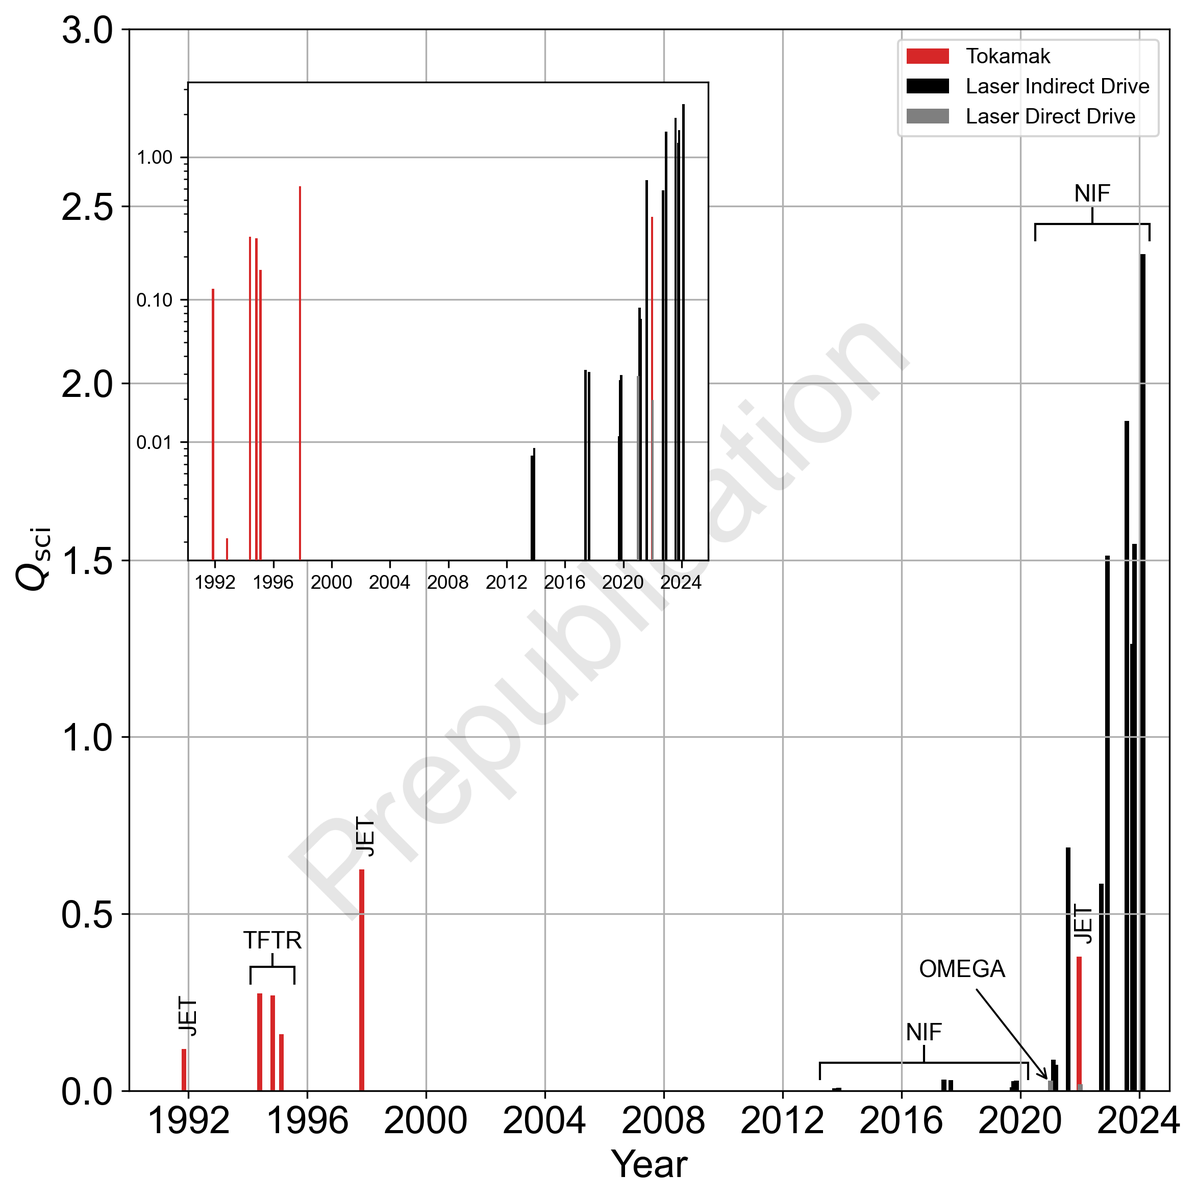
The final NIF shot on this plot does have a lower triple product than the previous NIF data point because ignition causes the stagnation duration to go down (i.e., the plasma is blown apart more rapidly). We discuss this issue and limitations of the triple product more generally in Section III.D (p.3) of the preprint here https://t.co/7h1IZa0aTI
Both @swurzel and @ScottCHsu have done a great job tracking decades of progress toward net fusion energy — more power out than in. That goal, denoted Q>1, is a key step toward fusion energy commercialization. The researchers’ 2022 paper summarizes decades of results from dozens of machines.
Now Wurzel and Hsu are updating their research with newer results like the National Ignition Facility’s successful demonstrations. Projected results from our own SPARC machine, which we detailed in our own physics basis research papers, appear on their plots. We plan to push first for Q>1, but the machine is designed to reach Q=11.
For anyone who wants to track fusion energy progress, this unbiased assessment rises above much of the noise. Kudos to these researchers for helping it keep pace with our fast-moving industry.
Read more: https://t.co/nYxmwvzK5i
#FusionEnergy
If you're interested in reading more, check out our summary article on Fusion Energy Base https://t.co/y3avFvCstQ
and our preprint with all the details on arXiv,
https://t.co/wSPd0U6vqI
The horizontal axis is the ion temperature, measured in kilo-electron volts (keV). 1 keV = 11.6 million degrees. Under the assumptions made in this plot, high performance requires high temperatures, period.
Now that NIF has crossed that threshold, we've created a new plot of scientific gain over time. You can see the results from the 1990s in tokamaks like JET and TFTR and the recent rapid progress being made at the NIF. The inset is the same data on log-linear axes.
The vertical axis is the product of two quantities, plasma density and how long energy stays in the system.
These two can be traded off! In magnetic confinement schemes the density is low and energy stays in the system for a longer time compared to inertial confinement (usually done with lasers) where the density is much higher but the time energy stays in the system is much lower.
We call the product of these two quantities the Lawson parameter.
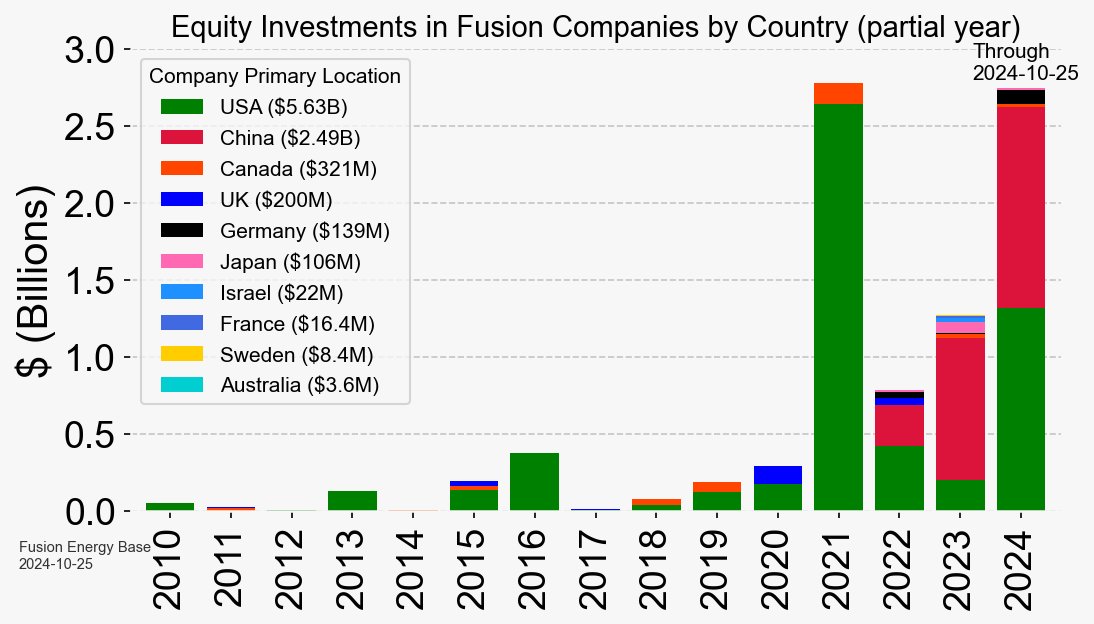
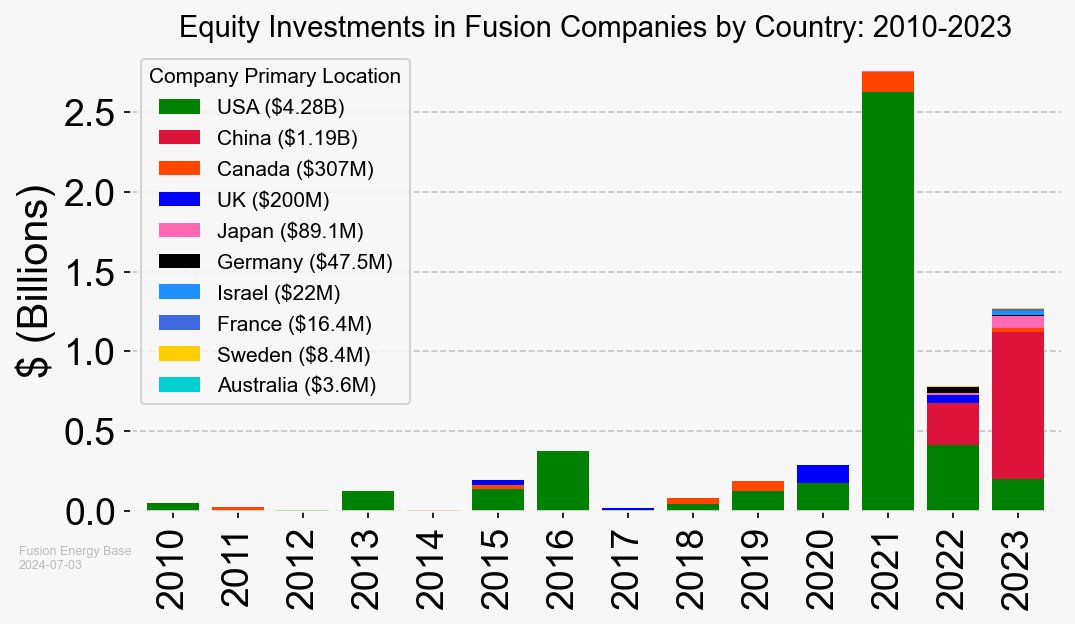
Senator Manchin highlighted recent global trends in equity investments to fusion companies with a Fusion Energy Base graph in today's Full Committee Hearing to Examine Fusion Energy Technology Development. Given the interest in this graph, I've run the numbers through September 2024 and made an updated graph in the article linked below.
https://t.co/r8zTrPakGA
Thanks to Andrew Holland from @Fusion_Industry for the photo!
Fusion Energy Base Jobs Search is live!
https://t.co/s2F088Cqdq
If you're at an organization developing or supporting fusion energy, email us with a link to your jobs page to be listed. [email protected]
Fusion Energy Base Intern Jackson Strauss built this!
https://t.co/NufdpXBfD9
Supply Chain Directory is live on Fusion Energy Base today!
https://t.co/8JvSuzrwQu
Shout out to FIA's Supply Chain Report
https://t.co/aoHRrdlpKD
and Proto Ventures' Enabling Commercial Fusion Report
https://t.co/c8bLp3F4Bw
for insights in this emerging area!
"Progress toward fusion energy breakeven and gain as measured against the Lawson criterion" by @ScottCHsu and myself is published (open access)! GIF of achieved Lawson parameter vs temperature below shows the progress. https://t.co/VKFM1XubXR #fusionenergy@ARPAE@AIP_Publishing
Congratulations to the teams selected for Milestone-Based Fusion Development Program! 5 out of 8 have or had a funding connection to ARPA-E: https://t.co/tjMpu1dH0C