Most traders use ATR for one thing.
The stop loss.
That is the weakest way to use it.
ATR can run the whole breakout strategy.
Entry
> Open of the bar + 2.5 × ATR(20)
> A hard price. It gets hit, or it doesn’t.
Filter
> Short-term ATR vs long-term ATR
> Short-term below long-term = the market is coiling. Take the breakout.
> Short-term above long-term = already expanding. Sit out.
Exit
> Use a fraction of ATR as the stop distance
> The market decides how much room the trade needs
Same measurement in all three places:
how much the market is actually moving.
If you only use ATR for the stop, you are leaving the other two jobs unused.
What do you currently use ATR for?
I ran 16.5 million filter tests on NASDAQ.
One condition beat every other oscillator, trend indicator, volatility filter, and volume condition.
The winner: a simple CCI correction filter.
Exact rule for long entries:
Lowest(CCI(27), 18 bars) < –100
In plain English:
Only take the long breakout if, somewhere in the last 18 bars, CCI(27) dipped below –100.
(i.e. the market has already had a real correction)
Results across 1,000 strategy variations:
> Net profit improved on 69% of strategies
> Average trade improved by 22% on more than half
> Bounce index: 57.8% (turned that many losing variations profitable)
On the base NASDAQ breakout:
Profit/drawdown ratio: 7.53 → 8.6
Average trade: $116 → $149
Why it works:
Breakouts taken after a genuine washout have room to run.
Breakouts taken into already-extended strength tend to fade.
This wasn’t tested on one strategy.
It was stress-tested across 1,000 different ones.
That’s the difference between a filter that looks good and a filter that actually travels.
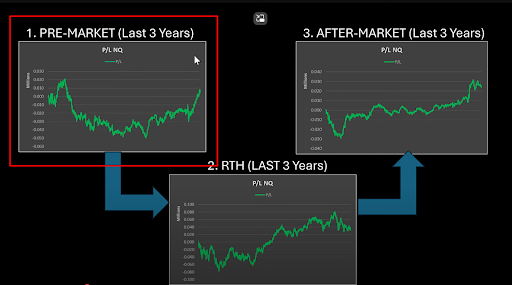
I never assume all sessions behave the same.
They don’t.
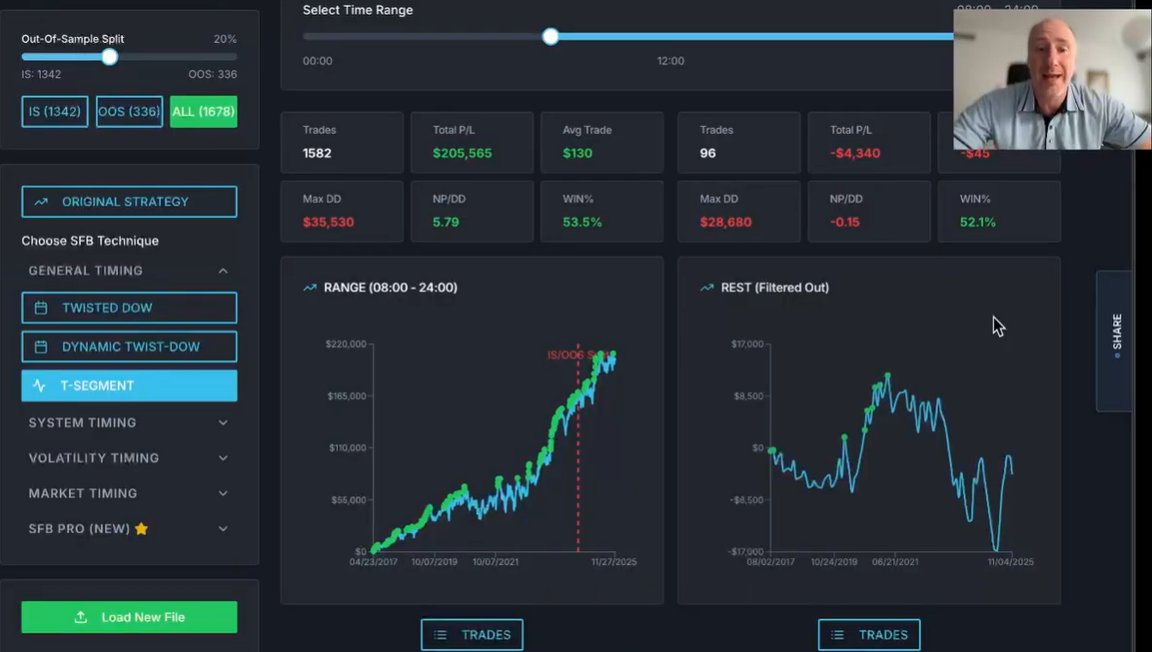
When I segmented this Nasdaq strategy, the differences were extreme.
> Aftermarket performed best
> Regular session was mixed
> Premarket lost money
That’s not opinion.
That’s data.
So I did the simplest thing possible.
I removed the premarket.
No clever logic.
No optimization.
Just common sense applied to time.
The result?
> Fewer bad trades
> Higher average trade
> Cleaner equity curve
Watch the video and get the free resource in the comments.
Winning once means nothing to me.
Repeating wins means everything.
TEMA indicator outperformed other moving averages across the metrics that matter.
Here’s what improved most.
> Average trade
> Maximum drawdown
> Net profit to drawdown ratio
Especially average trade.
That’s critical for index strategies.
Seeing consistent improvement here is what got my attention.
The exact TEMA indicator used here is in the comments.
Over the years, I learned that breakout trading lives and dies on timing.
Not entry tricks.
Not clever math.
TIMING.
That’s why I split timing into levels.
> General.
> System.
> Volatility.
> Market.
For this Nikkei strategy, volatility timing was the missing piece.
Once I looked at performance through volatility context, everything became obvious.
Same strategy.
Completely different behavior.
Watch the video to see how volatility timing changes everything.
I have built thousands of breakout strategies.
And ATR keeps proving itself as one of the best tools I have ever used.
Here is how it works in my framework:
Example of Entries
➝ Use ATR to measure breakout space.
➝ A multiplier of 2.5 × ATR(20) defines the ideal entry level.
Example of Filter
➝ ATR helps remove false signals.
➝ Compare two ATR periods, the difference shows real market strength.
Example of Exits
➝ ATR-based stops adapt to volatility and protect profits dynamically.
With just ATR, you can create a complete breakout strategy candidate.
You can see how I apply this inside our hedge fund systems in the comments.
One of the best indicators I have ever used in my hedge fund is Average True Range.
ATR is simple, powerful, and can help you build complete breakout systems.
Here are the 3 ways I use it:
ATR for Entries
➝ I use ATR to calculate the exact breakout space.
➝ F.e.: take today’s open and add 2.5 × ATR(20) to set your entry level.
➝ That defines the perfect breakout zone.
ATR as a Filter
➝ Compare two different ATR periods.
➝ When short-term volatility is higher than long-term, breakouts have strength.
➝ This filter alone can smooth your equity curve dramatically.
ATR for Exits
➝ Use ATR multiples to place stop losses.
➝ It adapts your exit to market volatility and keeps your risk proportional.
All three rules come from one indicator.
You can see the full setup in the comments.
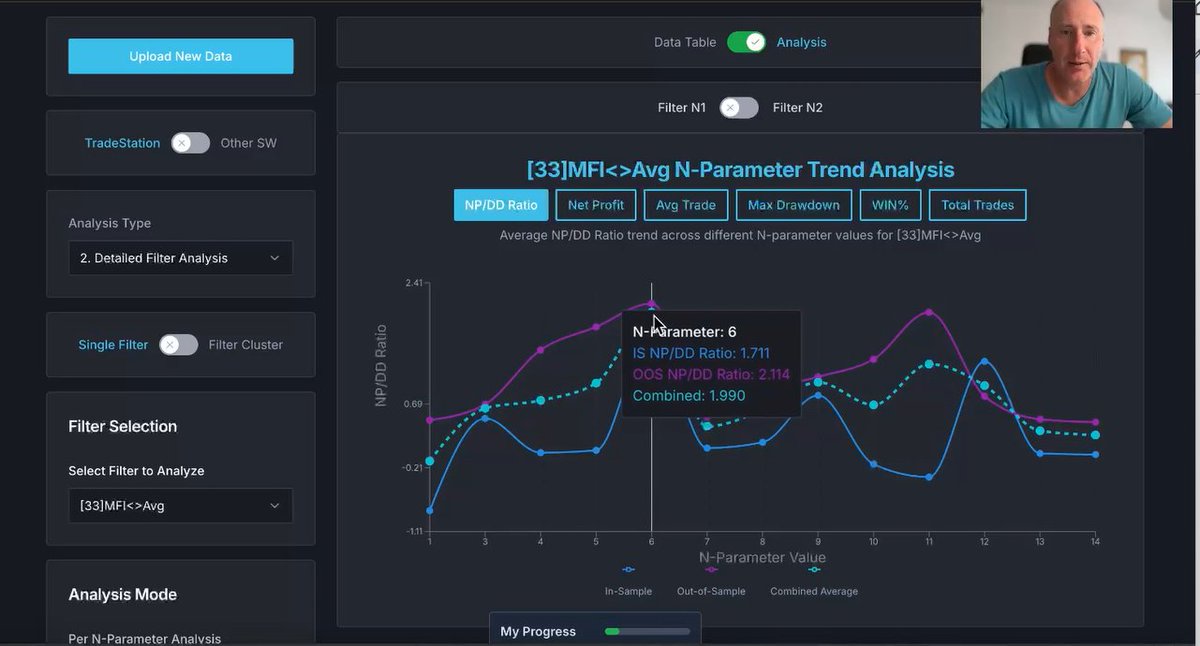
I never thought the Money Flow Index would be any good.
But when I tested 100 indicators on 3,500 strategies, the truth came out.
And it really stood out.
It ranked #1 in the volume cluster and #2 overall.
It consistently improved net profit, drawdowns, and win % across 15 years of data.
I was pretty impressed!
MFI tracks smart money really well - at least based on my thorough testing.
Do you use MFI yourself?
Watch the video and get the free resource in the comments.
Trading can be super simple.
For example, try this:
✓ Market ➝ E-mini NASDAQ (NQ), 30-minute bars, 24-hour data
✓ Filter ➝ ADX above 17.5 to confirm strength before breakout
✓ Entry ➝ Buy stop above the highest close of N bars back
✓ Exit ➝ End of day
✓ Stop loss ➝ $1,000
✓ Entry window ➝ 8 a.m. to 3 p.m.
It’s one of the few systems that performs well across multiple indexes.
You’ll see why simplicity matters in the comments.
Most traders have a dream income in mind… but almost none know what it actually takes to reach it.
This calculator breaks it down: capital required, expected returns, compounding path, timeframe - everything.
Run your plan, the link’s ready in the comments ↓
AI gave us a slope moving average.
It looked promising on NASDAQ.
But was it real… or just a coincidence?
We ran it through 6 major indexes.
No tweaks. No curve-fitting. Just one question:
Does this slope condition actually work across markets?
NASDAQ — big improvement
S&P — sharp boost in avg trade + profit factor
RTY & EMD — small but clear gains
YM & Nikkei — worse
Final score?
✅ 4 out of 6 showed improvement
✅ No optimization of MA length or lookback
✅ This wasn’t even stress tested yet
Not magic but 70% success rate on a single filter?
That’s worth paying attention to.
Video + free strategy in the comments.
Most traders don’t realize the Nikkei 225 is tradable on CME in USD.
That’s already a big opportunity.
But here’s what my research uncovered:
✓ The index has a strong natural long bias.
✓ Volatility is rising, creating trendiness.
✓ Breakout edges are cleaner than in overcrowded US markets.
Then I mapped sessions.
Fridays, Thursdays, Wednesdays, Tuesdays? Weak or negative.
But Mondays, 8–3pm, delivered years of consistent profits even without filters.
That’s a time-based bias you can build on immediately.
Watch the video and get the free resource in the comments.
When I first started trading, everyone said the same thing:
“Use stochastics - it’s the secret weapon.”
So I did.
And it nearly destroyed my account.
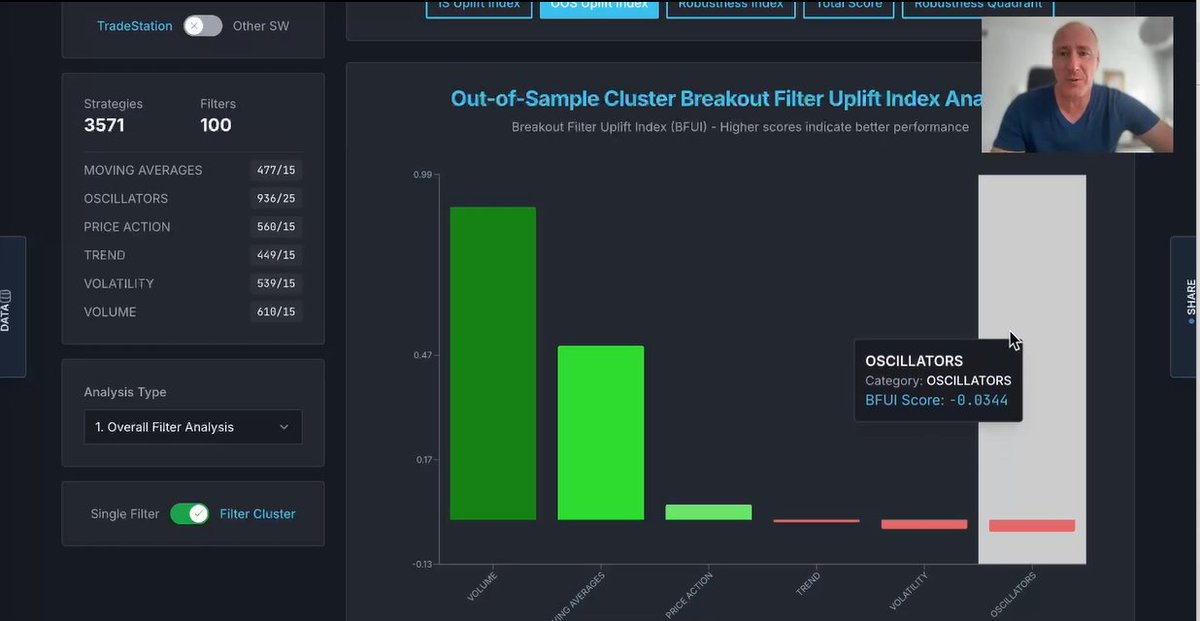
In previous episodes, I mentioned that I tested 100 indicators across 3,500 breakout strategies.
That study confirmed what I felt all along - stochastics are terrible.
✓ They consistently worsened performance (in-sample and out-of-sample).
✓ 15 years of data.
✓ 3,500 systems.
Same result - worse outcomes every time.
Meanwhile, volume-based and moving-average indicators dominated.
They improved robustness and consistency across markets.
If you’re still relying on oscillators like RSI or stochastics, be careful.
They might look smart… but the data says otherwise.
Watch the video below and get the free resource in the comments ↓
I tested 100 indicators across 3,500 breakout strategies.
This is what I did:
➝ Step 1: Built thousands of Nasdaq 60m breakout strategies without filters.
➝ Step 2: Re-ran them with AI-generated filters in 6 categories.
➝ Step 3: Measured improvements using a proprietary uplift + robustness index.
Result? The winners weren’t exotic or complex - quite the opposite. The winners are:
✓ Bar Range (High–Low)
✓ ATR (Average True Range)
These simple volatility filters outperformed 98 others, proving robust both in-sample and out-of-sample.
Complexity doesn’t win. Robust simplicity does.
Watch the full breakdown + grab my free resource in the comments ↓
Traders obsess over entries.
But they miss one of the simplest upgrades to any strategy.
TIME FILTERS.
We tested six time windows.
One delivered significantly more profit than the others.
And one guaranteed loss.
That’s the power of precise timing.
✅ Cut the dead zones (like lunch hours)
✅ Target high-momentum time blocks
✅ Let the market’s own rhythm guide your strategy
This one tweak improved both profit factor and drawdown.
It’s now a core feature in many of our live systems.
The right timing doesn’t add complexity. It adds CLARITY.
Traders obsess over finding “the perfect strategy.”
But here’s the truth nobody tells you: even the best strategy fails if you trade it at the wrong time.
That’s why I use Canvassing.
It’s NOT a strategy.
It’s the FILTER that makes any breakout method profitable.
✅ Finds the exact time windows where markets actually move
✅ Cuts out dead zones where most traders bleed
✅ Creates consistent, repeatable opportunities
Forget trading 24/7.
Nasdaq only gives stable edges 11am - 10pm.
Gold? Aftermarket 1:30 - 11:30pm.
Monday mornings? Gold shorts shine between 2 - 9am.
This is what separates pros from amateurs.
Watch the video + grab the free resource below in the comments ⬇️
This chart tells me exactly when NOT to trade Nasdaq.
The Nasdaq market isn’t one stream, it���s three.
➡️ Pre-market.
➡️ Regular session.
➡️ After-market.
Most traders treat them the same.
That’s a mistake.
In 2025, the lowest-hanging fruit lives after 3:15pm.
That’s where I’m placing my bets.
Want to trade smarter?
Stop guessing and start mapping the session first.
This one tweak changed everything.
Grab the free resource and watch the video in the comments to see how I did it.