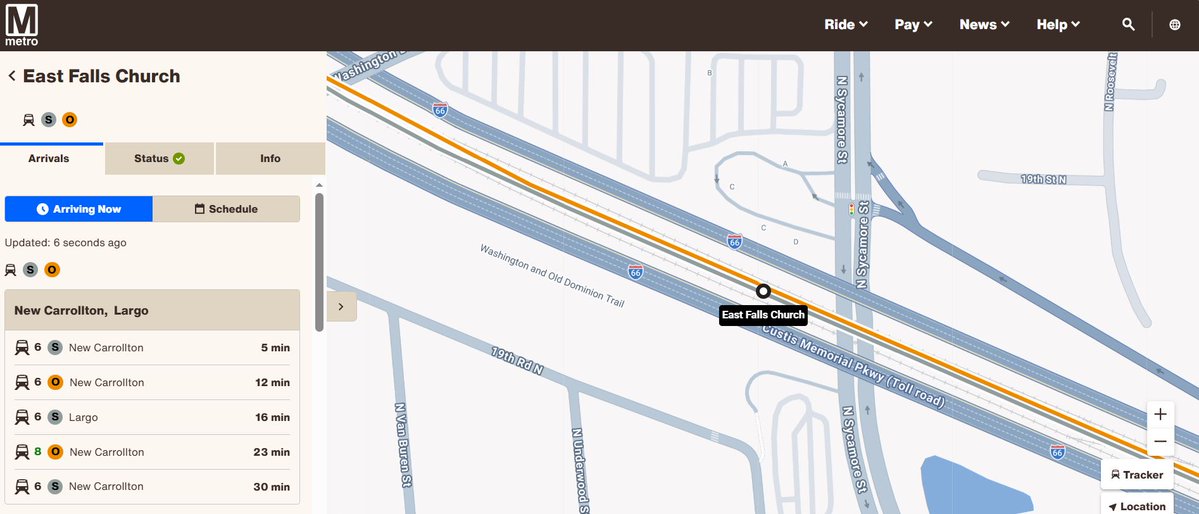
We heard your feedback & updated our website! 📲💻
✔️Train lengths displayed
✔️Real-time elevator/escalator tracking (single view of ALL elevator/escalator statuses)
✔️Navigation upgrades
✔️Improved arrival countdowns
✔️Enhanced station & stop search
https://t.co/OaxEYu4Hfh
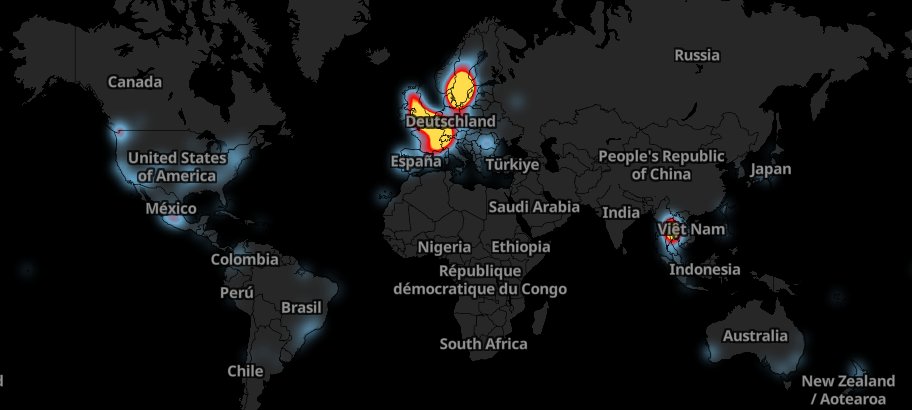
I made a super simple website where you can see everywhere you can get to in under an hour on the NYC subway.
The generated map is both a heat-map (changes color) and a cartogram (warps space).
https://t.co/liTziAmQEd
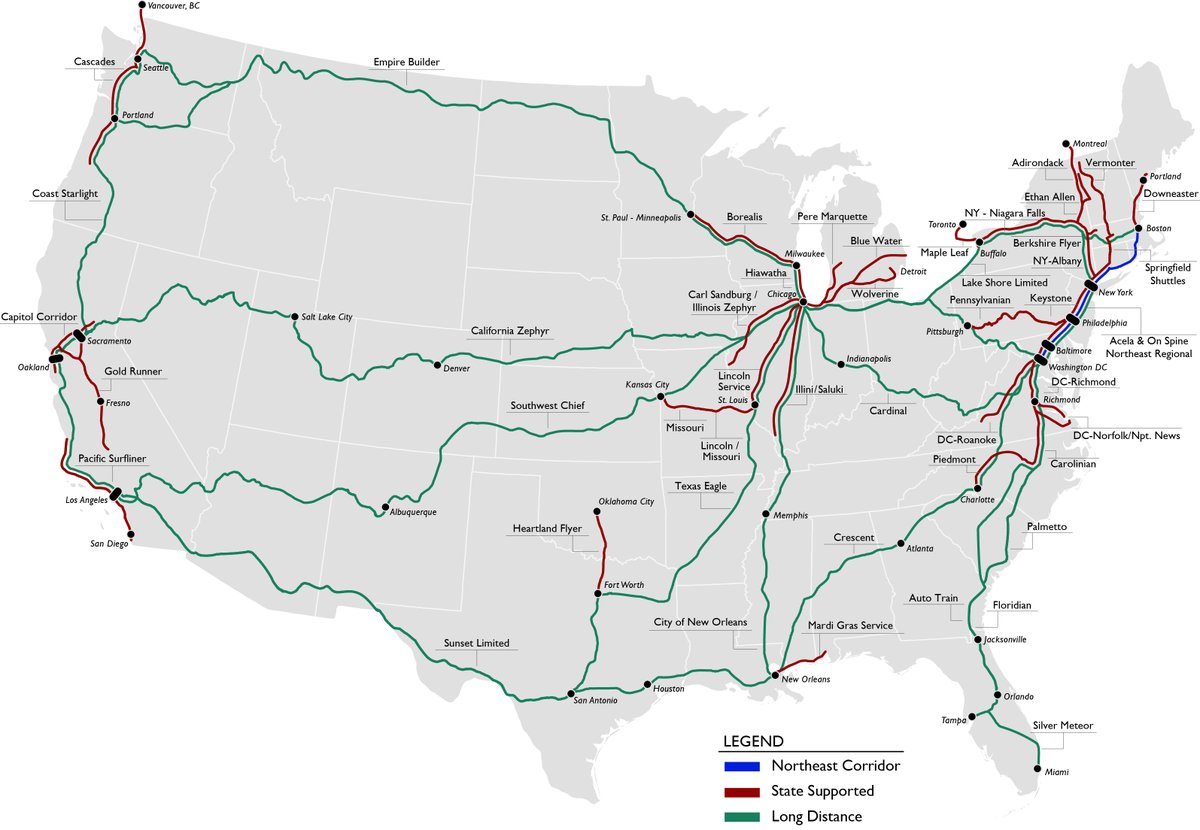
🚆Train data alert!
FRA published its quarterly report on intercity passenger train performance, covering October-December 2025. This report provides data on Amtrak passenger train operations, including the first full quarter of data from the new Mardi Gras service.
https://t.co/Bhbbz6cbym
Every day, millions of people travel through New York’s subway system, spanning over 400 stations and 600 miles of track!🗽🚇 This animation illustrates how travel patterns change throughout the day.
🔹Explore the story map: https://t.co/QP7zlUiTcK
When I moved to new york, I found it hard to visualize what commute times actually looked like.
The same dilemma occurs every time you move, or even book a hotel: what's actually accessible in 20 minutes of public transit?
Deployment link below
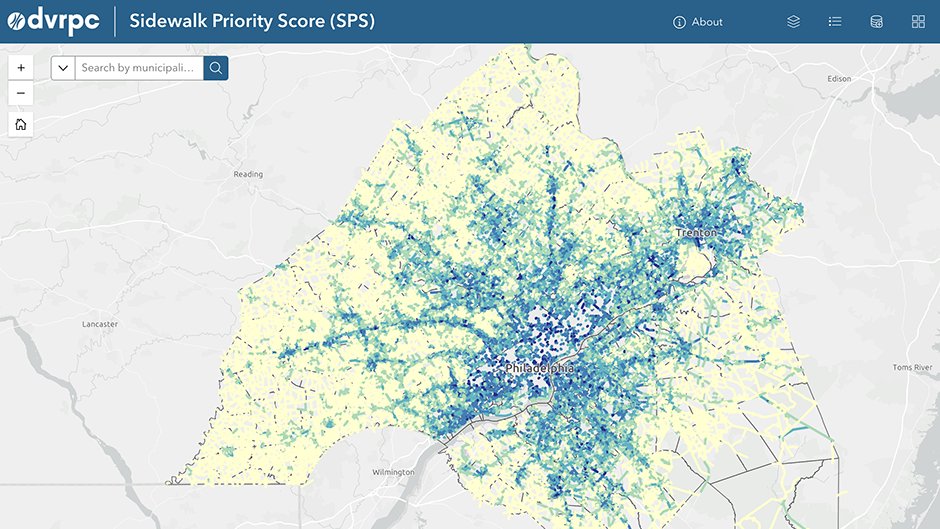
���️ DVRPC has released a new tool, the Sidewalk Priority Score, which identifies and prioritizes needed sidewalk connections in the Greater Philadelphia region: https://t.co/dejs3ya8AF
@DVRPC | @511PAPhilly
Continuing our @Kpler analysis of GNSS spoofing in the Strait, this animation uses raw unfiltered AIS data to compare Feb 27 vs 28.
The chaotic tracks on the 28th show intense GNSS spoofing with red lines showing AIS “jumps” caused by interference.
#dataviz#ais#StraitofHormuz
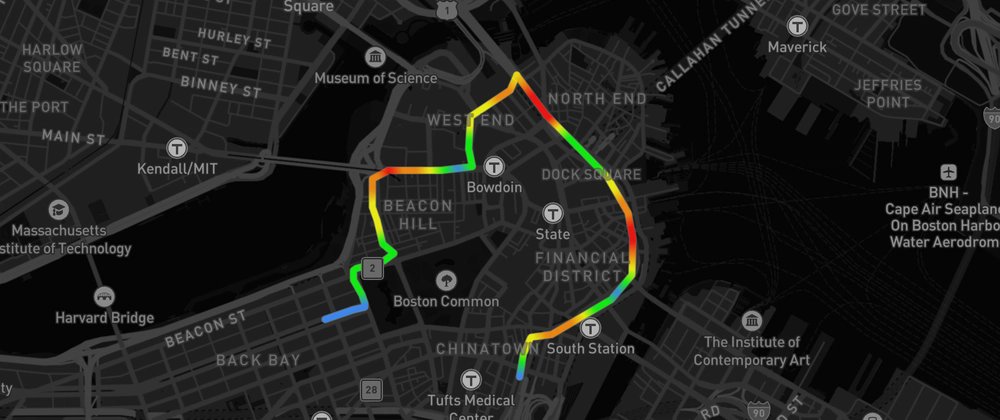
Building ride playback with speed visualization in Mapbox GL JS?
A developer on Reddit asked how to color-code speed along a bike route (green → yellow → red) and add interactive scrubbing to reveal speed + time data at any point.
We built a working demo.
This post shows how to:
✅ Use line gradients to visualize speed variations
✅ Dynamically build gradient stops based on speed data
✅ Implement hover-based route “scrubbing” UX
Includes a live CodePen you can fork and adapt.
Read the walkthrough: https://t.co/J7FsXnZEak
#BuiltWithMapbox #DataViz #WebDevelopment #JavaScript #GeoJSON
Built an app for cyclists who record their rides. Telemetry Studio syncs your bike computer data to video and adds overlays - power zones, heart rate, speed, GPS map, elevation.
Works with FIT and GPX files. Strava segments too.
Download and try it free at https://t.co/3miMvYfSxn
The Rail Crossing Locator is back and better than ever!
📱Apple (iOS) Users:
Your current app will continue to function and receive updates as usual. You can also download it anytime from the Apple App Store.
📱Android Users:
Please delete the older version of the app and reinstall the updated FRA Locator application from the Google Play Store.
💻Web Users:
To access the “Map To” feature, be sure that Google Maps is installed on your device. We’ve also added a new FAQs guide and help section to the web application to provide additional support.
Stay informed. Stay safe.
Access the Rail Crossing Locator here:
https://t.co/2k05cUqanl
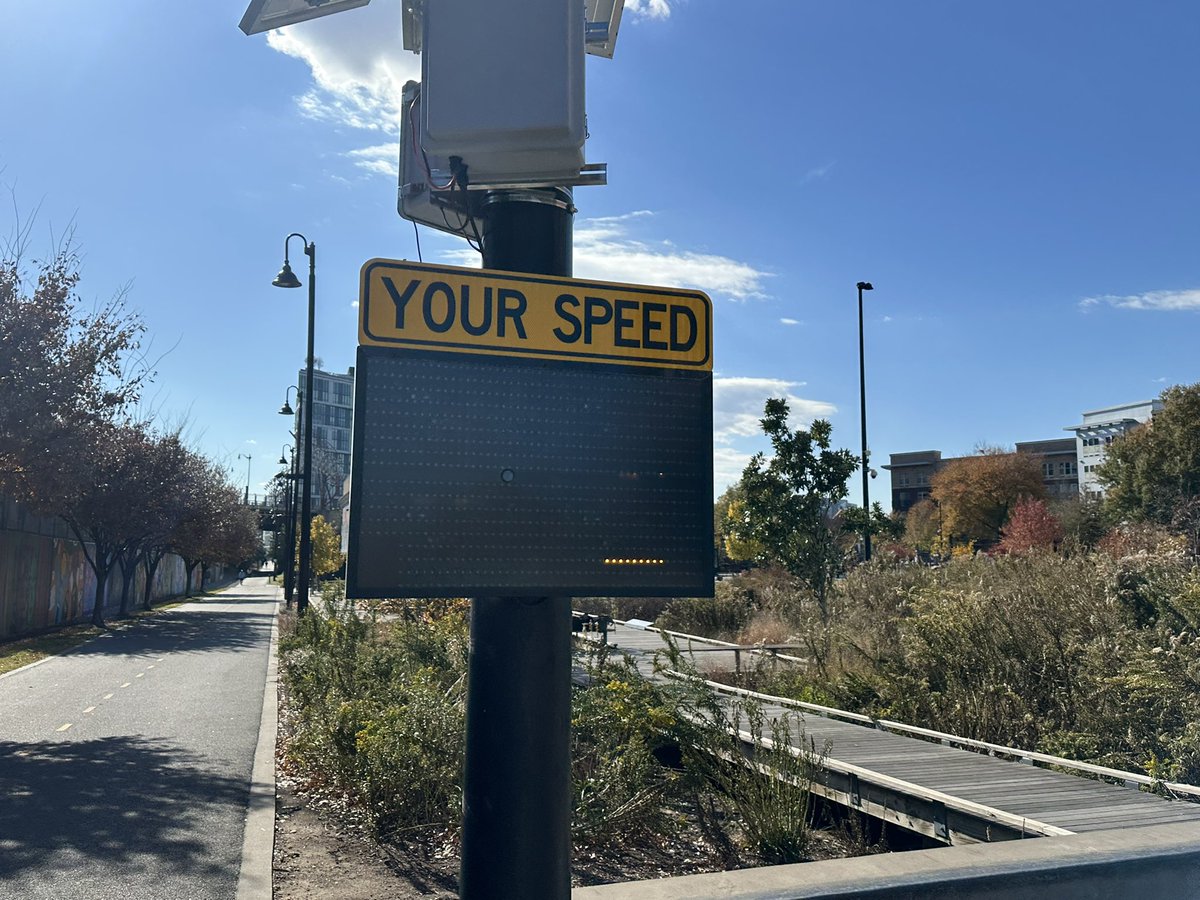
Interesting: @DDOTDC has placed two speed-sensing cameras along the Metropolitan Bike Trail that show a smiley face if you’re riding under 15 mph or a frown if you’re above. City officials say it’s to encourage safer riding, but they are also collecting speed data from cyclists.