It’s graduation season and we could not be more proud of Kaitlyn Terry, who will be graduating from California Poly SLO's Engineering program in just a few weeks. As she and her roommates prepare to enter the “real world,” we put together this simple guide for new grads!
Energy shocks tend to hit inflation and prices faster than they hit the broader economy. Staying disciplined and diversified matters most during volatile headlines.
https://t.co/qKTnaymMKS
This is 7 all-time highs for the S&P 500 in May.
Only 1995, 2013, and 2017 had at least that many.
Rest of the year those years? 15.5%, 13.3%, 10.9%. In other words, be open to more strength.
The S&P 500 is up six weeks in row and >10% during the win streak.
This is only the 10th time that has ever happened (since 1950) and it was lower a year later only once (80 yrs ago), with an avg return of 17.1% (about 2x the avg year return).
Another clue favoring the bulls.
This was the 5th ATH in May, most since 2017.
Nine other years saw this many (or more) ATHs.
The rest of the year (so the final 7 months)? Never lower and up 10.3% on avg.
Can you image how mad another 10% would make the bears? ;)
Markets will always react to Fed headlines, interest rates, and policy speculation. Long-term investing isn’t about predicting every move — it’s about staying disciplined, diversified, and focused on the bigger picture through changing environments.
https://t.co/pElXRHnYwt
AI isn’t just hype; it’s driving real earnings. Tech companies are seeing strong growth fueled by massive AI investment, but leadership is becoming more concentrated. Opportunity is there, but diversification matters.
https://t.co/E20GQkIKkG
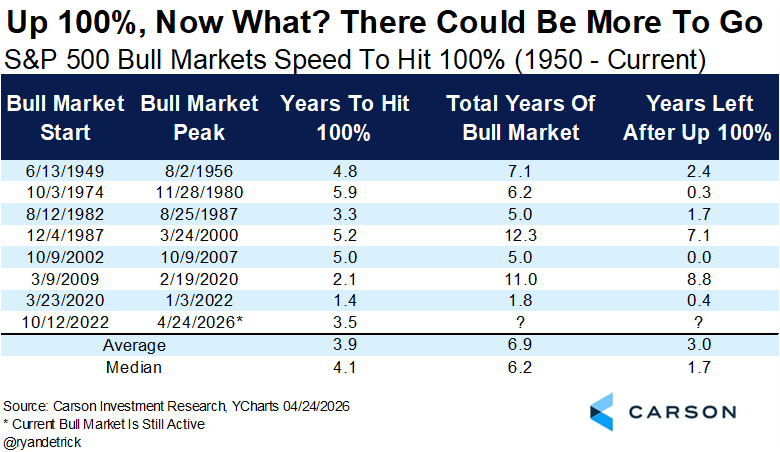
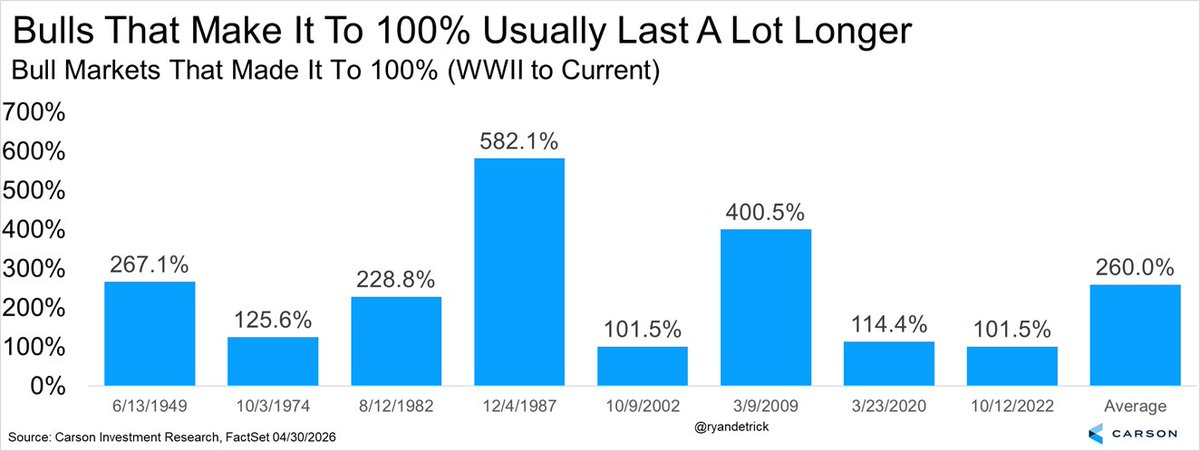
This bull market officially made it to 100% in 3.5 years.
Looking at other bulls that made it to a double and it is perfectly normal to see potentially years left of the bull market.
Yes, this recent bout of volatility hasn't been fun for investors, but remember, volatility is the toll we pay to invest.
These three charts are timeless and always come in handy in times like this.
Chart 1 - The average years sees more than three separate 5% mild pullbacks a year and one 10% correction on average a year. This is our first 5% mild pullback since November, it happens.
Chart 2 - Peak-to-trough the S&P 500 corrects 14.1% on average since 1980. Looking closer at those past 46 years, 24 of them saw a 10% correction and incredibly 14 of those years still finished higher.
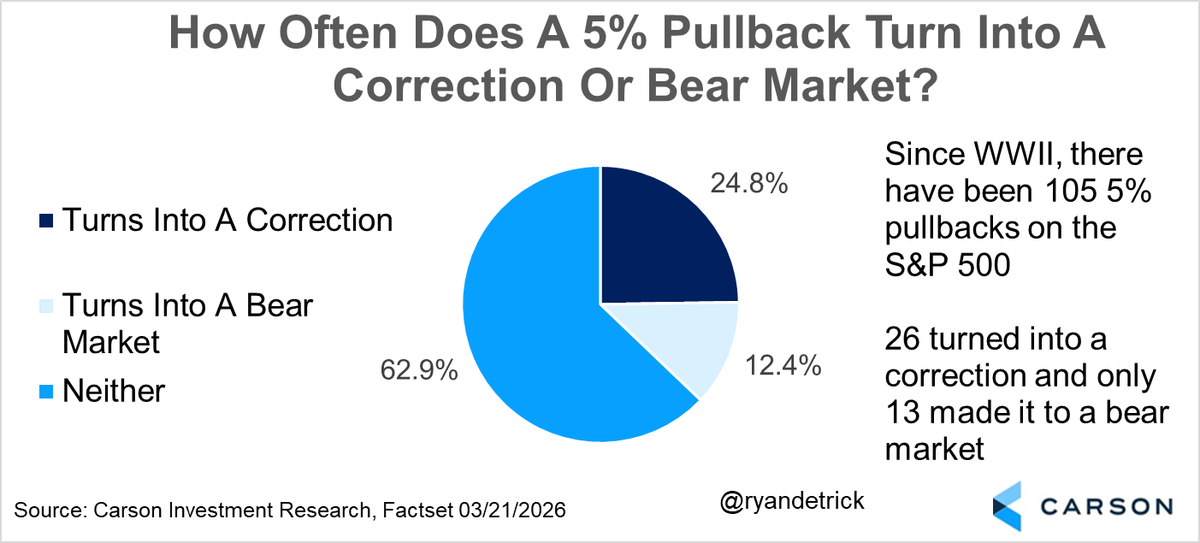
Chart 3 - We are in a mild correction, but how often do things get worse? 24.8% of the time stocks move into a correction and only 12.4% do they move into a bear market.
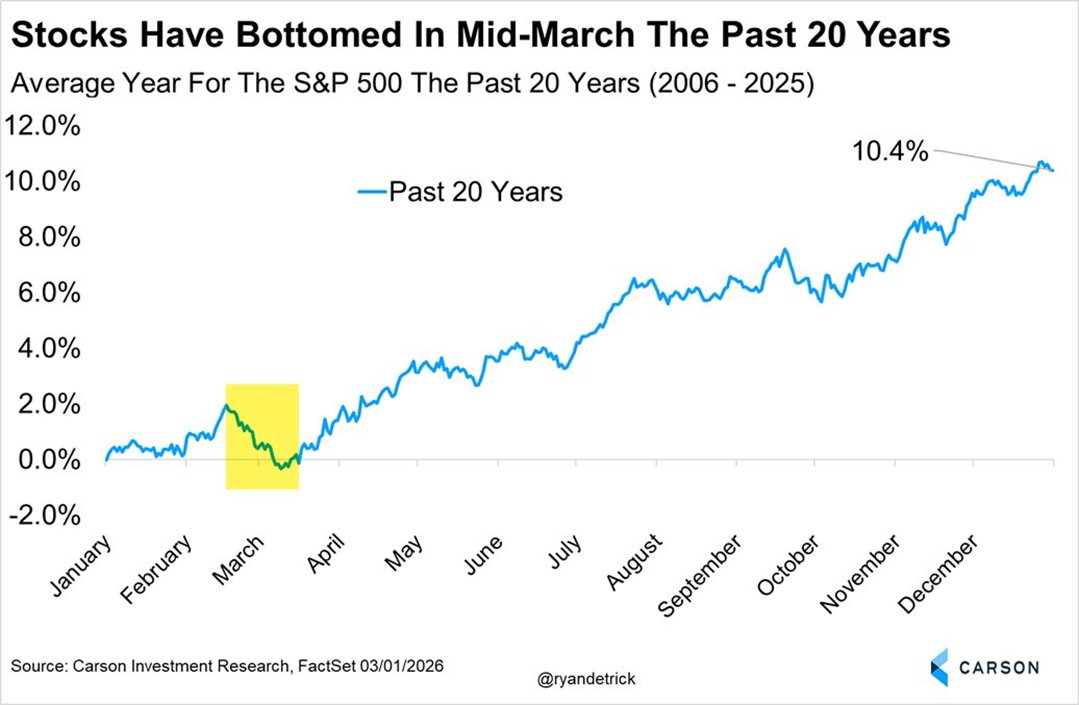
It is what it is, weakness in February and the early parts of March are quite common the past two decades. We've been saying expect a banana peel and we are on it.
The S&P 500 is currently up on the month on a total return basis.
This would be 10 months in a row stocks were higher.
It is simply amazing how much fear and worry we are seeing with this happening.
Not sure if you need a will or a trust? Think of a will as the basic model and a trust as the luxury edition.
Wills are simpler—but go through probate. Trusts offer more control, privacy, and flexibility when set up properly.
🔗 https://t.co/xZ2MoDMSfG
Hawkish cut? Dovish cut?
Does it matter? I don't think so, as history says cuts near ATHs aren't bearish and that is what really matters.
The past 22 times the Fed cut near ATHs saw the S&P 500 higher a year later 22 times. Don't fight the Fed and more cuts are coming.
The Fed cut rates again today—its third consecutive rate reduction. Here’s the AP’s breakdown of what happened and why. If you have questions about how this may affect your financial plan, we’re always here to help.
https://t.co/KWqaPgQ6Gm