The argument @SecretaryWright should’ve made to @SenBlumenthal is “did consumers share in windfall losses by transfers back to oil companies in 2020?” Futures markets don’t believe prices will stay high preventing companies from bringing significant new volumes online
.@SecretaryWright just schooled Democrat Sen. Blumenthal with a basic economics lesson on why Democrats' windfall tax on energy producers is so disastrous. 👇
“If you tax something, you get less of it, and I think getting less energy is NOT a good strategy.”
Without this global town square for free speech, a lot of important things never would’ve seen daylight.
Real-time information governments tried to bury. Scientific debate that was actively censored. Voices that would’ve stayed silenced forever.
Respect to @elonmusk for being the man in the arena when it actually counted. 🫡🙏
What is the North Sea physic mkt, and how should the gap between the paper and physical markets be resolved?
Every time I post about the physical market, I see a lot of complaints about why oil prices aren't rising further. Many ppl even criticize me, claiming I’m not explaining things properly.
First, I’ll summarize the basic components of the North Sea market.
ICE Brent Futures: A financially settled paper contract used primarily for broad directional hedging and speculation without the intention of physical delivery.
EFP (Exchange of Futures for Physical): A swap that acts as a bridge, allowing a trader to convert a paper futures position into a physical cargo contract.
Forward Brent: A standardized OTC physical swap for future delivery. It represents actual oil but remains non-dated bc the exact loading schedule is not yet determined.
Dated Brent: The global benchmark price for physical crude. It is assessed daily by agencies like Platts based on actual trades of the most competitive grade within the BFOET+WTI basket, triggered once specific loading dates are confirmed (typically 10-30 days prior).
CFD: A short-term swap representing the price difference between Forward Brent and Dated Brent. It is used to plot the physical forward curve and assess whether the market is in contango or backwardation.
DFL (Dated to Frontline): A swap that links the physical Dated Brent assessment directly to the front-month ICE Futures contract, managing exposure between the physical and financial markets.
Diff (Grade Basis): The premium or discount applied to a specific physical cargo relative to the Dated Brent benchmark. Driven by crude quality, logistics, and refinery demand, this unhedgeable spread is where physical traders generate profit.
This alone should be enough. From there, I’ll explain how the gap between the paper market and the physical market actually closes.
A massive divergence between Dated Brent (physic) and ICE Brent futures (paper) typically indicates acute near-term physical tightness relative to forward expectations.
If Dated Brent remains at $120-130/bbl leading into the expiration of the front-month ICE Brent futures contract (currently around $100/bbl), the futures contract must converge toward the physical price.
The convergence is not optional; it is mathematically enforced by the exchange's settlement rules and market arbitrage. This operates through three primary mechanisms:
1) Cash Settlement via the ICE Brent Index
ICE Brent futures are cash-settled upon expiration and do not involve physical delivery. Expiring contracts are settled against the ICE Brent Index.
The Index is a calculated average of trading activity in the relevant physical Forward BFOET(Brent, Forties, Oseberg, Ekofisk, Troll)+WTI Midland market during the final trading days of the futures contract.
Bc Forward Brent and Dated Brent are intrinsically linked, a physical market sustaining $130 will generate an ICE Brent Index near $130.
Consequently, any futures positions left open at expiration are forcibly settled at this higher Index price.
2) The Arbitrage Channel (EFP Mechanism)
If a $30 spread exists between paper and physical markets, traders will immediately exploit the arbitrage using the EFP mechanism.
Traders buy the undervalued ICE Brent futures at $100 and simultaneously sells a physical Forward Brent cargo at $130. They execute an EFP to swap their long paper futures position into a long physical Forward position.
The newly acquired long physical position cancels out their short physical position, locking in a profit (minus the EFP swap cost). To execute this arbs on a large scale, traders must aggressively buy ICE futures. This massive purchasing volume forces the futures price up until the gap closes and the arb window is eliminated.
3) Forced Short Covering
Market participants holding short positions in the ICE Brent futures market face extreme risk if the physical market disconnects to the upside.
Knowing the contract is destined to cash-settle against a $130 physical Index, paper shorts cannot afford to hold their $100 positions into expiration.
They are forced to buy back their futures contracts to close their positions before the expiry date.
This forced buying—often resulting in a short squeeze—accelerates the upward momentum of the ICE futures price, driving it into alignment with the physical market.
Through the combination of final index settlement and active EFP arbs, the paper market is structurally tethered to physical reality as expiration approaches.
#oott #iran
@WarrenPies@TheStalwart@JavierBlas Duration is key but there was already tightness in 2022 due to muted supply growth with demand exploding for oil and gas prior to the invasion. Analysts were expecting a wave of 3-4 MMBOPD of excess production and $50/bbl prices providing a bit of a shock absorber this time
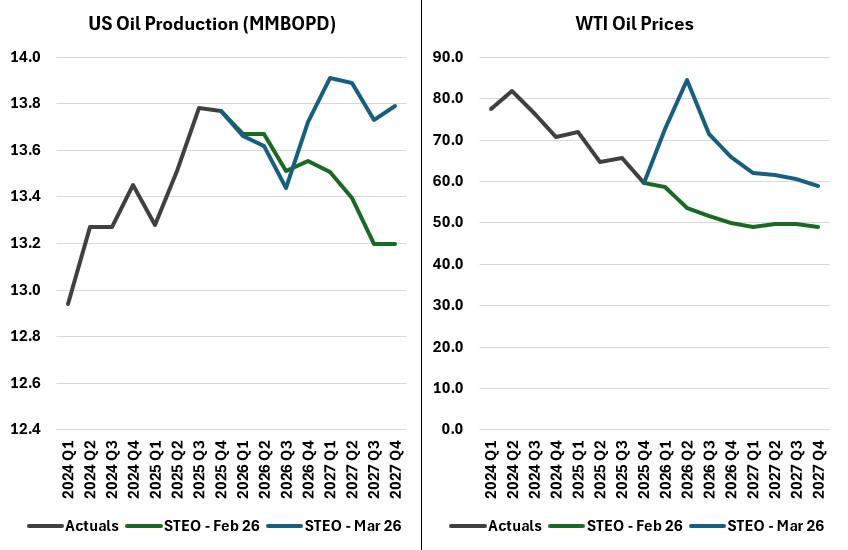
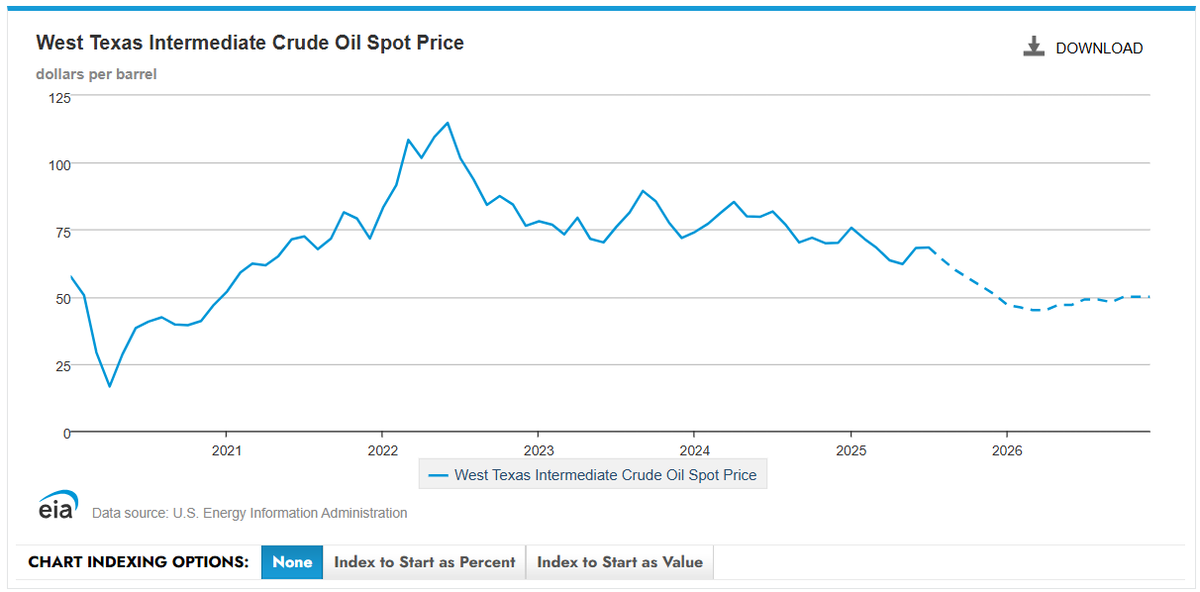
@UndervaluedOnG EIA was previously forecasting oil prices to fall to ~$50/bbl by mid 2026. Now they are saying that the short bump in Q2 prices and $60/bbl will return us to a growth trajectory. The issue is that activity levels aren't as sensitive to pricing upside as they assume here
This is such a chart crime I don’t know where to begin. So China at 28 MMBOPD represents what? You can’t stack annual averages on top of each other. X axis for dates/time periods, Y axis for total volumes, series cuts by country.
Congrats to the Conduit, Diamondback and Granite teams! Excited about what lies ahead. @Diamondback_EP @GraniteRidgeInc @KVanthof https://t.co/J2I9qEAoOn
Congrats to the Conduit Power team as they quickly advance their data center power projects in WY and TX through 300MW+ of Jenbacher engine purchases in partnership with Gruppo AB
https://t.co/6WDyaQa3HD
Production growth since liberation day accelerating to rates not seen since 2022 despite commodity prices and activity levels being almost 40% lower just doesn’t square in my head
@notsageadvice@FT I may not agree with the shorts you choose to wear (especially anything remotely like those in the photo from the article), but I’ll defend to the death your right to wear them. Unless we are asking investors for money
@Jresourceinvest@TeddyGambino Wouldn’t you call the last 18 months a relative plateau since oil production has only grown ~200 MBOPD (~1.5%) while frac spreads have fallen ~30-35% with the steepest declines most recently. Have productivity gains shown that much improvement to offset these declines?
@OilAndGasGOA@dieselfinger@PrimaryVision Missing is increased rig/spread productivity (ft/month). That said, it can’t offset the sheer decline in activity especially with well productivity (bbl/ft) flat to declining. US onshore declines will show up eventually, the bet is will they disappoint vs EIA/IEA expectations
@dieselfinger@OilAndGasGOA Oil and gas companies are reacting to market forces and cutting activity levels (i.e. drilling and fracking) due to unsustainably low oil and gas prices. The Trump administration hasn’t changed these trends despite rhetoric otherwise