My top 2 fintech picks.
Both waiting for the entry.
$SOFI — digital bank with a full banking license.
Entry zone: $10 — $14.
$HOOD — most profitable retail trading platform ever built.
Entry zone: $38 — $63.
Wave (2) is still running on both.
Not yet. But close.
The best trades come to those who wait for the level.
Watching both.
#SoFi #Robinhood #Fintech #ElliottWave #StockMarket
$ORCL this week: +17.54%.
The bottom was called at $136.99. That was Wave (II). Wave (III) just confirmed on the weekly chart.
Here is what Wave (III) means in numbers:
first Target: $688
second Target 2: $819
From $137. That is a 6x.
Oracle is not a legacy tech story. It is the AI cloud infrastructure of the next decade. Every hyperscaler. Every sovereign AI project. The $500 billion AI infrastructure buildout runs through Oracle Cloud.
Larry Ellison did not build a database company. He built the backbone of the digital world. And the wave structure mapped it before the crowd arrived.
Wave (II) was the gift. Wave (III) is the delivery.
$688. $819. Written before the move.
$NBIS
First target reached.
$NBIS hit $196.34. That was the target on the chart.
Posted this structure 1 month ago. The wave count mapped it. The market delivered it.
Today pulling back after the first target. That is not a reversal. That is a wave breathing.
The structure is still intact. The impulse is still running.
Second target: 229$.
Nebius is not a meme. It is the GPU infrastructure backbone for European AI data centers, cloud compute, foundational AI services. The demand is not slowing down. It is accelerating.
Wave (5) does not have to end at the first target.
#Nebius #ElliottWave #AI #TechnicalAnalysis #NASDAQ #AIInfrastructure #StockMarket #TargetReached
$NVDA - the Top is in!
March 29: "$NVDA — Wave (4) in play. Support: $163."
April 22: "The bottom held at $163.53. Wave (4) complete."
The structure called the bottom to the dollar.
Wave (5) delivered from $163 to $235.
The top is now in.
Every 5-wave impulse ends the same way. The crowd chases the final wave. The structure exits.
$260 was the full target. The market ran short. Truncated Wave (5) - a sign of exhaustion, not strength.
Correction is beginning.
This is not the time to buy the dip. This is the time to watch the structure define the next entry zone.
The chart told the story at $163. It is telling the story again now.
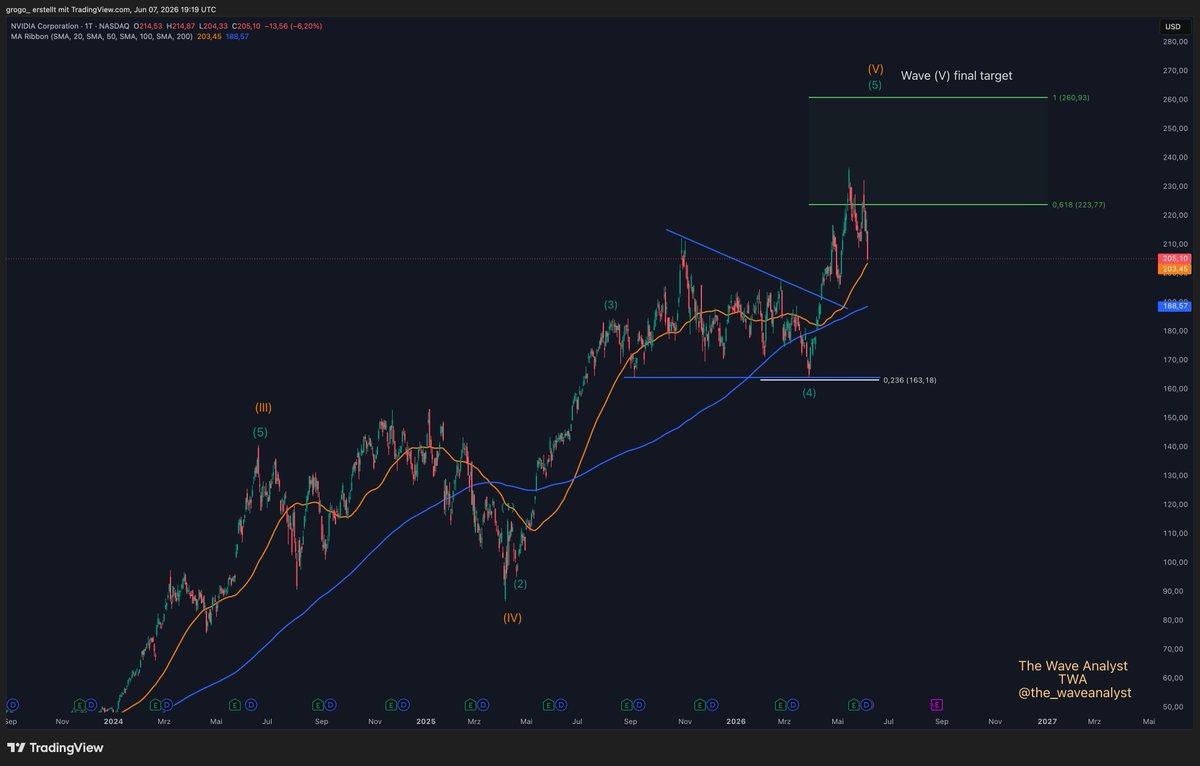
$NVDA
The bottom held. The final target is now defined!
Nvidia dropped 40% from its 2025 peak. Every headline called it broken. Export bans. Tariff fears. Demand concerns.
The structure called the bottom at 163.53.
Wave (4) completed exactly in the Fibonacci zone. The correction is over.
Wave (5) is now running. The final target:
0.618 → 223.77
USD 1.0 → 260.93 USD
This is Wave (V) - the last leg of the entire impulse that began at $88.
NVIDIA is not a trade. It is the physical infrastructure of artificial intelligence. Every H100. Every B200. Every Blackwell chip shipping to Microsoft, Google, Meta and Amazon runs through one company.
The tariff panic was Wave (4) doing its job - shaking out weak hands before the final expansion.
The structure mapped it. The bottom confirmed it.
260 is the target.
What is your price target for $NVDA?
#NVDA #Nvidia #ElliottWave #AI #Semiconductors #TechnicalAnalysis #WaveAnalysis
May 23. $AMD +10%. Crowd buying.
The post said: "This is not the entry. This is the exit zone."
Wave (5) target was $495.28.
AMD hit $546.
Today: -9.63%.
The 5-wave impulse from $55 is complete. Every 5-wave sequence ends the same way - with a correction that erases most of what it built.
Wave II is beginning.
Entry zone: $117 — $208.
The 200 WMA is at $147. Rising. Waiting.
The crowd bought the top.
The structure told the story two weeks ago.
$AMD +10% yesterday. The crowd is buying. I am watching.
The target is reached.
Weekly chart. 5-wave impulse from $55 to $495. Wave (5) target: $495.28. Weekly high this week: $481.
This is not the entry. This is the exit zone.
Every 5-wave sequence ends the same way. Wave (5) completes. Then A-B-C correction begins.
The next great $AMD entry will come from that correction. Not from chasing a +10% candle at the top.
The chart called $55 as the bottom. The chart is now calling $495 as the top.
Patience built the position. Discipline protects it!
$CIFR just printed the most dangerous candle in Elliott Wave theory.
A Wave (B) spike.
Price ripped from $11 to $28.62. Everyone called it a breakout.
It was a trap.
Wave (B) waves exist to shake out the bears and pull in the bulls - right before Wave (C) delivers the final flush.
Entry zone: $6.92 — $10.89.
The 50 MA is rising at $14. The 200 WMA sits at $6. Structure is intact.
When Wave (2) completes in that zone - and it will - Wave (3) launches.
This is a crypto mining stock in a bull cycle for Bitcoin.
The setup is loading. Not here. Down there.
Patience builds positions. Positions build wealth.
$CRCL - -10% today.
Nothing has changed.
Wave (2) correction is delivering the Entry Zone exactly as mapped.
0.618 — $83.26
0.786 — $68.79
0.887 — $60.08
Both moving averages now overhead as resistance. The structure is clean.
Circle issues USDC. The GENIUS Act just made stablecoin regulation federal law. $CRCL is not a crypto company. It is the regulated infrastructure layer of the digital dollar economy.
The thesis does not change because the price drops. The price drop is the thesis working.
The entry zone is almost here. Patience has a price target.
Wenn das Bitcoin Power Law recht behält, befinden wir uns aktuell in einer der attraktivsten Akkumulationszonen der gesamten Bitcoin-Geschichte.
Aktuell schauen sehr viele auf das Bitcoin Power Law Modell. Nach dem jüngsten Abverkauf ist Bitcoin laut der Power-Law-Quantile-Regressionsanalyse auf nur noch 3,9% gefallen.
Was bedeutet das?
Das Modell legt seit 2009 eine logarithmische Wachstumskurve über den Bitcoin-Preis. Anschließend wird analysiert, wie weit der Preis historisch über oder unter diesem langfristigen Trend gehandelt wurde. Daraus entstehen die Quantile.
Ein Wert von 3,9% bedeutet, dass Bitcoin in über 96% seiner gesamten Historie relativ zum langfristigen Wachstumspfad teurer bewertet war als heute.
Historisch waren solche Bereiche meist Phasen extremer Unterbewertung.
Wichtig: Das Modell ist kein Timing-Indikator. Es sagt nicht, dass Bitcoin morgen steigt oder kurzfristig nicht noch deutlich tiefer fallen kann.
Invalidiert würde das Power Law erst dann, wenn Bitcoin über einen längeren Zeitraum nachhaltig unter den unteren Quantil-Bereich fällt und sich dauerhaft vom historischen Wachstumspfad entkoppelt.
Ob das bereits der Boden ist, weiß niemand. Fakt ist aber: Nach dem Power Law befindet sich Bitcoin aktuell in einer der günstigsten Bewertungszonen seiner gesamten Geschichte.
Mein Sparplan freut sich jedenfalls und meine Kauforders sind heiß. Hast du schon wieder zugeschlagen?
$NOW — down 5.83% today. This is exactly what the structure ordered.
Wave II is complete. The A-B-C correction from $245 to $83 is done.
Wave 1 of the new impulse just ran to $140 — then got rejected by the 200 WMA right on cue.
Now Wave 2 is pulling back.
Entry zone: $93.74 — $103.42.
The 50 MA is rising at $99 — directly into that zone.
This is not a broken stock. This is a loaded spring.
Wave 3 target: $200. Wave 5 projection: $250+.
The correction built the base. The base builds the next leg.
Not yet — but close.
$BTC has one playbook.
Crash hard enough to make you sell.
Create enough fear to make you never buy back.
Then explode to a new all-time high without you.
It has done this every single cycle.
This time is not different!
$BTC has one playbook.
Crash hard enough to make you sell.
Create enough fear to make you never buy back.
Then explode to a new all-time high without you.
It has done this every single cycle.
This time is not different!
$SMCI
Wave 1 completed at $51. Wave 2 is now pulling back.
The Entry Zone:
0.5 — $35.41
0.618 — $31.66
0.786 — $26.31
The long term entry was called at $22. This is the opportunity to add.
AI server infrastructure. NVIDIA GPU clusters. Every data center expansion runs through SMCI hardware. The business is not slowing. The wave is resetting.
Wave 2 corrections exist for one reason. To give prepared traders a second entry.
The zone is loading. Watch $30-35.
$BTC — down 19% this week. The structure said this was coming.
Here is what is happening.
Wave (B) topped at $128,000. That was the trap. Everyone called it a new bull market.
The Elliott Wave structure said it was a correction wave.
Now Wave (C) is completing. And Wave (C) is where the real flush happens.
Long-term entry zone: $35,149 — $61,736.
We just broke below $61,736.
We are inside the zone - again
The 50 MA sits at $92,572. The 200 WMA is rising below.
When Wave (2) completes — and it will — Wave (3) launches into territory no one is currently pricing.
This is not a breakdown. This is the setup.
One more low. Then the real move begins.
$ETH — down 22% this week. I know it hurts.
But look at the structure.
This is a W-X-Y-X-Z triple combination correction. Four years in the making. Every wave labeled, every low a stepping stone.
We are now completing Wave (Z) — the final low before Wave (3).
The entry zone: $937 — $1,673.
We are already inside it.
This is not a breakdown. This is the accumulation zone the chart has been building toward since 2022.
The 50 MA is at $3,039. The 200 WMA is at $2,470. Both are overhead — the target when Wave (3) launches.
Hard days are where positions are built.
The structure hasn't changed. Only the price has.
$HIMS — 3 days ago the post said:
"Wave (ii) bounces are the most dangerous moves in Elliott Wave. They look like reversals. They attract buyers. Then Wave (iii) arrives."
Today: -10%.
This is Wave (iii).
The structure hasn't changed. The path hasn't changed.
The accumulation zone is still $8.24 — $15.60.
The bounce was the trap. The buyers at $33 now know.
This is why you read the chart, not the sentiment.
$HIMS — the rally feels like recovery.
The structure says it is Wave (ii).
Wave (ii) bounces are the most dangerous moves in Elliott Wave. They look like reversals. They attract buyers. Then Wave (iii) arrives.
Resistance: $33.41. The 0.382 Fibonacci. The 200-week MA. The ceiling is right above.
The thesis has not changed.
One more low is needed.
Accumulation Zone: $15.60 — $8.24
That is where Wave (C) completes. That is where the real position gets built.
$HIMS has a great business. The FDA disruption created the wave. The wave has not finished yet.
The patient trader waits for the zone. Not the bounce.
$NIO update.
The B wave was called as resistance at $7.00. It rejected there exactly. Wave C is now in motion.
Both moving averages have flipped overhead. The 50 MA at $6.08. The 200-week MA at $5.88. Both now resistance. Not support.
The entry zone is still in play:
0.618 — $4.93
0.786 — $4.09
98% delivery growth last quarter. 112% revenue growth year over year. The business is not broken. The wave is not done.
$7.00 was the trap. $4.09 — $4.93 is the opportunity.
The thesis has not changed since May 5th. Patience remains the strategy.