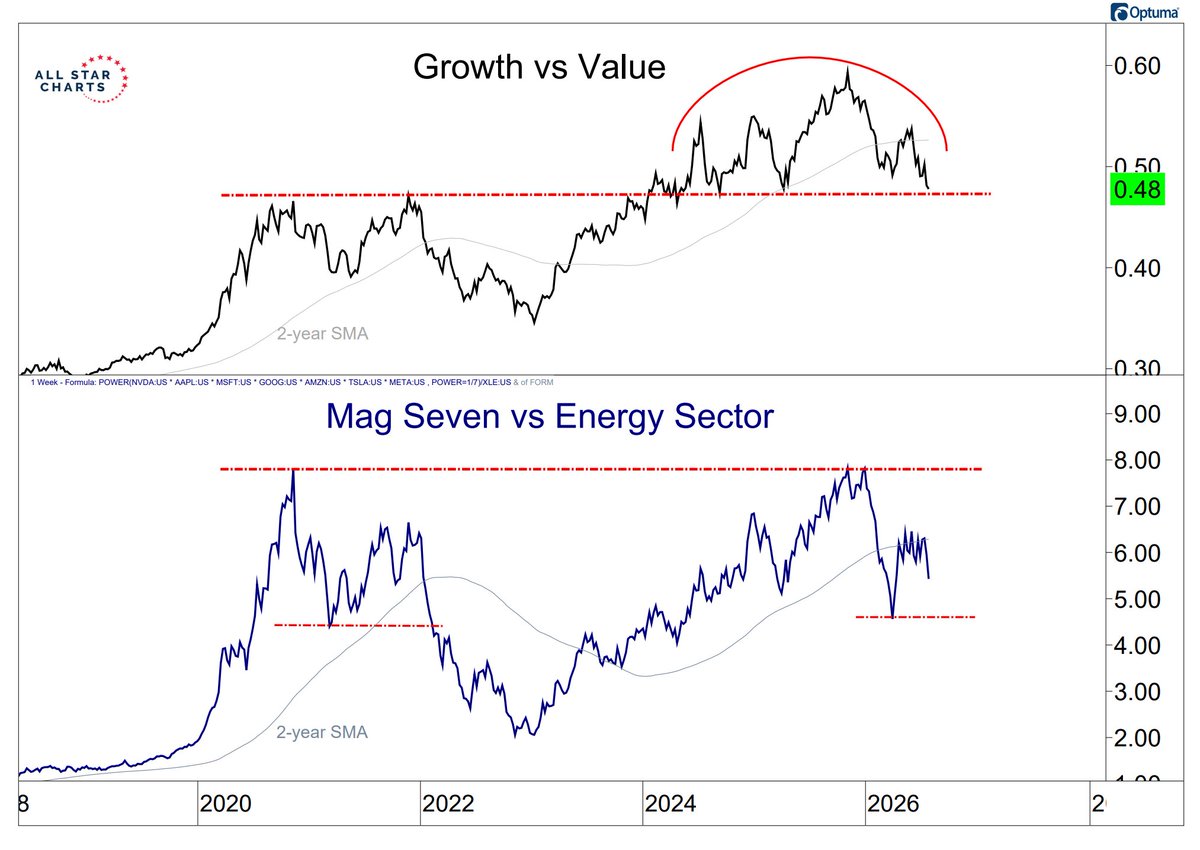
Today's Chart of the Day was shared by @nullcharts
Continued deterioration in these ratios would mark a major shift away from the leadership that’s defined this bull cycle.
Get the full breakdown in today's report plus more great charts. ⬇️
https://t.co/ivRdtnRkUd
Today's Chart of the Day was shared by @FusionptCapital
The inflation trade has re-emerged, with crude oil, gasoline, agricultural commodities, and the U.S. 30-Year Treasury Yield all gaining momentum over the past week.
Get the full details in today's report plus more great charts. ⬇️
https://t.co/sM7K0WSlRg
If the ratio breaks above that multi-year range, it's official: equal-weight software beats cap-weight. 🚀
That means the rally is broadening — money flowing beyond mega-caps into the whole sector. 🌊
Stock picker's market = activated. 🔥
The U.S. Dollar Index is breaking out of a bull flag this morning after refusing to fall back below the $100 level.
Read the full note in today's Morning Print. 🌤️
https://t.co/OwjvQriyTB
It's a stock pickers market for software, as the Equal Weight Software ETF is attempting to complete a multi-year base relative to its cap-weighted counterpart.
@JSpitTrades
Almost half of S&P 500 stocks are outperforming the index this year, the highest amount since 2022.
Link to the full article: https://t.co/QHcMNZg663
@callieabost
Today's Chart of the Day was shared by @ChartMonitor
Positioning has become increasingly bearish, highlighted by the 21-day moving average of the total Put/Call Ratio climbing to its highest level since April.
Get the full breakdown in today's report plus more great charts. ⬇️
https://t.co/1m4Umkz1rm