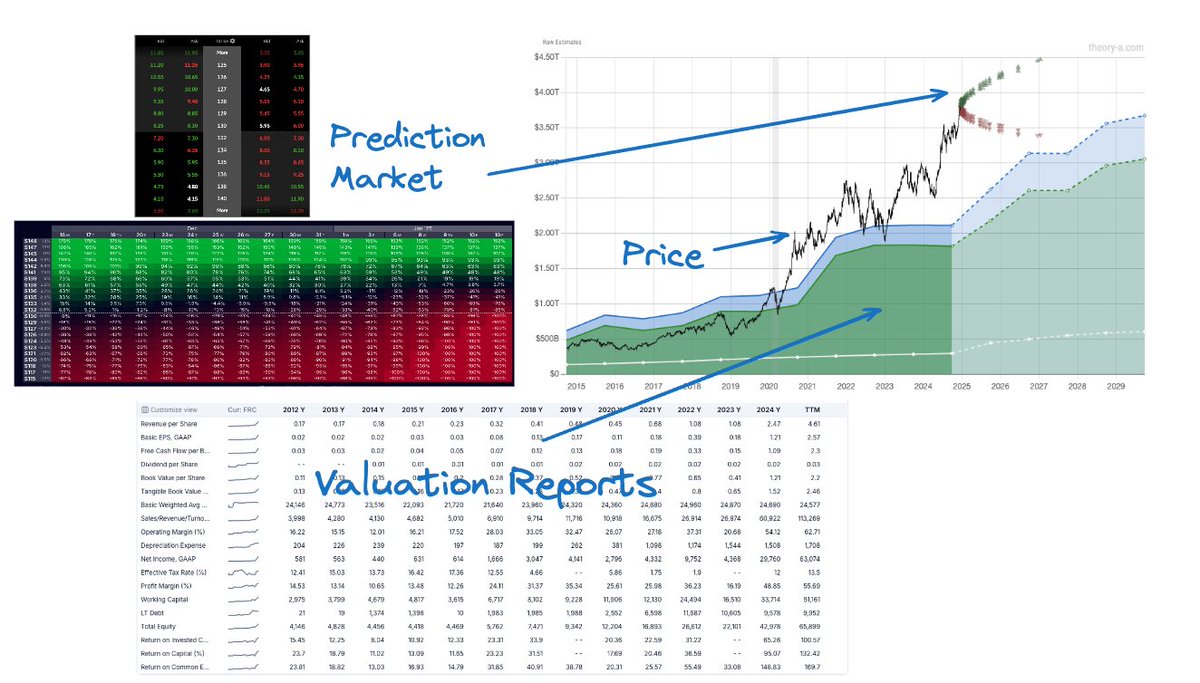
Many financial tools slam you with tons of data and a narrow view that give investors a microscope rather than binoculars.
Just like the line chart revolutionized days of spread sheet analysis into a scan of the eyes, there are alternative visualizations that compress data in ways that unlock new insights
#options #OptionsTrading #Optionselling #stocks #investing
@snwy_me 'dollars' are assets though (they are bank bonds/IOUs), you should always have a rough idea of what % of your portfolio they make up
the ideal is not 0% the same way the ideal car is not the lightest fastest one w no suspension
Markets are efficient in that they process information however there is a limit to how fast they can digest information and also, they consume a lot of noise in addition to the signal
These two games overlap over each other. Value investors approach it like art collecting while traders optimize the markets themselves.
One wants to accumulate assets, the other sees it as a buy-in to a poker game and a risk to manage
@buccocapital this seems to say more about the author, there is implied high status gatekeeping about knowing about all potential discoveries and being a valid judge of their importance to humanity
@dailydirtnap doesn't the way that the fiscal responsibility is being increased actually increase the risk premia from would-be lenders?
taken as a whole it feels like treasury demand should decrease
@paulg this layer will eventually be commoditized too imo.
startup efficiency also comes from 'no man is a prophet in his own land'. the external POV/agency breaks through internally focused deadlocks and context blindness
@kylascan a 'demonic' aspect often missed is that the difference between exponentials is also exponential
e.g. boomer wealth is always just X years ahead, but the absolute difference in wealth grows exponentially
this is a byproduct of democratized exponential growth & math, not malice
@growing_daniel other countries print even more (gpt “dollar milkshake theory”). the main benefit is that the cost of US printing is spread over the whole world since US treasuries and US dollars underpin the other currencies (the “exported inflation”)
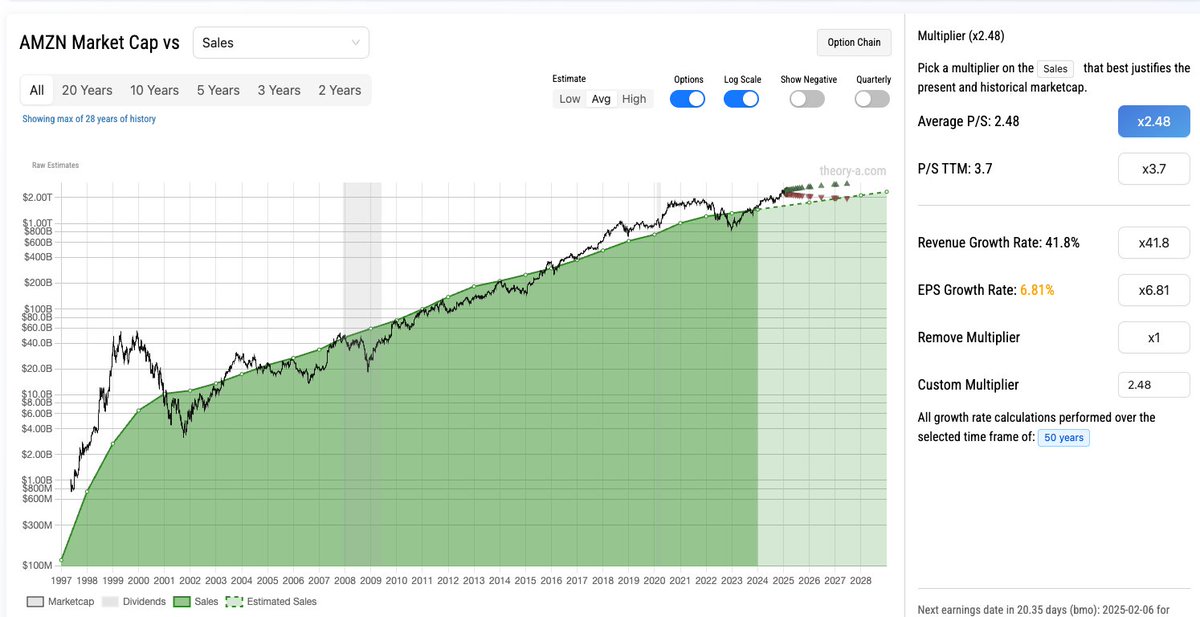
@TaviCosta Using $AMZN and a log chart as an example we can see a huge crash in the 2000s, but the current levels aren't that crazy (though still elevated) b/c there is actual supporting revenue
Another way to interpret is that the dot com pricing was 20+ years too early
@morganhousel something has to load-bear collective dissatisfaction, smaller problems have less load bearing capacity while wars or satan have limitless capacity
why base line dissatisfaction exists and cannot be zero is another thing... probably related to death/entropy or sth
@kylascan IMO it's kinda weird that tiktok seems to enable more expression-of-humanness than Meta's products
both are obviously going to leverage AI as best they can and are beholden to different entities to different degrees but there's a vibe shift...
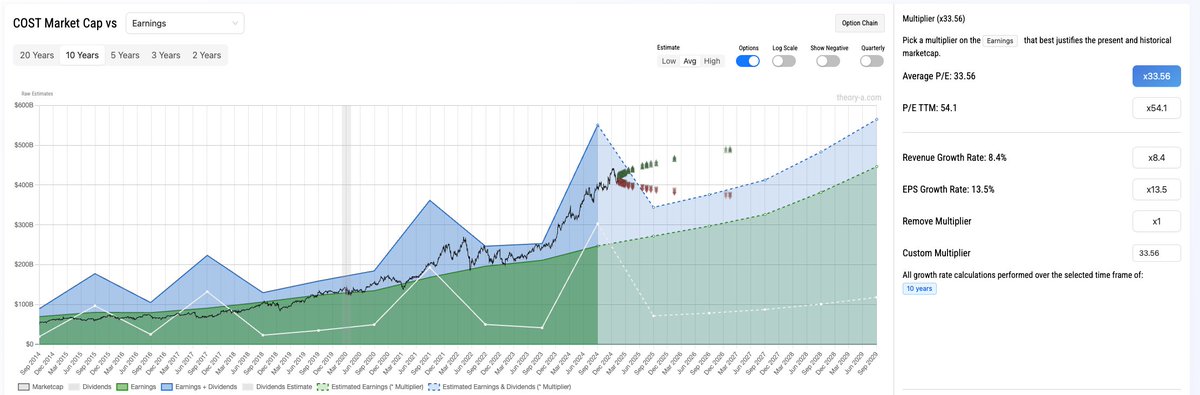
There's a very good visualization technique for P/E which is to show earnings and market cap on the same y-axis
Here below we can see that $AAPL 's earnings growth hasn't kept pace with its price appreciation which causes P/E expansion.
The price is dislocated *above* a sensible multiple.
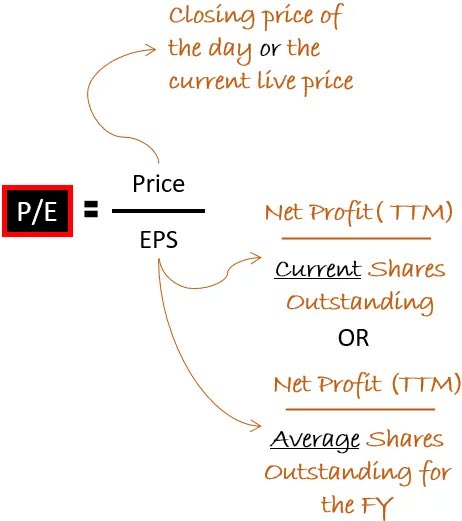
93% of fund managers use PE multiples for valuation, yet most investors don’t really understand it.
PE ratio isn’t just based on growth.
There are 5 key factors implicit in PE ratio, let me explain: 🧵