$BTC This 2024 chart aged well. 6 October 2025 was indeed the peak of the 2022- 2025 cycle as predicted.
If my estimation is right, the bottom of the current bear market would be somewhere end Sept 2026 +- 1 week.
The $BTC 4 year cycle remains intact until proven otherwise
Even though an ascending triangle has a bullish bias, it is just a bias. It should not be used as a predictive pattern to build bullish case until a clear breakout confirms the pattern.
$BTC This 2024 chart aged well. 6 October 2025 was indeed the peak of the 2022- 2025 cycle as predicted.
If my estimation is right, the bottom of the current bear market would be somewhere end Sept 2026 +- 1 week.
The $BTC 4 year cycle remains intact until proven otherwise
I don't really do time analysis on $BTC but this is just an observation:
2013 peak to 2017 peak = 1470 days
2017 peak to 2021 peak = 1428 days
2021 peak to 2025 peak = ?? days
Assuming 1400 days, the current bull run may end around August-Sept 2025
A more detailed analysis here:
No. of days between each peak...
No. of days in the bear market...
No. of days in the bull market...
All pointing to roughly Aug-Nov 2025 for this cycle's PEAK.
An oversold RSI is usually a signal to buy IF and only IF you are certain BTC is still in a bull market.
However, if it is pivoting into a bear market, RSI in the oversold region is alarming and can continue to remain oversold as price continue to plunge.
@Daz_0x@shanesek1@Pickle_cRypto You can't refute $69k was the peak in 2021, this is a fact. Could you share a better "theory" than the 4 year cycle?
And also, all these forecasting/predictions/analysis you cannot expect it to be right on the dot. It is not a crystal ball.
https://t.co/0TpAvulZND
A more detailed analysis here:
No. of days between each peak...
No. of days in the bear market...
No. of days in the bull market...
All pointing to roughly Aug-Nov 2025 for this cycle's PEAK.
It's looking very good here.
There is so much confluence shaping up for us to bottom over the next week, if we haven't already.
Lots of people asking me what a "BTC Cycle low" is.
Little explainer for you.
Bitcoin has daily and weekly cycle lows.
These are timeframes in which the price action goes through cycles from lows to highs, and back to lows.
Daily cycle is around 45 days to 70 days, but i dont pay much mind to that one personally.
I focus more on the weekly cycle as this gives us a much bigger and accurate picture of the overall HTF.
As you can see, each Weekly cycle low(blue arrow) happens around 30 weeks apart, or 210 days.
Since the start of this run, its been really accurate and very telling.
And we just hit the 210 day window for the next weekly cycle low.
In addition, the red arrows are peak highs after cycle lows.
This is something I have more just monitored myself rather than a rule...
But you can see they peak at highs before a drop between 68d and 98d after the weekly cycle low is put in.
If we follow the same trend, we will be putting in out next high in Feb 2026, and our next weekly cycle low in June 2026.
I do not focus on one particular indicator to perform my analysis.
We now have:
- Weekly cycle low
- Death cross 1D
- Bitfinex Whale long ratio
- Unrealised profit and loss levels
- Extreme fear sentiment
Whilst holding HTF structure.
Bottom is very close.
Almost 2 months later and nothing has changed. Zoom out and look at the bigger picture.
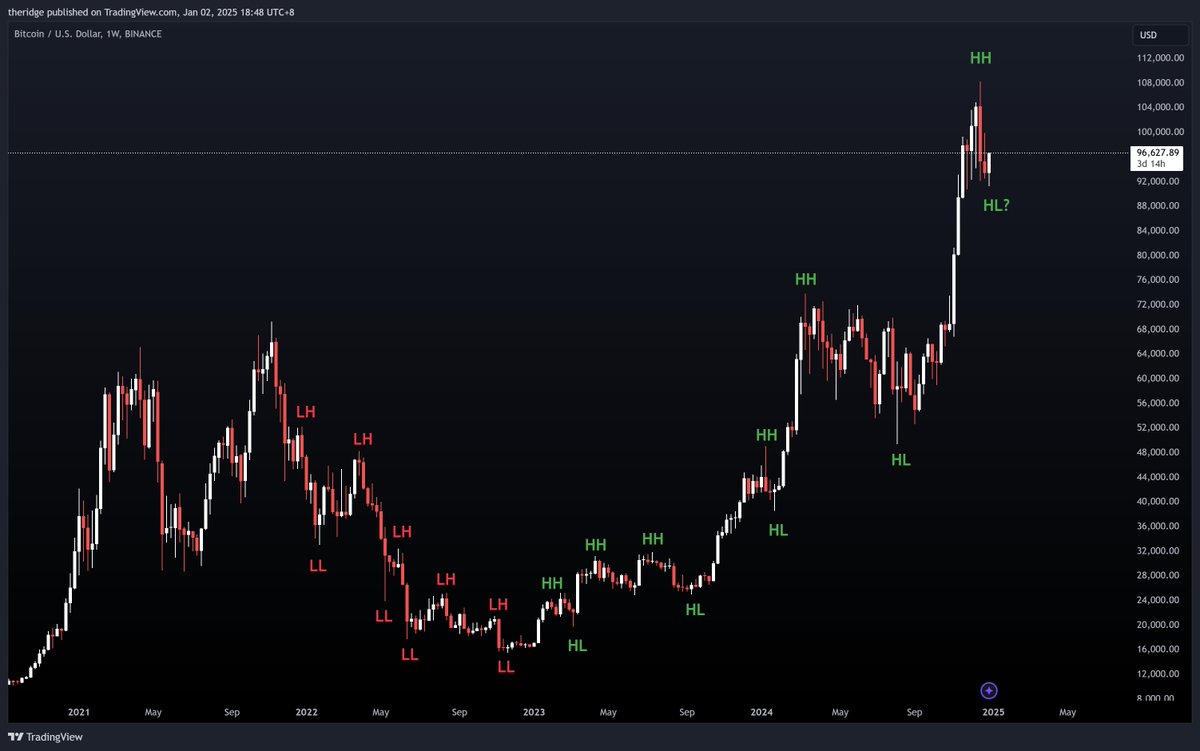
$BTC likely to continue making higher highs and higher lows on high time frames
People panicking over a mere 15% drop when there were multiple 20-30% drops in previous cycles
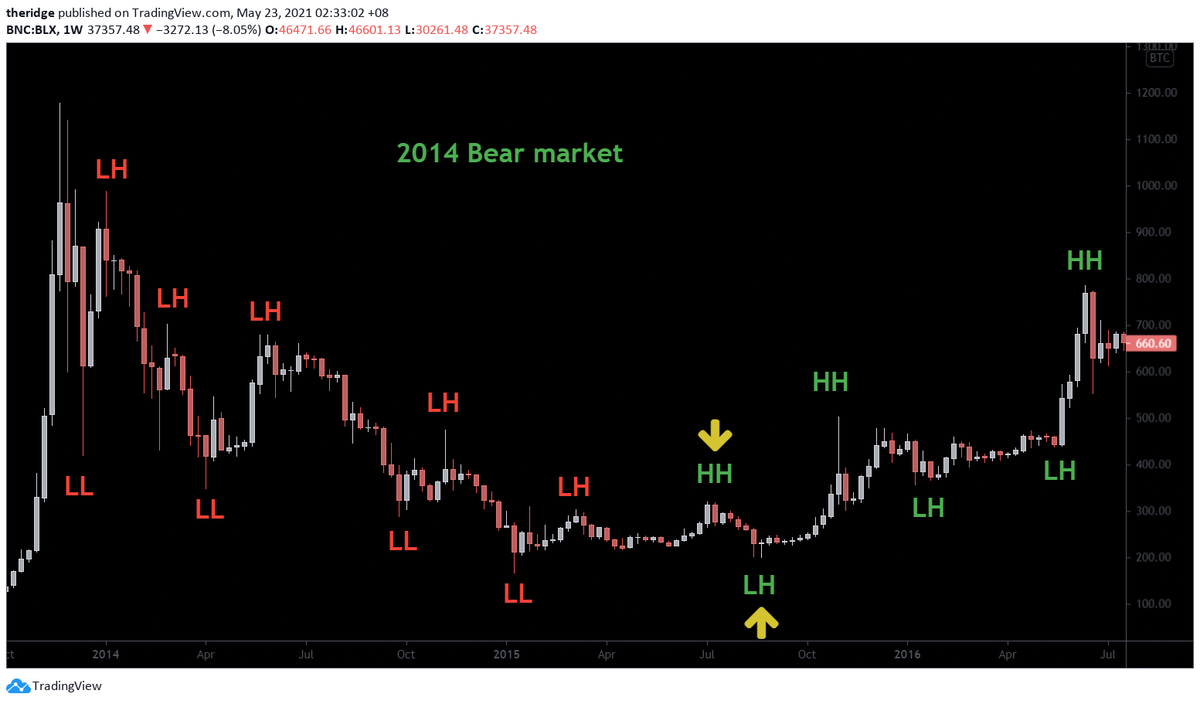
How to identify a bear market?
- Lower highs followed by lower lows on HTF
How to identify a bull market?
- Higher highs followed by higher lows on HTF
A more detailed analysis here:
No. of days between each peak...
No. of days in the bear market...
No. of days in the bull market...
All pointing to roughly Aug-Nov 2025 for this cycle's PEAK.
1/
MicroStrategy loses $0.496 BILLION per year.
In just 359 days, they must pay $522M to their investors.
Their liquid cash on hand: $48M.
Their plan to avoid bankruptcy is genius - or catastrophic:
🧵
Patience is key.
Bitcoin always goes up with several pullbacks often mistaken to be the "top".
And the Bitcoin 4-year cycle is still intact until proven otherwise.
https://t.co/3GXmSrSC5V
Vaneck predicts that the cryptocurrency bull market in 2025 will reach a mid-term peak in the Q1 and a new high in the Q4; Bitcoin will reach a maximum of $180,000, Ethereum will exceed $6,000; SOL and Sui will exceed $500 and $10. After the first peak, BTC is expected to experience a 30% retracement, and altcoins will face a sharp drop of up to 60% as the market consolidates in the summer. https://t.co/NuGpiuZ6i0
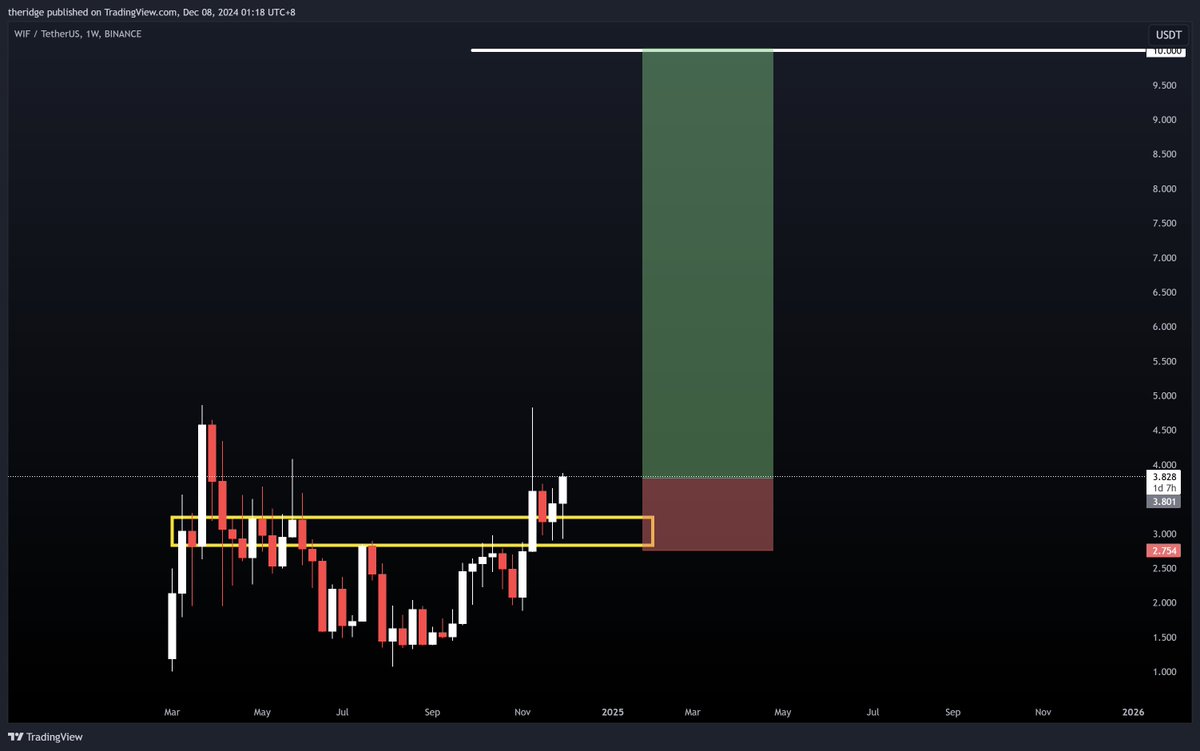
Bought a small bag of $WIF at $3.8 here.
Textbook support/resistance flip with price bouncing of this level and we also have BTC dominance dropping. Not sure how high this goes but will just let it run.
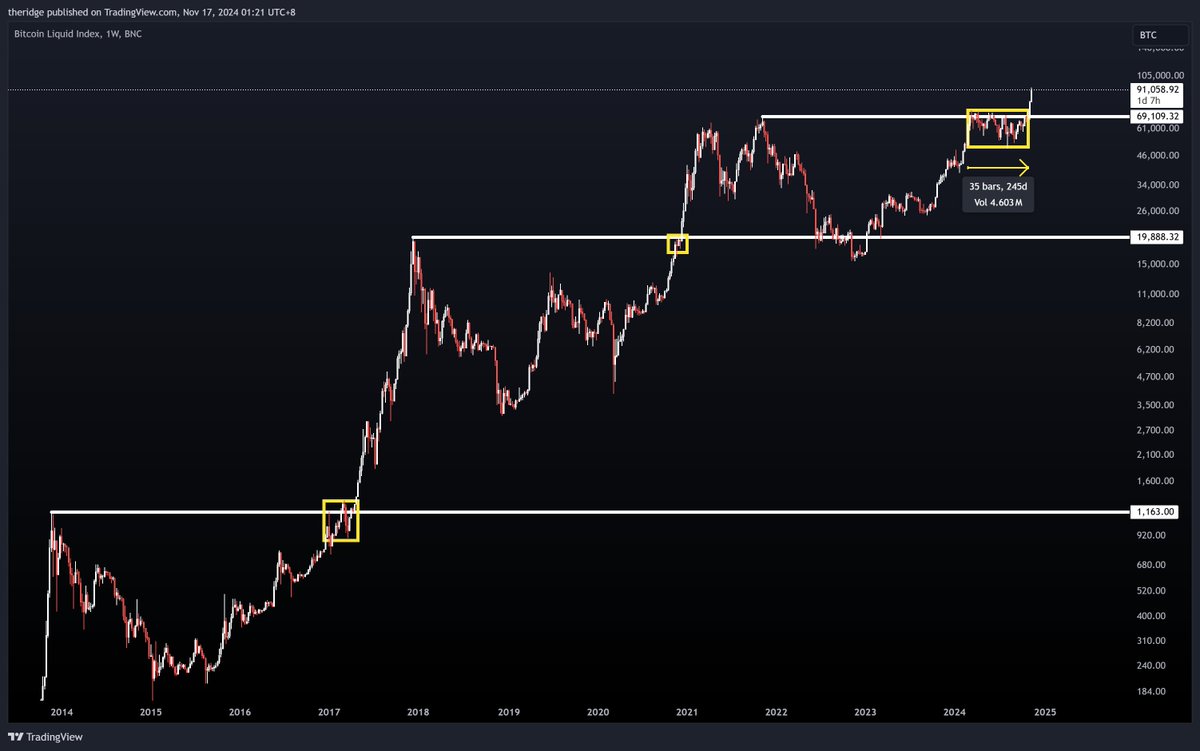
Hard to imagine it's possible some people look at this $BTC chart and think this time could be different, I better derisk. Markets are cooked.
Don't get me wrong, ANYTHING can happen...but really, unless you know something everyone else doesn't know, and I mean some real alpha which somehow isn't priced in but means the market is going to implode in the coming days, then you are kinda forced to agree the probability is we go up only for a bit and long exposure is the sensible position to be in right now.
We wait literal years for these times and even bulls don't seem bullish enough
Now I've said this, cue el dump
$BTC have always consolidated around previous ATHs as seen in 2017 and 2020 before continuing much higher.
Be patient. The road to financial freedom is never smooth sailing.