I wish there was a free indicator that showed interesting locations together with timing periods where price often inverses (blue vertical zone).. Oh wait.. "Basics" to the rescue! (link in reply). Thanks to @StrayDogTrading for the timing concept
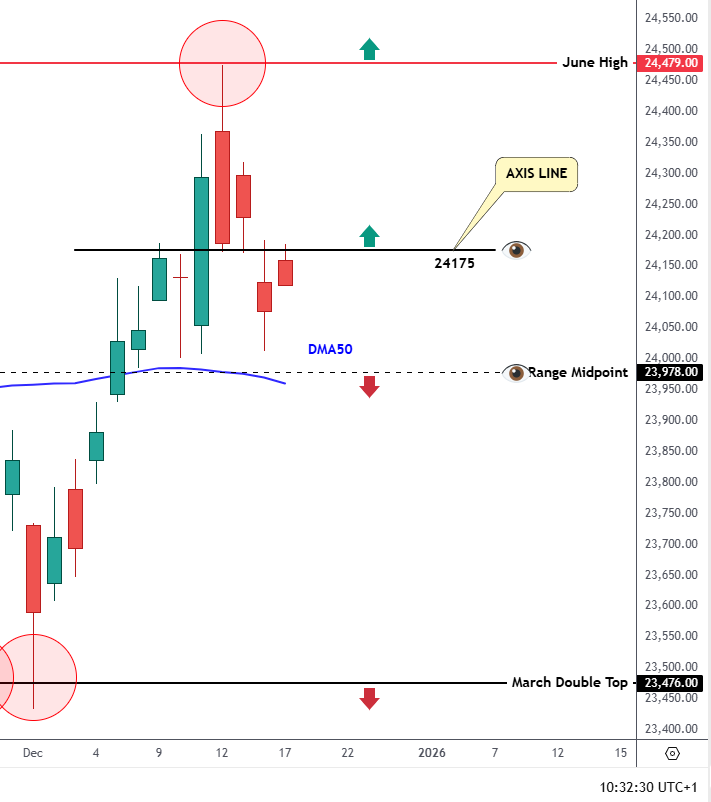
DAX INDEX Daily chart: Zooming on the December move. Low and High on major levels (in use for months), AND the AXIS LINE in play for the past several days.
"Some of the most useful axis lines appear on daily charts." - wrote David H. Weis, in his book Trades About to Happen.
CPI-RELEASE TODAY: I will TRADE LIVE, as per your request.
I will try and jump into the move after the release, hence the start time. I will explain what I am doing on stream.
No financial advice. https://t.co/u3j7mO1lua
Following on the quoted comment:
▪️Setups Gallery is a tool that - without false modesty - nobody else on the Internet have. There are examples of previous two swing lows posted on the feed today: Dec Low and the Low from Monday, Jan 13th.
▪️FIVE YEARS of every trading day on German DAX are covered, with so far 2203 screenshots. Around 60% of this are small TF. I will add more (January so far) tomorrow.
▪️Usage: 1) finding any given day, like ECB days, FOMC, CPI, NFP, Trend Up, Trend Down days; OpEx days, etc... - for studying; 2) learning setups AND reinforcing your conviction to entry on repetitive setups, by seeing them work over and over again, in hundreds of examples.
▪️ Is it free? No. Is it expensive? Not really. It is just a part of the things that are reserved for Subscribers of DAILY DOSE OF DAX. Details at:
https://t.co/byZxzbw28r