HashMap is the one DS technique that saved most of my interviews.
im genuinely bad at DSA, i dont even grind leetcode
but I’ve cleared a lot of easy–medium interview questions just by solving in hashmaps
most problems are solvable with hashmaps, and even when they can’t, they’ll still take you far ahead for finding the solution
and these are the things i prepare when i have interviews
> hashmaps
> two pointers
> sliding window
> recursion/ backtracking
> binary search
Most engineering teams screw up messaging because they don’t understand one thing:
Streams hold truth.
Queues do work.
When you get this wrong, your system bleeds.
I’ve seen $10M mistakes from teams who dump everything into queues:
“Just push the order to a queue and process it!”
Most Queues delete messages after work is done.
No history. No replay. No audit.
Just pain and guesswork.
On the other side, some teams fall in love with Kafka:
“We’ll stream EVERYTHING!”
Here’s the rule I wish someone told me early:
If the event changes the business → Stream
If the message is an action to perform → Queue
Streams = OrderPlaced, PaymentAuthorized, InventoryReserved
These are immutable facts.
They must be durable, replayable, ordered, and auditable.
Queues = SendEmail, CapturePayment, GenerateInvoice
These tasks exist temporarily.
They matter NOW, not 6 months from now.
Event enters the stream → workers derive jobs → queues execute tasks
Ledger first.
Assembly line second.
Everything else is technical debt disguised as cleverness.
𝗔𝗣𝗜 𝗚𝗮𝘁𝗲𝘄𝗮𝘆 𝘃𝘀 𝗟𝗼𝗮𝗱 𝗕𝗮𝗹𝗮𝗻𝗰𝗲𝗿 𝘃𝘀 𝗥𝗲𝘃𝗲𝗿𝘀𝗲 𝗣𝗿𝗼𝘅𝘆
Regarding a system design, we often need clarification about the roles of a Load Balancer and an API Gateway. Most of our resources are about their implementation rather than real-life use cases.
𝗔𝗣𝗜 𝗚𝗮𝘁𝗲𝘄𝗮𝘆
It sits between a client and a group of backend services. It acts as a reverse proxy, accepting all application programming interface (API) calls, aggregating the services needed to fulfill them, and returning the appropriate results.
User authentication, rate limits, and statistics are typical duties that API gateways handle on behalf of an API service system. Also, the API gateway can handle faults (circuit breaker) and log and monitor.
𝗟𝗼𝗮𝗱 𝗕𝗮𝗹𝗮𝗻𝗰𝗲𝗿
It is a service that distributes incoming traffic across many servers or resources. Usually, we have two or more web servers on the backend, and it 𝗱𝗶𝘀𝘁𝗿𝗶𝗯𝘂𝘁𝗲𝘀 𝗻𝗲𝘁𝘄𝗼𝗿𝗸 𝘁𝗿𝗮𝗳𝗳𝗶𝗰 𝗯𝗲𝘁𝘄𝗲𝗲𝗻 𝘁𝗵𝗲𝗺.
Its primary purpose is to use resources optimally. A more equal task allocation and increased capacity can enhance the system's responsiveness and reliability.
There are three load balancers at a high level: hardware-based, cloud-based, and software-based.
𝗥𝗲𝘃𝗲𝗿𝘀𝗲 𝗣𝗿𝗼𝘅𝘆
A server sits in front of backend servers and forwards client requests to them. Reverse proxies are typically used to enhance security, performance, and reliability.
A reverse proxy receives a request from a client, forwards it to another server, and returns the response to the client, giving the impression that the first proxy server handled the request. These proxies ensure that users don't access the origin server directly, giving the web server anonymity.
They are usually used for Load balancing, where we need to handle incoming traffic so we can distribute it across multiple backend servers, or for caching.
So, the main thing that differs these two is that an 𝗔𝗣𝗜 𝗚𝗮𝘁𝗲𝘄𝗮𝘆 𝗶𝘀 𝗳𝗼𝗰𝘂𝘀𝗲𝗱 𝗼𝗻 𝗿𝗼𝘂𝘁𝗶𝗻𝗴 𝗿𝗲𝗾𝘂𝗲𝘀𝘁𝘀 to the appropriate service and it handles requests for APIs, while a 𝗟𝗼𝗮𝗱 𝗯𝗮𝗹𝗮𝗻𝗰𝗲𝗿 𝗶𝘀 𝗳𝗼𝗰𝘂𝘀𝗲𝗱 𝗼𝗻 𝗱𝗶𝘀𝘁𝗿𝗶𝗯𝘂𝘁𝗶𝗻𝗴 𝗿𝗲𝗾𝘂𝗲𝘀𝘁𝘀 𝗲𝘃𝗲𝗻𝗹𝘆 between a group of servers and handles requests that are sent to a single IP address, which works at protocol or socket level (TCP, HTTP).
Some 𝗲𝘅𝗮𝗺𝗽𝗹𝗲𝘀 of API Gateways are Amazon API Gateway, Ocelot (.NET-based), Tyk, or Apache APISIX, while Load Balancers are Azure Load Balancer, HAProxy, or Seesaw.
An example of reverse proxy services is 𝗔𝗽𝗮𝗰𝗵𝗲 𝗣𝗿𝗼𝘅𝘆, 𝗡𝗴𝗶𝗻𝘅 𝗼𝗿 𝗜𝗜𝗦 with additional modules (Url Rewrite).
Application handled 10K concurrent websocket connections perfectly. Scaled to 50K connections and Redis started throwing OOM errors.
The investigation:
- Redis configured with 2GB memory
- Each connection stored session data
- Session data: 50KB average per user
- Math: 50K users × 50KB = 2.5GB
- Redis couldn't fit all sessions in memory
- Started evicting old sessions
- Users randomly logged out
The architecture problem:
- Used Redis as cache with eviction policies
- Treated it like persistent storage
- Didn't account for memory per connection
The solution:
- Moved session storage to DynamoDB
- Kept only active session IDs in Redis
- Reduced memory per connection from 50KB to 200 bytes
- Same 2GB Redis now handled 200K connections
When scaling, every data structure needs a per-user cost analysis. 1KB per user is fine at 1000 users. It's 1GB at 1 million users.
Most companies talk about AI agents in theory.
@bookingcom shipped one that handles thousands of customer conversations per day. Here's what they built:
Their autonomous agent helps accommodation partners respond to guest inquiries faster and more accurately. The agent can suggest pre-written templates, generate custom responses, or intelligently step aside when it shouldn't answer (𝘸𝘩𝘪𝘤𝘩 𝘪𝘴 𝘴𝘶𝘱𝘦𝘳 𝘴𝘮𝘢𝘳𝘵).
It already processes 𝘁𝗲𝗻𝘀 𝗼𝗳 𝘁𝗵𝗼𝘂𝘀𝗮𝗻𝗱𝘀 𝗼𝗳 𝗺𝗲𝘀𝘀𝗮𝗴𝗲𝘀 𝗱𝗮𝗶𝗹𝘆 out of ~250,000 total partner-guest exchanges. Plus early results are giving 70% boost in user satisfaction, fewer follow-up messages, and significantly faster response times.
The agent uses @weaviate_io for semantic search of response templates. When a guest message comes in, the system:
• Embeds the message using MiniLM (chosen after testing multiple models for recall@k performance)
• Performs k-nearest-neighbors search in Weaviate to find the 8 closest matching templates
• Filters results with a similarity threshold to avoid weak matches
• Returns semantically relevant templates that match the 𝘮𝘦𝘢𝘯𝘪𝘯𝘨 of the question, not just keywords
They stream template updates in real-time via Kafka, so the Weaviate index always reflects the latest partner content. No stale data.
The full system runs on Kubernetes with:
- LangGraph as the agentic framework
- FastAPI for the web layer
- GPT-4 Mini for reasoning (via internal LLM gateway with prompt-injection detection)
- Multiple tools: Weaviate for template search, GraphQL for property details, reservation data retrieval
The honest assessment in their blog post really reflects the current state of building agents: complex agentic systems get expensive fast in both latency and compute cost. They had to think about efficiency from day one, not as an afterthought.
𝗧𝗵𝗶𝘀 𝗶𝘀 𝗽𝗿𝗼𝗱𝘂𝗰𝘁𝗶𝗼𝗻 𝗔𝗜 𝗶𝗻𝗳𝗿𝗮𝘀𝘁𝗿𝘂𝗰𝘁𝘂𝗿𝗲 𝗮𝘁 𝘀𝗲𝗿𝗶𝗼𝘂𝘀 𝘀𝗰𝗮𝗹𝗲 𝘁𝗵𝗮𝘁 𝗶𝘀 𝗮𝗰𝘁𝘂𝗮𝗹𝗹𝘆 𝘄𝗼𝗿𝗸𝗶𝗻𝗴 𝘄𝗲𝗹𝗹, and it's cool to see Weaviate powering the semantic search layer that makes the whole thing function 😄
Full technical deep-dive from the https://t.co/Lxuo6LzfBm team: https://t.co/vCNWIU5GT6
Database System development will make you realise that 1 millisecond is actually a really really really long time
~300 tx/ms TigerBeetle vs 1 tx/ms PostgreSQL
https://t.co/p8IXExzLIu
Don’t overthink it.
• Host a website on S3 + CloudFront
• Deploy a web app on EC2
• Build a Serverless API with Lambda + API Gateway
• Set up an RDS instance for your data
• Automate backups with S3 Lifecycle rules
• Monitor apps using CloudWatch dashboards
• Build a URL Shortener using DynamoDB + Lambda
• Configure a custom domain with Route 53
You don’t learn AWS by watching videos.
You learn it by building in the cloud. ☁️
I've migrated the first application to Spring Boot 4. The two things that I had to change were both releated to testing.
First, I had to add the WebMVC test dependency:
<dependency>
<groupId>org.springframework.boot</groupId>
<artifactId>spring-boot-starter-webmvc-test</artifactId>
<scope>test</scope>
</dependency>
Then @WithMockUser stopped working in combination with MockMVC and Webclient. There, I had to add springSecurity() to the config.
WebClient webClient = MockMvcWebClientBuilder.webAppContextSetup(context, springSecurity()).build();
Other than that everything works! Great job Spring Team!
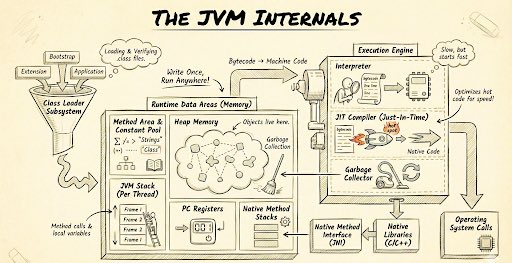
The JVM internals series is growing 👇
The JVM Internals - Basics (Episode 1)
https://t.co/VfwoeYPwzY
JVM Internals: Heaps, Stacks, Program Counters and more
https://t.co/rF6fs6pEib
Peek into your Class file? JVM Internals
https://t.co/BVGk0AkFEC
How is memory allocated on the heap?
https://t.co/EMa5QbtGHB
JVM Internals - Garbage Collection Types and Their Internals
https://t.co/Ta0XsecJZa
How do Garbage Collection Algorithms work?
https://t.co/78raem7E1m
Are Garbage Collection Algorithms Complex?
https://t.co/PJ7knUjPNc
G1GC - Low Latency High Throughput Garbage Collector
https://t.co/tVqdav11mV
ZGC : The Java Garbage collector explained
https://t.co/7nzKJiNFdJ
Please join the membership to watch the full series and get access to other member-only playlists 🚀
Databricks dropped a paper that basically says "Kafka sucks".
It's titled "Understanding the Limitations of Pubsub Systems" and was released this year in May. It argues that modern pub-sub systems:
❌ fail to achieve their goal of truly decoupling writes and readers
❌ violate the end to end principle
❌ expose an ad-hoc storage abstraction with a bespoke API and limited power
All of this traces back to their architectures. They bundle a storage abstraction and a messaging abstraction into one system.
This forces you to use their (limited) storage system in order to gain messaging.
The paper proposes unbundling these in order to fix these problems.
Before we focus on what they propose, let's quickly double click on the problems👇
🛑1. Silent Dropping of Messages
Messages can be deleted without any notification to the reader.
Kafka, for example, stores messages with a time-based retention SLA. Any message older than N hours/days is deleted.
Consumers literally have no idea that their unconsumed messages are gone.
This means large message backlogs are basically indistinguishable from silent outages. 🚨
If the backlog is too large, the messages are lost and that’s an outage - it's data loss from the PoV of the consumer
🛑2. Inefficient APIs
There's also no way to catch up to the latest data efficiently.
Even if you fix the silent deletion problem with infinite retention (e.g store it all in S3), the API to consume the log is inefficient. It can take hours/days to process.
You need something like snapshots to reprocess all that data efficiently.
Pub-sub systems do not give you that.
🛑3. Key-based Compaction is Broken (too)
While key-based compaction can reduce reprocessing times (there are less messages), it suffers from the same two problems.
• Duplicate key deletion (deduplication) is silent. The consumers may not see all updates and that can break some logic.
• The time-based retention SLA can still drop messages silently during large backlogs.
🛑4. Partitions Suck
This is a big one. Kafka couples consumer message assignment to its storage model.
In Kafka, you shard a topic by splitting it into partitions.
Messages are deterministically sent to the same partition based on their key. (the producer partitioner decides this)
This affinity mechanism doesn't allow independent and dynamic sharding of consumers. It's also too indirect.
If you want to change what consumer a certain key goes to, you by definition re-assign all the other keys in the partition.
Which keys are these? Idk. It's implicit. 🤷♂️
The paper proposes a system which explicitly (and dynamically) assigns based on a key range.
🛑5, 6, and 7
To keep this concise, I won't cover the other issues.
🛑 The End to End Principle is Violated
🛑 Race Conditions in Partition Assignments
🛑 Bespoke storage APIs
--
✨ THEIR SOLUTION ✨
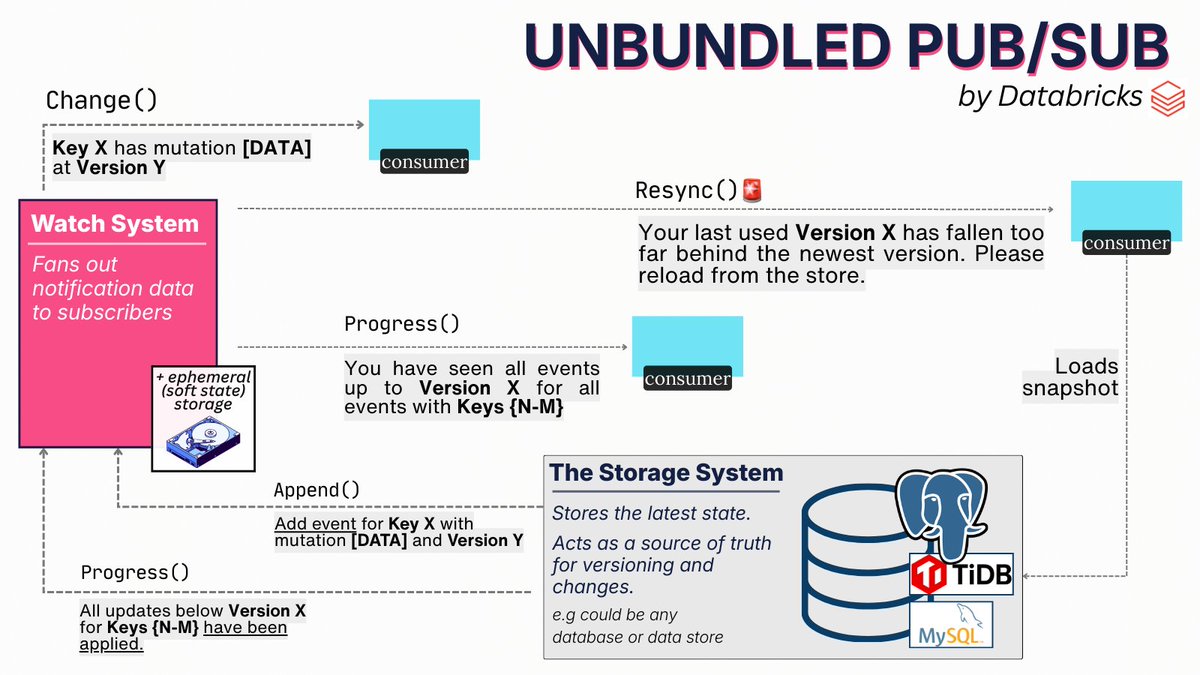
The paper proposes unbundling pub-sub into two systems:
• a storage abstraction
• a Watch notification abstraction
The storage is exposed to producers and consumers.
Consumers only see a narrow, read-only view of the underlying storage.
The system works roughly like this:
1. The producers write to the data store
2. The data store syncs updates to the watch system
3. The watch system fans out these updates to the interested consumers
The watch does not hold state and is not a source of truth. It only caches data for efficiency.
The watch exposes three signals:
• ⚡️Change()
A regular message notification. It includes the key, the version and the mutated data.
• ⚡️Progress()
This signal lets consumers know their state is fully point-in-time consistent up to the given version.
• ⚡️Resync()
This solves the silent dropping of messages problem.
When consumers fall behind the retained data, the watch sends a Resync signal that notifies them to reload their state from the underlying data store directly and efficiently.
👉 Any storage system can be used with this architecture.
The watch can be written as a layer on top of anything.
This avoids lock-in to the particular pub-sub’s storage system. It also allows users to choose the data store that's the best fit for their use case.
In the paper, Databricks shared that they are building Snappy.
It's a watch and ingest service made to work with MySQL and TiDB.
(wen Postgres guys?)
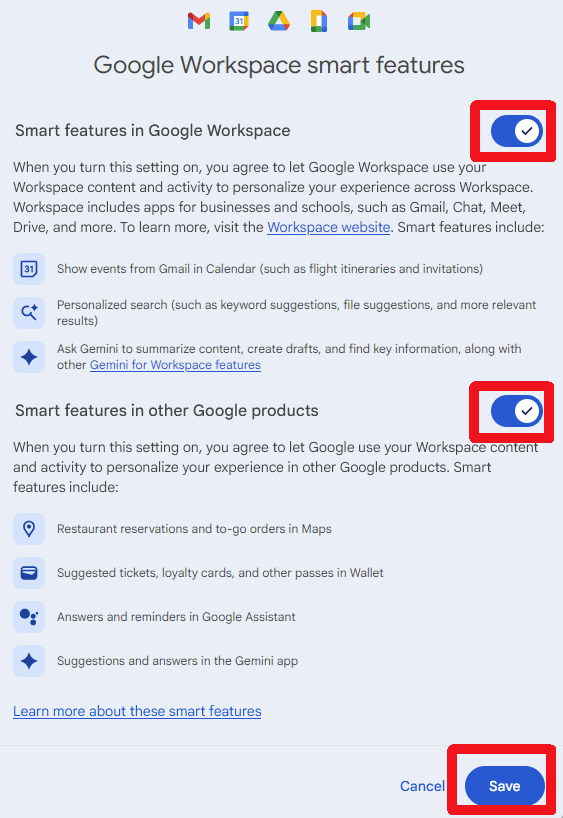
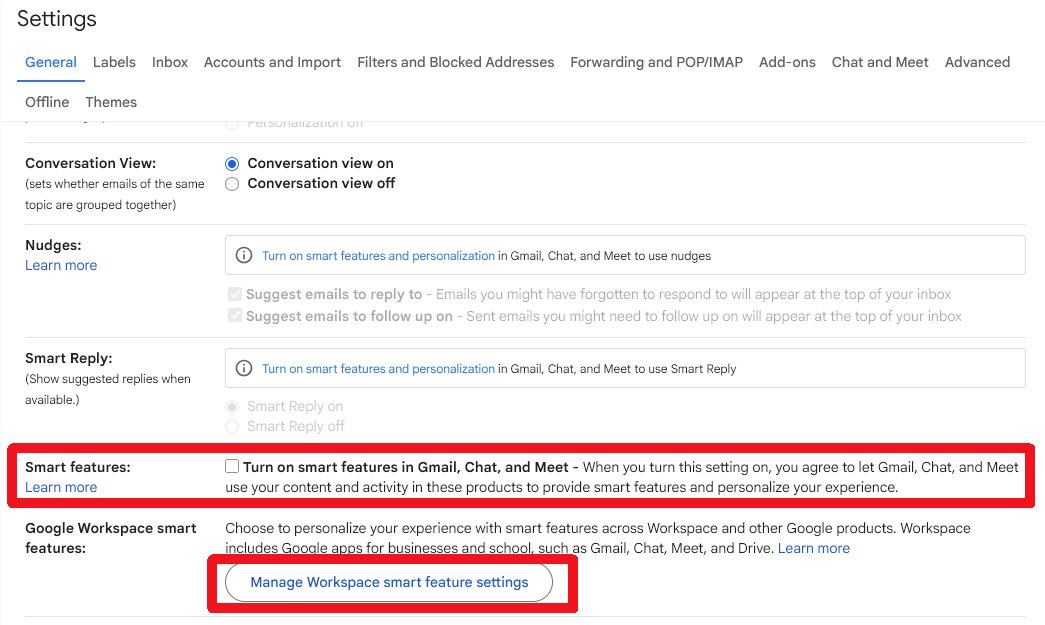
IMPORTANT message for everyone using Gmail.
You have been automatically OPTED IN to allow Gmail to access all your private messages & attachments to train AI models.
You have to manually turn off Smart Features in the Setting menu in TWO locations.
Retweet so every is aware.
How to run 1:1s for engineers
Most 1:1s drift into status updates, skip weeks, or turn into awkward small talk with no real output.
Here's what makes them useful: a simple structure you repeat every time.
Run them weekly, same time, same day
This isn't negotiable. Consistency signals that you care. Move them only when absolutely necessary. Your reports notice when you protect this time.
Use a shared doc
Write down what you discuss while they're talking. Not later. Right there in front of them. This creates accountability for both of you and gives you history to reference.
The 3-part structure
Ask these questions in order:
1. What are you working on? (10 min)
Keep this high-level. You're not managing tickets. You want to understand their focus and catch blockers early. Listen without interrupting.
2. What feels harder than it should? (10 min)
This is where you find real problems. Push past the surface. Ask "what exactly happened?" until you get to facts, not just feelings.
3. How can I help? (10 min)
Make an action plan. Be specific about next steps. If you say you'll do something, write it in the doc.
They should talk 70% of the time
Your job as a manager is to listen. Really listen. Not just wait for your turn to talk.
Questions that work
- Rate your happiness 1-10 (ask this regularly to track trends)
- What was the highlight and lowlight of your week?
- If I could change one thing to help you more, what would it be?
- How do you feel about your teammates?
- How do you feel about my management style?
Asking about feelings cuts through rationalization. People reveal more when you ask how they feel than when you ask what they think.
Career conversations are different
Don't force career talk into every 1:1. Most weeks, focus on the work. Every few months, have a dedicated career conversation that breaks from the routine.
Action items matter
End each 1:1 with clear next steps. Don't just discuss, but decide. Put those decisions in the doc where you can both track them.
Don't gossip
What they tell you stays between you. Not in all-hands. Not in leadership meetings. Not with their peers. Break this rule once and you'll never get honest feedback again.
👉 Learn more about 1:1s: https://t.co/aEoT6RPikB
Automated SAST, DAST, and SCA in CI/CD. Found 347 vulnerabilities in first week.
The old process:
- Manual security testing
- Quarterly pen tests
- Annual code audits
- Hope nothing breaks
- Reactive security
What we automated:
- SAST: SonarQube in every PR
- DAST: OWASP ZAP in staging
- SCA: Snyk for dependencies
- Container scanning: Trivy
- IaC scanning: Checkov
The CI/CD pipeline:
1. Code pushed to GitHub
2. SonarQube scans code
3. Snyk checks dependencies
4. Trivy scans Docker images
5. Build if no critical issues
6. Deploy to staging
7. OWASP ZAP runs automated scan
8. Block deployment if high severity
First week results:
- 347 vulnerabilities found
- 23 critical
- 89 high
- 235 medium/low
- Most were old
- Technical debt exposed
The critical findings:
- SQL injection possible in 4 endpoints
- XSS vulnerabilities in 7 pages
- Hardcoded secrets in 3 services
- Vulnerable dependencies everywhere
- Misconfigured CORS policies
The overwhelm:
- Team couldn't fix everything
- Deployment blocked for 3 days
- Had to prioritize
- Set thresholds temporarily
The strategy:
- Block new critical/high vulnerabilities
- Allow existing medium/low
- Create backlog for remediation
- Security sprint every quarter
- Gradually increased strictness
6 months later:
- New vulnerabilities: 347 -> 3 per month
- All critical/high fixed
- Medium/low being addressed
- Security debt decreasing
- No manual security reviews needed
Automate security testing early. Expect to find a lot. Fix incrementally. Prevention is cheaper than remediation.
icymi we wrote a new agents book: patterns for building ai agents
it has everything you need to take your agents from prototype to production, like agent design patterns, the basics of security, etc
reply to this tweet with BOOK and we'll dm you so you can get a copy